Mass Spectrometry Market Size 2026-2030
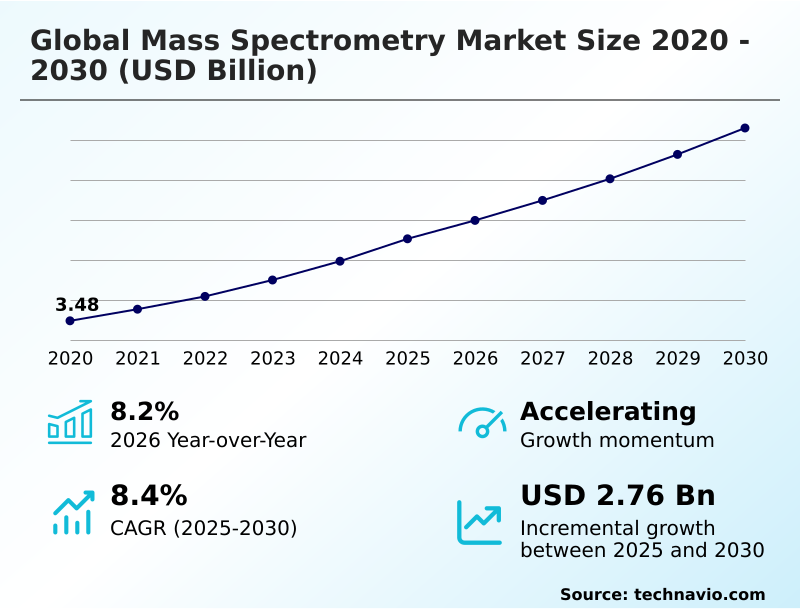
The mass spectrometry market size is valued to increase by USD 2.76 billion, at a CAGR of 8.4% from 2025 to 2030. Surging investment in pharmaceutical and biotechnology research and development will drive the mass spectrometry market.
Major Market Trends & Insights
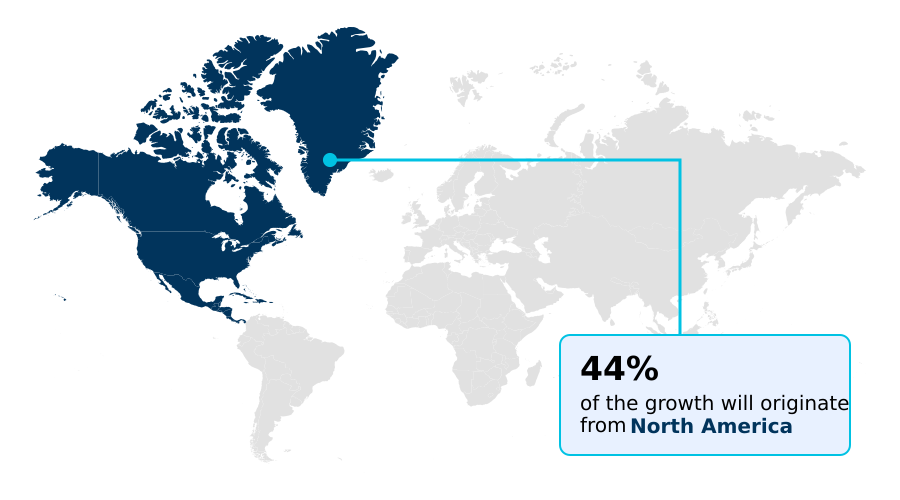
- North America dominated the market and accounted for a 44.4% growth during the forecast period.
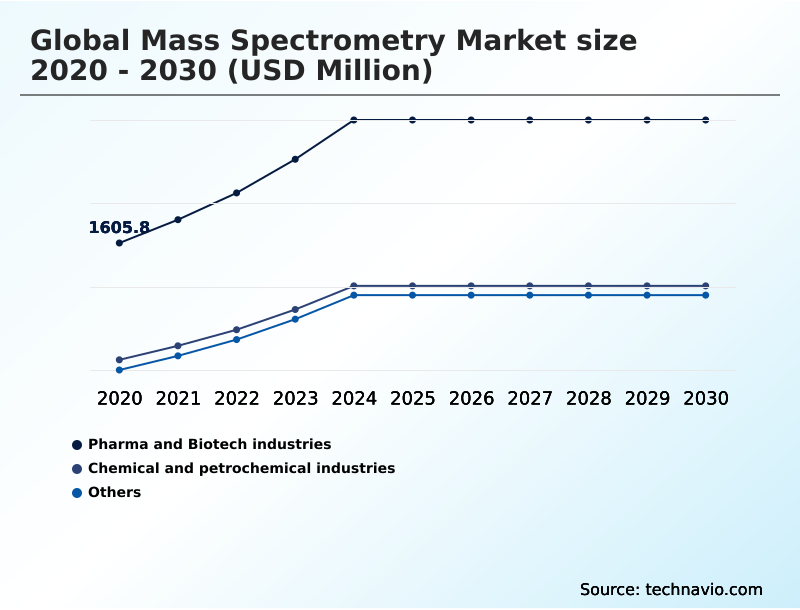
- By End-user - Pharma and Biotech industries segment was valued at USD 2.28 billion in 2024
- By Product - Instruments segment accounted for the largest market revenue share in 2024
Market Size & Forecast
- Market Opportunities: USD 4.81 billion
- Market Future Opportunities: USD 2.76 billion
- CAGR from 2025 to 2030 : 8.4%
Market Summary
- The Mass Spectrometry Market is defined by its critical role in precise molecular identification across scientific and industrial domains. Growth is underpinned by relentless R&D spending in pharmaceuticals and biotechnology, where techniques like high-resolution mass spectrometry are foundational to proteomics research platforms and metabolomics data analysis.
- This demand is amplified by increasingly strict global regulations governing food safety and environmental monitoring. A key trend is the integration of AI to manage the complex datasets generated, automating interpretation and accelerating discovery.
- For instance, a contract research organization can leverage an AI-driven tandem mass spectrometry (MS/MS) workflow to characterize a new biologic drug, reducing analytical turnaround time and ensuring stringent quality control compliance without manual oversight.
- However, the high capital equipment investment and total cost of ownership remain significant barriers, alongside a persistent shortage of skilled operators capable of managing these sophisticated systems. The push towards miniaturization for point-of-need testing is creating new application frontiers, democratizing access to this powerful analytical technology beyond traditional laboratory settings.
What will be the Size of the Mass Spectrometry Market during the forecast period?
Get Key Insights on Market Forecast (PDF) Get Free Sample
How is the Mass Spectrometry Market Segmented?
The mass spectrometry industry research report provides comprehensive data (region-wise segment analysis), with forecasts and estimates in "USD million" for the period 2026-2030, as well as historical data from 2020-2024 for the following segments.
- End-user
- Pharma and Biotech industries
- Chemical and petrochemical industries
- Others
- Product
- Instruments
- Consumables and services
- Technology
- QLC-MS
- GC-MS
- FT-MS
- ToFMS
- Others
- Geography
- North America
- US
- Canada
- Mexico
- Europe
- Germany
- UK
- France
- Asia
- Rest of World (ROW)
- North America
By End-user Insights
The pharma and biotech industries segment is estimated to witness significant growth during the forecast period.
The pharmaceutical and biotechnology sector is the principal end-user, where mass spectrometry is integral to the entire drug discovery pipeline. From initial research on proteomics research platforms to late-stage biopharmaceutical quality control, the technology is essential.
High-resolution mass spectrometry and tandem mass spectrometry (MS/MS) are central to biomarker discovery workflows and mandatory pharmacokinetic studies.
For complex biologics, comprehensive molecular characterization is required to ensure safety and efficacy, with analytical method validation being critical for regulatory submissions under good manufacturing practice standards.
As the industry moves toward personalized medicine applications, demand for validated turnkey kits from contract research organizations (CROs) is increasing, as they can accelerate development timelines by over 20% by streamlining complex characterization processes.
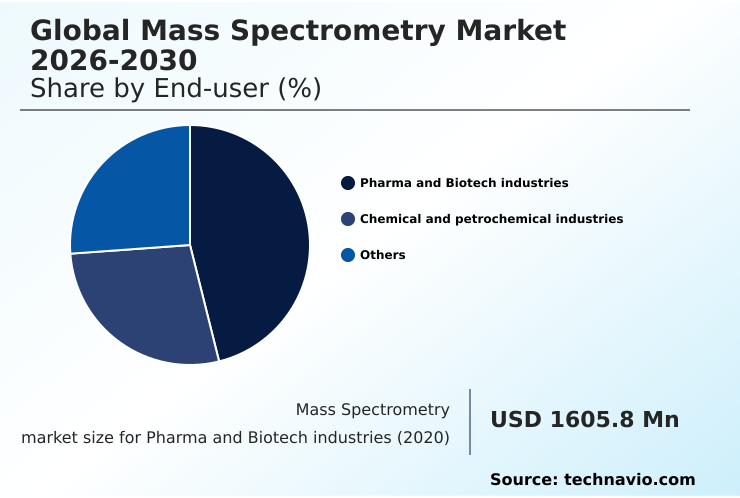
The Pharma and Biotech industries segment was valued at USD 2.28 billion in 2024 and showed a gradual increase during the forecast period.
Regional Analysis
North America is estimated to contribute 44.4% to the growth of the global market during the forecast period.Technavio’s analysts have elaborately explained the regional trends and drivers that shape the market during the forecast period.
See How Mass Spectrometry Market Demand is Rising in North America Get Free Sample
The geographic landscape is dominated by North America, which accounts for over 44% of incremental growth due to its extensive life sciences industry and stringent regulatory compliance testing mandates.
The region's leadership is reinforced by substantial government research funding, driving demand for advanced technologies like triple quadrupole mass spectrometers and liquid chromatography-tandem mass spectrometry for environmental pollutant analysis and food contaminant screening.
Meanwhile, Asia is the fastest-growing market, propelled by expanding pharmaceutical manufacturing and a heightened focus on food authenticity verification and safety.
The implementation of methods for non-targeted screening of emerging contaminants of concern in this region is increasing, requiring significant investment in capital equipment investment for trace-level detection.
This demand for inductively coupled plasma-mass spectrometry and other systems for isotope ratio measurement highlights the global need for precise analytical tools to meet diverse economic and regulatory pressures.
Market Dynamics
Our researchers analyzed the data with 2025 as the base year, along with the key drivers, trends, and challenges. A holistic analysis of drivers will help companies refine their marketing strategies to gain a competitive advantage.
- Strategic deployment of mass spectrometry technology is creating distinct value across multiple sectors, compelling organizations to assess specific applications to maximize return on investment. The use of lc-ms/ms for therapeutic drug monitoring is now a clinical standard, offering precision that older immunoassay techniques cannot match. Similarly, environmental labs depend on gc-ms analysis of volatile organic compounds for regulatory adherence.
- In pharmaceutical development, high-resolution ms for protein characterization is non-negotiable for biologic drugs, while maldi-tof for microbial identification has revolutionized clinical microbiology with its speed. For ensuring food safety, icp-ms for heavy metal testing is critical, and advances in q-tof ms in biomarker discovery are accelerating personalized medicine.
- The integration of ai in mass spectrometry data is a key enabler, particularly for complex mass spectrometry for metabolomics profiling. This software-driven approach is essential as the industry pushes towards portable mass spectrometer for field use and explores new frontiers like mass spectrometry for polymer analysis.
- Validating an in-house developed test for clinical diagnostics can take up to 50% longer than implementing a pre-cleared, turnkey assay kit, highlighting the operational advantage of standardized solutions. Ultimately, whether through tandem mass spectrometry for quantification, ft-icr for complex mixture analysis, or leveraging ion mobility separation for isomers, the focus is on efficient, reliable data generation.
What are the key market drivers leading to the rise in the adoption of Mass Spectrometry Industry?
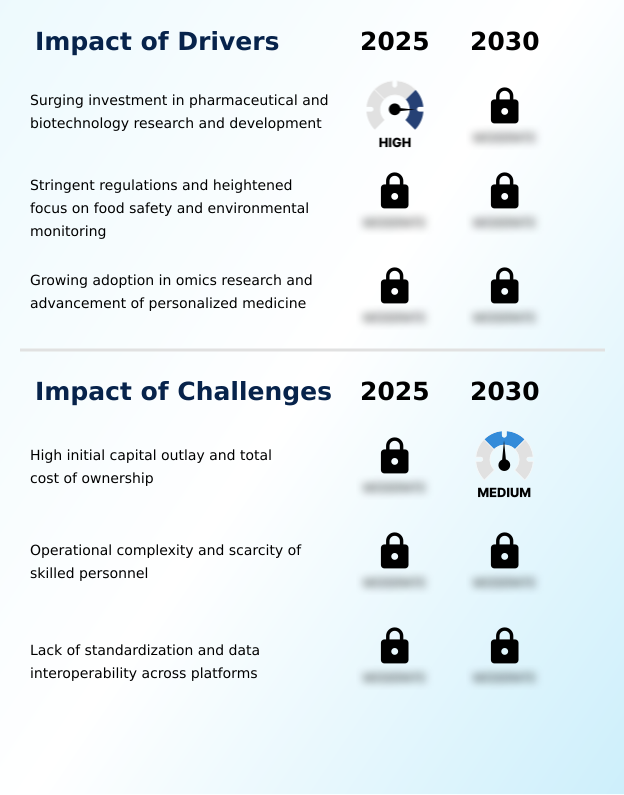
- The primary driver for the market is the surging investment in pharmaceutical and biotechnology research and development, where mass spectrometry is an indispensable analytical tool.
- Market growth is fundamentally driven by the expanding application of mass spectrometry in large-scale life sciences research and regulated industries.
- The demand for a systems biology approach necessitates significant capital equipment investment in high-performance platforms like fourier-transform mass spectrometry for deep omics data integration. This enables complex structural elucidation and post-translational modification analysis, which are critical for advancing pharmaceutical pipelines.
- The adoption of automated sample preparation workflows has been shown to increase laboratory throughput by over 40%, addressing the need for high-throughput screening.
- In regulated environments, the precision of quantitative analysis workflows using quadrupole liquid chromatography-mass spectrometry is non-negotiable for compliance.
- Furthermore, techniques such as pyrolysis-gas chromatography for materials science and advanced metabolomics data analysis for biomarker discovery continue to open new analytical frontiers, reinforcing the technology's essential role.
What are the market trends shaping the Mass Spectrometry Industry?
- A key market trend is the progressive miniaturization of instruments and the corresponding shift from centralized laboratories to point-of-need analysis. This evolution is driven by the demand for real-time data and immediate decision-making across various sectors.
- Key market trends are redefining operational paradigms, led by the shift toward decentralized analysis and software intelligence. The development of compact time-of-flight mass spectrometry systems with innovative ambient ionization sources is enabling true point-of-need testing, reducing sample-to-answer times from days to under an hour in field applications. This trend democratizes mass-to-charge ratio measurement, expanding its use beyond traditional labs.
- Concurrently, the integration of AI and machine learning into instrument control software is paramount. Predictive maintenance algorithms are proven to decrease instrument downtime by 30%, a critical metric in high-throughput settings.
- In clinical settings, the push for in vitro diagnostic regulation compliance is accelerating the adoption of validated clinical diagnostic assay kits that integrate seamlessly with a laboratory information system (lis), reducing validation overhead by over 50% and mitigating risks associated with a skilled personnel shortage.
What challenges does the Mass Spectrometry Industry face during its growth?
- A key challenge affecting industry growth is the high initial capital outlay and total cost of ownership associated with acquiring and maintaining mass spectrometry systems.
- Significant market challenges stem from the high total cost of ownership and inherent operational complexity of mass spectrometry systems. A primary hurdle is the lack of a universal data interoperability standard, which complicates operations in multi-vendor environments and can increase data integration costs for collaborative projects by up to 40%.
- The reliance on proprietary data format from different manufacturers hinders seamless qualitative compound identification and comparison across labs. This fragmentation requires extensive staff training and makes it difficult to standardize methods like selected reaction monitoring (srm) or leverage a common mass spectral library.
- While technologies like gas chromatography-mass spectrometry with electron ionization (ei) are mature, newer platforms such as quadrupole time-of-flight (q-tof) demand significant expertise. This skills gap impacts applications from forensic toxicology analysis to newborn screening programs, limiting the broader adoption of advanced process analytical technology and slowing market penetration.
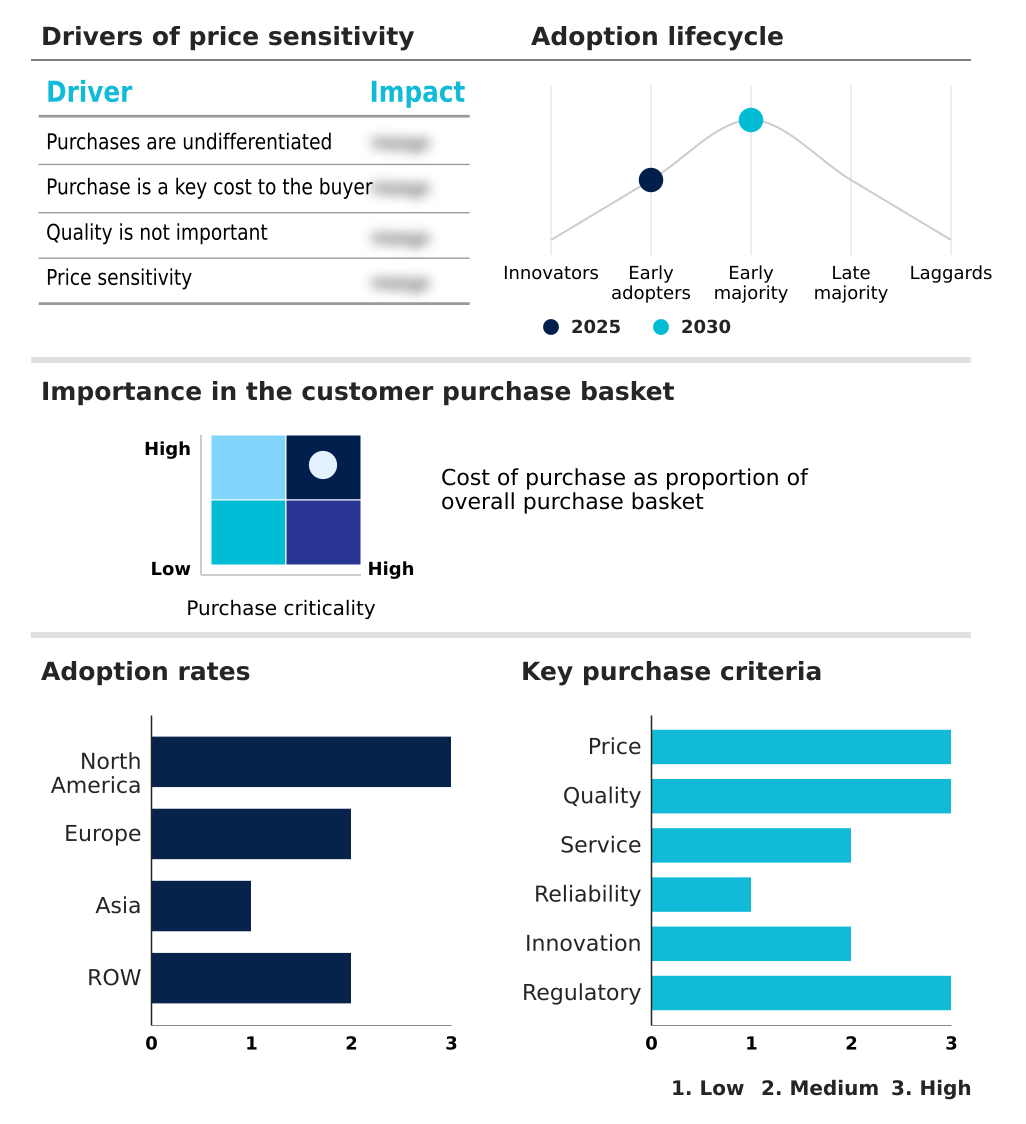
Exclusive Technavio Analysis on Customer Landscape
The mass spectrometry market forecasting report includes the adoption lifecycle of the market, covering from the innovator’s stage to the laggard’s stage. It focuses on adoption rates in different regions based on penetration. Furthermore, the mass spectrometry market report also includes key purchase criteria and drivers of price sensitivity to help companies evaluate and develop their market growth analysis strategies.
Customer Landscape of Mass Spectrometry Industry
Competitive Landscape
Companies are implementing various strategies, such as strategic alliances, mass spectrometry market forecast, partnerships, mergers and acquisitions, geographical expansion, and product/service launches, to enhance their presence in the industry.
908 Devices Inc. - Offerings encompass high-performance quantitative and qualitative mass spectrometry systems, including triple quadrupole, QTRAP, and high-resolution platforms designed for advanced analytical applications.
The industry research and growth report includes detailed analyses of the competitive landscape of the market and information about key companies, including:
- 908 Devices Inc.
- AB SCIEX LLC
- Advion Inc.
- Agilent Technologies Inc.
- AMETEK Inc.
- Analytik Jena GmbH Co KG
- Bruker Corp.
- Exum Instruments
- Hiden Analytical
- Hitachi High Tech Corp.
- JEOL Ltd.
- Kore Technology Ltd.
- LECO Corp.
- MOBILion Systems Inc.
- PerkinElmer US LLC
- Rigaku Corp.
- Shimadzu Corp.
- Skyray Instruments USA Inc.
- Thermo Fisher Scientific Inc.
- Waters Corp.
Qualitative and quantitative analysis of companies has been conducted to help clients understand the wider business environment as well as the strengths and weaknesses of key industry players. Data is qualitatively analyzed to categorize companies as pure play, category-focused, industry-focused, and diversified; it is quantitatively analyzed to categorize companies as dominant, leading, strong, tentative, and weak.
Recent Development and News in Mass spectrometry market
- In April 2025, Dow Chemical announced a novel Pyrolysis-Gas Chromatography-Time-of-Flight Mass Spectrometry workflow to advance chemical recycling processes by enabling detailed characterization of recycled polymer feedstocks.
- In March 2025, the U.S. Environmental Protection Agency validated a new analytical method using advanced Liquid Chromatography-Tandem Mass Spectrometry instruments for monitoring 52 different PFAS compounds in wastewater nationwide.
- In November 2024, Waters Corporation launched its Xevo MRT Mass Spectrometer, a benchtop system incorporating multi-reflecting time-of-flight technology to deliver high resolution for large-scale biomedical research applications.
- In September 2024, Thermo Fisher Scientific enhanced its Ardia platform, a unified software ecosystem, to improve security and connectivity for managing chromatography and mass spectrometry systems across multi-vendor laboratory environments.
Dive into Technavio’s robust research methodology, blending expert interviews, extensive data synthesis, and validated models for unparalleled Mass Spectrometry Market insights. See full methodology.
| Market Scope | |
|---|---|
| Page number | 294 |
| Base year | 2025 |
| Historic period | 2020-2024 |
| Forecast period | 2026-2030 |
| Growth momentum & CAGR | Accelerate at a CAGR of 8.4% |
| Market growth 2026-2030 | USD 2762.7 million |
| Market structure | Fragmented |
| YoY growth 2025-2026(%) | 8.2% |
| Key countries | US, Canada, Mexico, Germany, UK, France, Italy, Spain, The Netherlands, China, Japan, India, South Korea, Indonesia, Thailand, Brazil, Israel, Saudi Arabia, South Africa, Turkey, UAE, Argentina and Colombia |
| Competitive landscape | Leading Companies, Market Positioning of Companies, Competitive Strategies, and Industry Risks |
Research Analyst Overview
- The mass spectrometry market is sustained by its indispensable role in molecular analysis, evolving beyond hardware to intelligent, workflow-centric ecosystems. Its utility in elemental composition determination and mass-to-charge ratio measurement forms the basis for a diverse range of platforms.
- Core technologies include quadrupole liquid chromatography-mass spectrometry for quantitative tasks and gas chromatography-mass spectrometry, a staple in routine testing with its extensive mass spectral library. Advanced discovery is powered by fourier-transform mass spectrometry and high-resolution mass spectrometry, which enable deep proteomics research platforms and metabolomics data analysis.
- Techniques such as tandem mass spectrometry (ms/ms) and selected reaction monitoring (srm) are workhorses in pharmacokinetic studies and clinical diagnostic assays. The technology's breadth is shown by systems like the quadrupole time-of-flight (q-tof) for biomarker discovery workflows and inductively coupled plasma-mass spectrometry for environmental pollutant analysis.
- Key ionization methods include electrospray ionization (esi), electron ionization (ei), and matrix-assisted laser desorption/ionization, complemented by ambient ionization sources and ion mobility spectrometry. The shift toward software-driven analysis is a critical boardroom consideration; adopting AI-powered structural elucidation tools can improve data interpretation efficiency by over 40%, justifying a strategic shift in budget from pure capital equipment to integrated software platforms.
- This evolution is crucial for applications from biopharmaceutical quality control and food contaminant screening to forensic toxicology analysis, all governed by standards like good manufacturing practice and connected via laboratory information system (lis) integration.
What are the Key Data Covered in this Mass Spectrometry Market Research and Growth Report?
-
What is the expected growth of the Mass Spectrometry Market between 2026 and 2030?
-
USD 2.76 billion, at a CAGR of 8.4%
-
-
What segmentation does the market report cover?
-
The report is segmented by End-user (Pharma and Biotech industries, Chemical and petrochemical industries, and Others), Product (Instruments, and Consumables and services), Technology (QLC-MS, GC-MS, FT-MS, ToFMS, and Others) and Geography (North America, Europe, Asia, Rest of World (ROW))
-
-
Which regions are analyzed in the report?
-
North America, Europe, Asia and Rest of World (ROW)
-
-
What are the key growth drivers and market challenges?
-
Surging investment in pharmaceutical and biotechnology research and development, High initial capital outlay and total cost of ownership
-
-
Who are the major players in the Mass Spectrometry Market?
-
908 Devices Inc., AB SCIEX LLC, Advion Inc., Agilent Technologies Inc., AMETEK Inc., Analytik Jena GmbH Co KG, Bruker Corp., Exum Instruments, Hiden Analytical, Hitachi High Tech Corp., JEOL Ltd., Kore Technology Ltd., LECO Corp., MOBILion Systems Inc., PerkinElmer US LLC, Rigaku Corp., Shimadzu Corp., Skyray Instruments USA Inc., Thermo Fisher Scientific Inc. and Waters Corp.
-
Market Research Insights
- The market's momentum is shaped by a convergence of advanced applications and operational efficiencies. The adoption of a systems biology approach, powered by omics data integration and sophisticated quantitative analysis workflows, is expanding possibilities in personalized medicine applications and the broader drug discovery pipeline.
- Instrument control software with predictive maintenance algorithms can reduce equipment downtime by over 30%, maximizing return on capital equipment investment. Concurrently, the use of automated sample preparation improves laboratory throughput by up to 40%. The demand for validated turnkey kits is rising, simplifying analytical method validation for contract research organizations (CROs).
- As the industry shifts toward cloud-based data platforms, addressing the skilled personnel shortage and navigating multi-vendor instrument environments become key strategic priorities for sustainable growth and innovation.
We can help! Our analysts can customize this mass spectrometry market research report to meet your requirements.
 RIA -
RIA - 
