Media Asset Management (MAM) Solutions Market Analysis, Size, and Forecast 2026-2030: North America (US, Canada, and Mexico), Europe (UK, Germany, and France), APAC (China, Japan, and India), South America (Brazil, Argentina, and Chile), Middle East and Africa (Saudi Arabia, UAE, and South Africa), and Rest of World (ROW)

Media Asset Management (MAM) Solutions Market Analysis, Size, and Forecast 2026-2030:
North America (US, Canada, and Mexico), Europe (UK, Germany, and France), APAC (China, Japan, and India), South America (Brazil, Argentina, and Chile), Middle East and Africa (Saudi Arabia, UAE, and South Africa), and Rest of World (ROW)

Published: May 2026 294 Pages SKU: IRTNTR44724

Market Overview at a Glance

$2.64 B
Market Opportunity
17%
CAGR 2025 - 2030
29.9%
Europe Growth
$1.19 B
On-premises segment 2024

Media Asset Management (Mam) Solutions Market Size 2026-2030

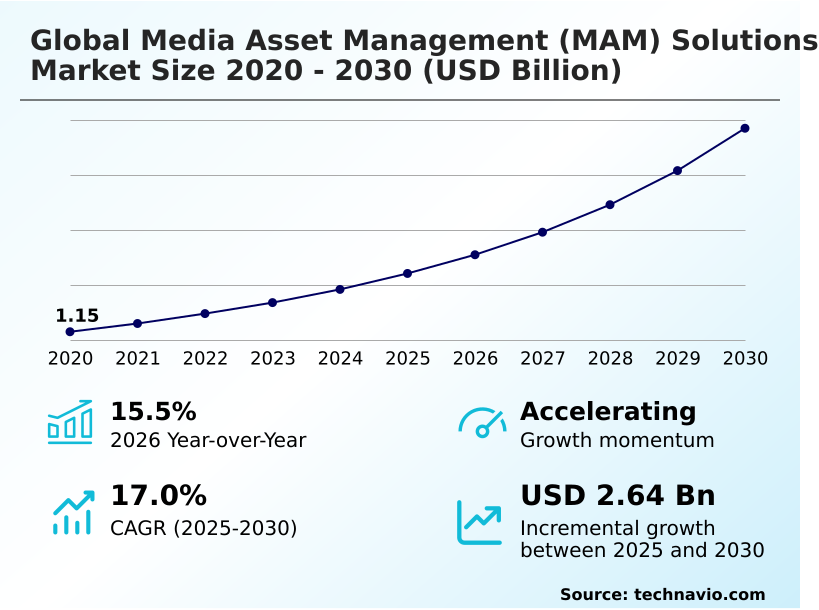
The media asset management (mam) solutions market size is valued to increase by USD 2.64 billion, at a CAGR of 17% from 2025 to 2030. Exponential surge in digital video consumption across global platforms will drive the media asset management (mam) solutions market.

Major Market Trends & Insights

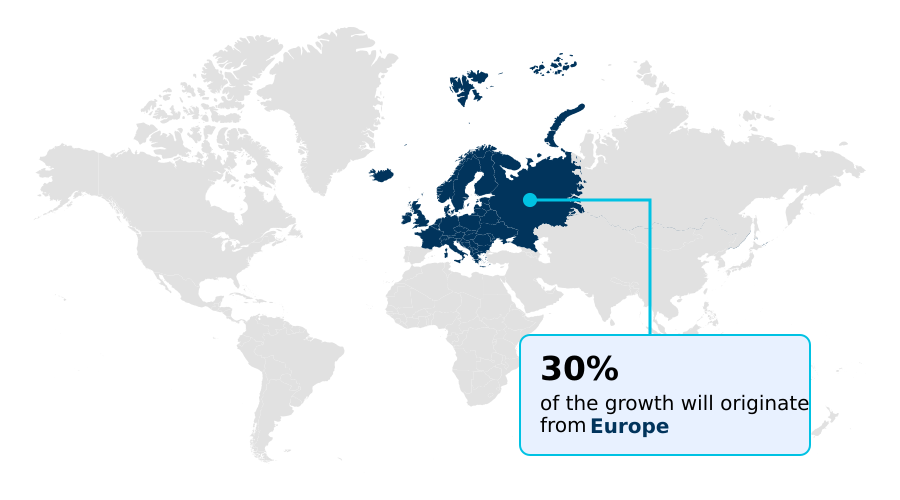
  • Europe dominated the market and accounted for a 29.9% growth during the forecast period.
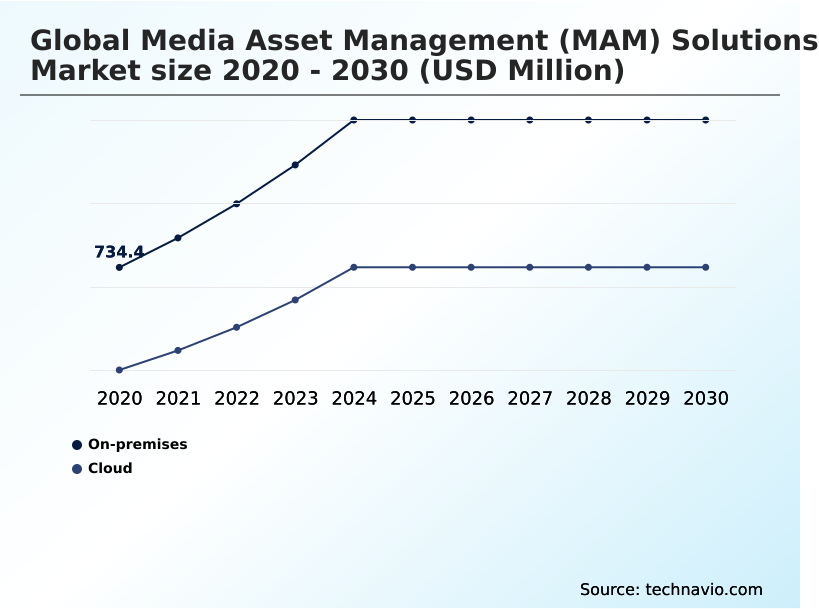
  • By Deployment - On-premises segment was valued at USD 1.19 billion in 2024
  • By Type - Small and medium size enterprise segment accounted for the largest market revenue share in 2024

Market Size & Forecast

  • Market Opportunities: USD 3.70 billion
  • Market Future Opportunities: USD 2.64 billion
  • CAGR from 2025 to 2030 : 17%

Market Summary

  • The Media Asset Management (MAM) Solutions Market is rapidly transitioning from passive archive storage into highly intelligent, automated workflow orchestration hubs. Media organizations and corporate marketing teams face immense pressure to deliver personalized, multiformat rich media across diverse digital endpoints.
  • This operational necessity drives the deployment of advanced software platforms featuring browser based access, allowing distributed production teams to collaborate simultaneously via edge computing deployments. In modern distribution environments, smart content discovery can reduce manual video cataloging time by up to 60%, significantly lowering overhead costs and accelerating time-to-market.
  • The primary catalyst for this adoption is the exponential growth of digital streaming platforms, which forces broadcasters to systematically index and repurpose legacy content to capture shifting audience demographics. Conversely, the transition to decentralized computing introduces a severe structural challenge, as unauthorized data exposure within third-party servers necessitates heavy investments in multi factor authentication and end to end encryption.
  • Consequently, balancing frictionless remote access with rigorous intellectual property protection remains a critical priority for enterprise technology administrators.

What will be the Size of the Media Asset Management (Mam) Solutions Market during the forecast period?

Get Key Insights on Market Forecast (PDF) Get Free Sample

How is the Media Asset Management (Mam) Solutions Market Segmented?

The media asset management (mam) solutions industry research report provides comprehensive data (region-wise segment analysis), with forecasts and estimates in "USD million" for the period 2026-2030, as well as historical data from 2020-2024 for the following segments.

  • Deployment
    • On-premises
    • Cloud
  • Type
    • Small and medium size enterprise
    • Large enterprise
  • End-user
    • Media and entertainment
    • Advertising and marketing
    • Education and e-learning
    • Others
  • Geography
    • North America
      • US
      • Canada
      • Mexico
    • Europe
      • UK
      • Germany
      • France
      • Italy
      • Spain
      • The Netherlands
    • APAC
      • China
      • Japan
      • India
      • South Korea
      • Australia
      • Indonesia
    • South America
      • Brazil
      • Argentina
      • Chile
    • Middle East and Africa
      • Saudi Arabia
      • UAE
      • South Africa
      • Israel
      • Turkey

By Deployment Insights

The on-premises segment is estimated to witness significant growth during the forecast period.

The Media Asset Management (MAM) Solutions Market demonstrates distinct adoption behaviors based on infrastructure control requirements and data sovereignty mandates. On-premises frameworks provide organizations with localized compute servers that completely insulate high-value intellectual property from external network vulnerabilities.

This architecture eliminates volume-dependent data egress fees associated with processing ultra high definition formats, resulting in operating cost efficiencies that improve by up to 25% for high-throughput broadcasting facilities.

Maintaining a centralized media repository within a private data center guarantees ultra-low latency connections necessary for frame accurate editing and live channel origination.

By implementing strict role based access and internal zero trust security protocols, media enterprises enforce absolute compliance while utilizing digital piracy protection to mitigate the risks of unauthorized content distribution across omnichannel distribution frameworks.

Get Free Sample

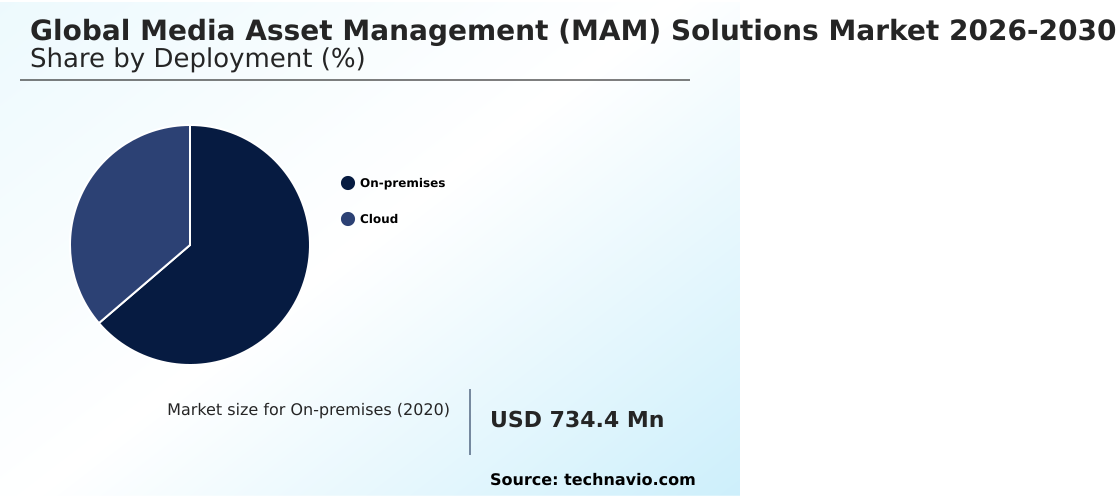
The On-premises segment was valued at USD 1.19 billion in 2024 and showed a gradual increase during the forecast period.

Get Free Sample

Regional Analysis

Europe is estimated to contribute 29.9% to the growth of the global market during the forecast period.Technavio’s analysts have elaborately explained the regional trends and drivers that shape the market during the forecast period.

See How Media Asset Management (Mam) Solutions Market Demand is Rising in Europe Get Free Sample

The Media Asset Management (MAM) Solutions Market exhibits distinct regional trajectories driven by varying infrastructure maturity and content consumption patterns.

North America dominates adoption due to a highly concentrated ecosystem of major Hollywood studios migrating toward cloud native orchestration, resulting in a 40% faster deployment rate of remote post-production tools compared to Europe.

European broadcasters, conversely, prioritize stringent digital rights management and automated compliance screening to adhere to localized data sovereignty laws.

Meanwhile, the APAC region demonstrates an aggressive shift toward mobile-first digital broadcasting, where telecommunications infrastructure upgrades support a 25% increase in high capacity storage nodes utilization for regional streaming hubs.

These divergent infrastructural realities compel software developers to customize their go-to-market strategies, offering ultra-secure architectures in Europe while pushing elastic scalability parameters across rapidly expanding Asian media ecosystems.

Market Dynamics

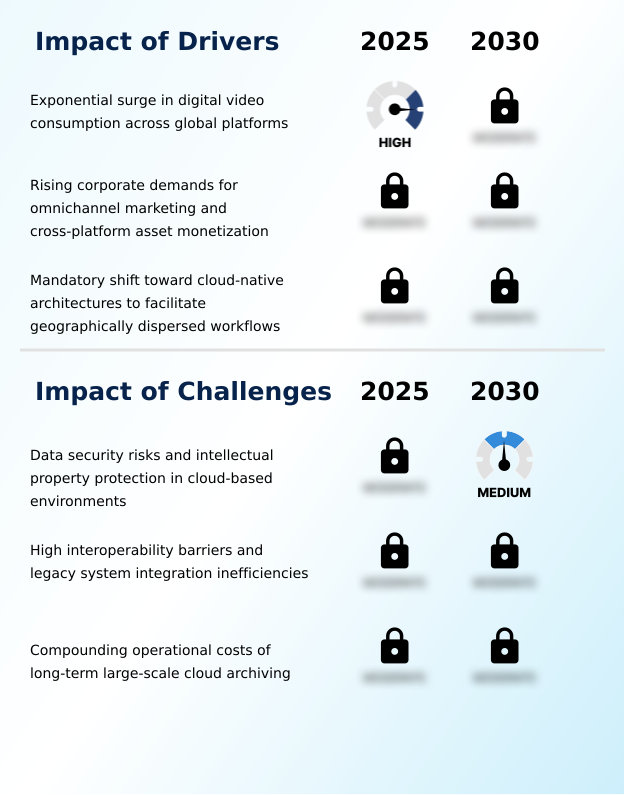
Our researchers analyzed the data with 2025 as the base year, along with the key drivers, trends, and challenges. A holistic analysis of drivers will help companies refine their marketing strategies to gain a competitive advantage.

  • The continuous evolution of the Media Asset Management (MAM) Solutions Market requires enterprises to completely rethink their operational supply chains to support heavy digital workflows. Central to this transformation is the deployment of automated video metadata generation engines, which utilize machine learning indexing to instantly tag, categorize, and log massive volumes of daily production footage.
  • This immediate categorization capability enables editors to locate exact visual sequences significantly faster than manual archiving methods, increasing overall studio output capacity by nearly 50% compared to legacy setups without requiring additional headcount.
  • Organizations are simultaneously adopting cloud native media asset orchestration to coordinate complex tasks across disparate geographic locations, allowing colorists and audio engineers to work collaboratively on identical master files with zero latency in real time rendering.
  • As broadcasting networks upgrade their live news infrastructures, the integration of ai assisted broadcast newsroom workflows fundamentally changes how breaking stories are assembled and distributed, minimizing the lag between ingest and transmission.
  • To balance the high costs of active digital storage, technology directors are implementing sophisticated hybrid content storage archive management protocols, which intelligently route frequently accessed files to premium fast-tier servers while moving legacy material to cost-effective cold storage.
  • Finally, the establishment of comprehensive omnichannel video content distribution systems ensures that final commercial assets are correctly formatted and seamlessly pushed to diverse social media platforms, video on demand networks, and traditional linear television feeds concurrently.

What are the key market drivers leading to the rise in the adoption of Media Asset Management (Mam) Solutions Industry?

  • An exponential surge in digital video consumption across streaming platforms serves as a primary catalyst accelerating the adoption of sophisticated content orchestration frameworks.

  • The necessity to streamline remote collaboration across geographically dispersed production teams acts as a dominant driver propelling the Media Asset Management (MAM) Solutions Market. As organizations embrace decentralized workforce environments, traditional localized storage becomes entirely impractical for heavy media workloads.
  • Businesses implement proxy based workflows and file transcoding engines to enable editors to manipulate lightweight files via standard internet connections. This architectural adjustment causes network bandwidth consumption to drop by up to 60%, drastically lowering telecommunications expenses.
  • The effect is a highly elastic production environment where multinational studios can decrease time-to-market for premium content by 25%.
  • Centralizing these operations within a secure digital perimeter ensures that all stakeholders have instant, synchronized access to mission-critical creative assets necessary for seamless broadcast playout automation.

What are the market trends shaping the Media Asset Management (Mam) Solutions Industry?

  • The deep integration of multimodal artificial intelligence and machine learning models for automated metadata enrichment represents a definitive industry trend. This technological advancement significantly accelerates content discovery and optimizes archive monetization across modern distribution channels.

  • The pervasive adoption of automated metadata enrichment and multimodal artificial intelligence marks a fundamental trend redefining the Media Asset Management (MAM) Solutions Market. Media enterprises are moving away from manual cataloging to automated ingestion pipelines that analyze visual and auditory data instantaneously.
  • Because manual logging creates severe production bottlenecks, the shift toward intelligent audio ducking automation and facial recognition software reduces archival processing times by over 45%. This automation directly impacts business operations by allowing creative teams to repurpose existing interactive graphic assets with 30% greater efficiency, maximizing the lifecycle value of historical media.
  • Furthermore, integrating neural machine translation directly into central asset hubs accelerates global distribution, ensuring that international content variants are generated seamlessly to meet immediate consumer demand across diverse regional endpoints.

What challenges does the Media Asset Management (Mam) Solutions Industry face during its growth?

  • Escalating data security risks and complex intellectual property protection requirements within decentralized cloud environments present substantial structural challenges to sustained industry expansion.

  • The structural complexities associated with legacy system integration create persistent operational friction within the Media Asset Management (MAM) Solutions Market. Many established broadcasting networks rely on disparate, older-generation storage area networks that lack native interoperability with modern hybrid storage architectures.
  • Because bridging these fragmented systems requires highly customized software hooks, engineering teams experience integration latencies that can increase deployment timelines by up to 40%. This lack of metadata schema standardization causes significant data packet loss during major archive migrations, inadvertently inflating IT troubleshooting costs by 20%.
  • Consequently, technology administrators face an ongoing challenge balancing the immediate need for advanced media asset accessibility, secured by forensic watermarking tools, against the escalating financial burden of maintaining custom middleware and resolving structural network incompatibilities.

Exclusive Technavio Analysis on Customer Landscape

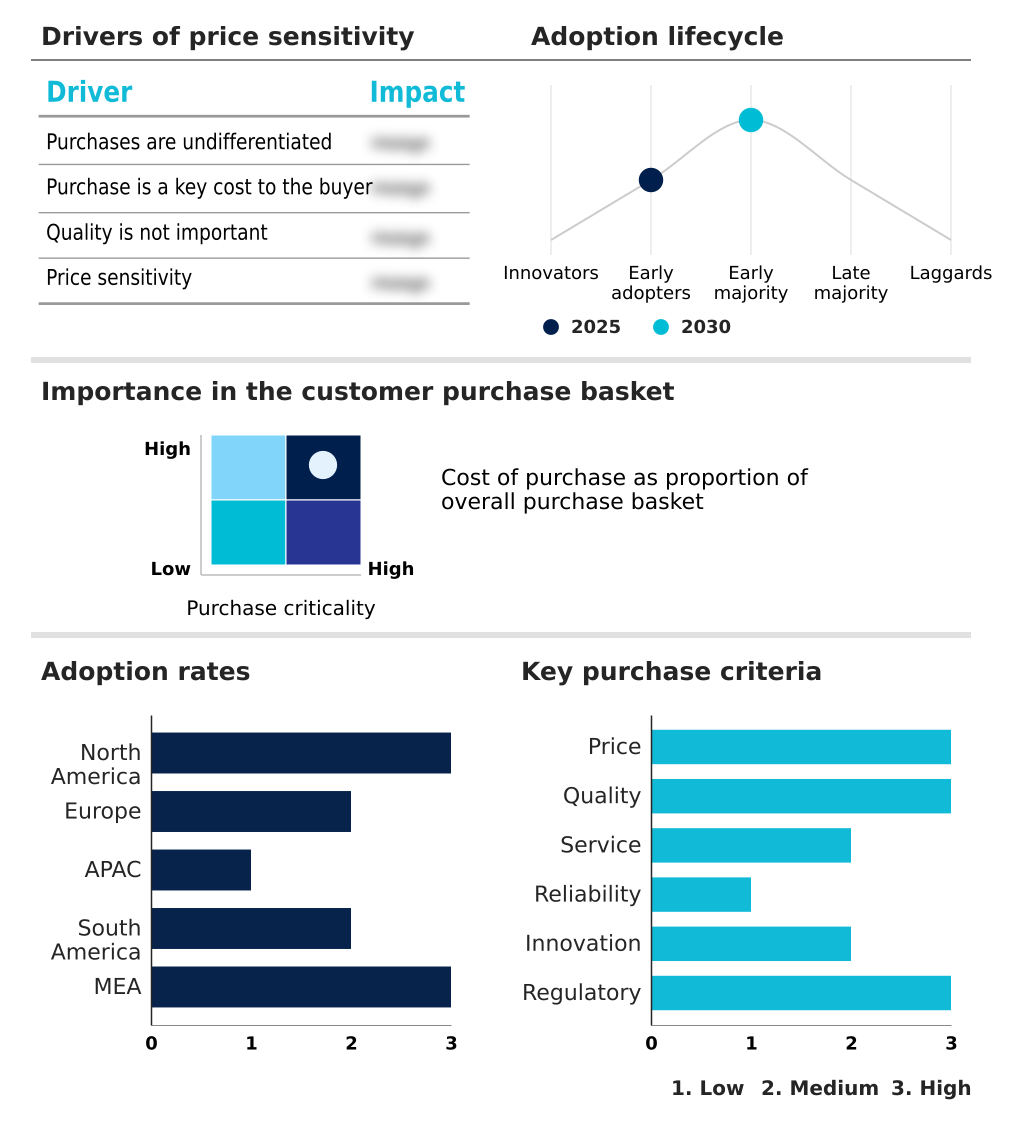
The media asset management (mam) solutions market forecasting report includes the adoption lifecycle of the market, covering from the innovator’s stage to the laggard’s stage. It focuses on adoption rates in different regions based on penetration. Furthermore, the media asset management (mam) solutions market report also includes key purchase criteria and drivers of price sensitivity to help companies evaluate and develop their market growth analysis strategies.

Customer Landscape of Media Asset Management (Mam) Solutions Industry

Competitive Landscape

Companies are implementing various strategies, such as strategic alliances, media asset management (mam) solutions market forecast, partnerships, mergers and acquisitions, geographical expansion, and product/service launches, to enhance their presence in the industry.

Acquia Inc. - The vendor delivers comprehensive digital asset management, product information management, and unified content hub software designed to centralize multimedia files and optimize omnichannel distribution pipelines efficiently.

The industry research and growth report includes detailed analyses of the competitive landscape of the market and information about key companies, including:

  • Acquia Inc.
  • Adobe Inc.
  • Aprimo
  • Avid Technology Inc.
  • Brandfolder Inc.
  • Bynder B.V.
  • Canto Inc.
  • CELUM GmbH
  • Cloudinary Ltd.
  • Dalet SA
  • Daminion Software
  • Evolphin Software Inc.
  • Frontify AG
  • Iconik Media AB
  • Imagen Ltd.
  • MediaValet Inc.
  • Orange Logic LLC
  • Papirfly Group
  • PhotoShelter Inc.
  • Quantum Corp.

Qualitative and quantitative analysis of companies has been conducted to help clients understand the wider business environment as well as the strengths and weaknesses of key industry players. Data is qualitatively analyzed to categorize companies as pure play, category-focused, industry-focused, and diversified; it is quantitatively analyzed to categorize companies as dominant, leading, strong, tentative, and weak.

Recent Development and News in Media asset management (mam) solutions market

  • In the Application Software industry, the widespread transition toward microservices containerization has dramatically accelerated the deployment of modular system updates, directly impacting Media Asset Management (MAM) Solutions demand by allowing broadcasters to scale processing power dynamically without interrupting live workflows.
  • The enforcement of stringent data privacy regulations like the General Data Protection Regulation has mandated stricter digital rights management capabilities, directly impacting Media Asset Management (MAM) Solutions demand by requiring advanced compliance tracking and automated consent verification systems.
  • The accelerated integration of multimodal artificial intelligence into enterprise productivity suites has redefined metadata schema standardization, directly impacting Media Asset Management (MAM) Solutions demand by reducing manual tagging times and improving search accuracy by over 40%.
  • The implementation of advanced neural machine translation application programming interfaces has transformed global localization processes, directly impacting Media Asset Management (MAM) Solutions demand by enabling simultaneous multi-language subtitle generation for international streaming syndication.

Dive into Technavio’s robust research methodology, blending expert interviews, extensive data synthesis, and validated models for unparalleled Media Asset Management (Mam) Solutions Market insights. See full methodology.

Market Scope
Page number 294
Base year 2025
Historic period 2020-2024
Forecast period 2026-2030
Growth momentum & CAGR Accelerate at a CAGR of 17%
Market growth 2026-2030 USD 2640.1 million
Market structure Fragmented
YoY growth 2025-2026(%) 15.5%
Key countries US, Canada, Mexico, UK, Germany, France, Italy, Spain, The Netherlands, China, Japan, India, South Korea, Australia, Indonesia, Brazil, Argentina, Chile, Saudi Arabia, UAE, South Africa, Israel and Turkey
Competitive landscape Leading Companies, Market Positioning of Companies, Competitive Strategies, and Industry Risks

Request Free Sample

Research Analyst Overview

  • The Media Asset Management (MAM) Solutions Market functions as the essential operational backbone for modern digital content supply chains. As organizations transition toward decentralized digital environments, the implementation of deep learning models and speech to text transcription algorithms radically alters how multimedia libraries are organized.
  • This technological shift directly supports boardroom-level budgeting decisions by converting dormant tape archives into highly searchable, monetizable digital inventories. Enterprises leveraging automated localization pipelines and semantic search engine capabilities have achieved a 30% reduction in processing time for international syndication releases compared to traditional manual formatting workflows.
  • Furthermore, the adoption of microservices containerization allows engineering teams to deploy targeted system updates without disrupting live broadcast feeds. This continuous architectural evolution prevents workflow stagnation and optimizes resource allocation across distributed production facilities.
  • By enforcing rigorous data protocols and automated threat detection, media conglomerates successfully safeguard high-value proprietary assets from increasingly sophisticated cyber vulnerabilities, ensuring absolute compliance with international intellectual property regulations.

What are the Key Data Covered in this Media Asset Management (Mam) Solutions Market Research and Growth Report?

  • What is the expected growth of the Media Asset Management (Mam) Solutions Market between 2026 and 2030?

    • USD 2.64 billion, at a CAGR of 17%

  • What segmentation does the market report cover?

    • The report is segmented by Deployment (On-premises, and Cloud), Type (Small and medium size enterprise, and Large enterprise), End-user (Media and entertainment, Advertising and marketing, Education and e-learning, and Others) and Geography (North America, Europe, APAC, South America, Middle East and Africa)

  • Which regions are analyzed in the report?

    • North America, Europe, APAC, South America and Middle East and Africa

  • What are the key growth drivers and market challenges?

    • Exponential surge in digital video consumption across global platforms, Data security risks and intellectual property protection in cloud-based environments

  • Who are the major players in the Media Asset Management (Mam) Solutions Market?

    • Acquia Inc., Adobe Inc., Aprimo, Avid Technology Inc., Brandfolder Inc., Bynder B.V., Canto Inc., CELUM GmbH, Cloudinary Ltd., Dalet SA, Daminion Software, Evolphin Software Inc., Frontify AG, Iconik Media AB, Imagen Ltd., MediaValet Inc., Orange Logic LLC, Papirfly Group, PhotoShelter Inc. and Quantum Corp.

Market Research Insights

  • The Media Asset Management (MAM) Solutions Market continually adapts to support the high-velocity demands of modern enterprise operations. By implementing predictive analytics tracking and robust version control mechanisms, production facilities have improved final-cut delivery speeds by 35% compared to legacy offline processes. The integration of api integration layers facilitates seamless communication between centralized media databases and remote video editing suites.
  • This interoperability ensures that creative teams operate with 20% fewer administrative bottlenecks utilizing automated tagging algorithms to sort massive file batches. Furthermore, establishing comprehensive disaster recovery capabilities protects uncompressed raw video against systemic network failures, preventing costly production halts and ensuring absolute business continuity across geographically distributed broadcasting networks.

We can help! Our analysts can customize this media asset management (mam) solutions market research report to meet your requirements.

Get in touch

1. Executive Summary

1.1 Market overview

Executive Summary - Chart on Market Overview
Executive Summary - Data Table on Market Overview
Executive Summary - Chart on Global Market Characteristics
Executive Summary - Chart on Market by Geography
Executive Summary - Chart on Market Segmentation by Deployment
Executive Summary - Chart on Market Segmentation by Type
Executive Summary - Chart on Market Segmentation by End-user
Executive Summary - Chart on Incremental Growth
Executive Summary - Data Table on Incremental Growth
Executive Summary - Chart on Company Market Positioning

2. Technavio Analysis

2.1 Analysis of price sensitivity, lifecycle, customer purchase basket, adoption rates, and purchase criteria

2.2 Criticality of inputs and Factors of differentiation

Chart on Overview on criticality of inputs and factors of differentiation

2.3 Factors of disruption

Chart on Overview on factors of disruption

2.4 Impact of drivers and challenges

Chart on Impact of drivers and challenges in 2025 and 2030

3. Market Landscape

3.1 Market ecosystem

Chart on Parent Market
Data Table on - Parent Market

3.2 Market characteristics

Chart on Market characteristics analysis

3.3 Value chain analysis

Chart on Value chain analysis

4. Market Sizing

4.1 Market definition

Data Table on Offerings of companies included in the market definition

4.2 Market segment analysis

Market segments

4.3 Market size 2025

4.4 Market outlook: Forecast for 2025-2030

Chart on Global - Market size and forecast 2025-2030 ($ million)
Data Table on Global - Market size and forecast 2025-2030 ($ million)
Chart on Global Market: Year-over-year growth 2025-2030 (%)
Data Table on Global Market: Year-over-year growth 2025-2030 (%)

5. Historic Market Size

5.1 Global Media Asset Management (MAM) Solutions Market 2020 - 2024

Historic Market Size - Data Table on Global Media Asset Management (MAM) Solutions Market 2020 - 2024 ($ million)

5.2 Deployment segment analysis 2020 - 2024

Historic Market Size - Deployment Segment 2020 - 2024 ($ million)

5.3 Type segment analysis 2020 - 2024

Historic Market Size - Type Segment 2020 - 2024 ($ million)

5.4 End-user segment analysis 2020 - 2024

Historic Market Size - End-user Segment 2020 - 2024 ($ million)

5.5 Geography segment analysis 2020 - 2024

Historic Market Size - Geography Segment 2020 - 2024 ($ million)

5.6 Country segment analysis 2020 - 2024

Historic Market Size - Country Segment 2020 - 2024 ($ million)

6. Qualitative Analysis

6.1 Impact of AI on global media asset management (MAM) solutions market

6.2 Impact of geopolitical conflicts on global media asset management (MAM) solutions market

7. Five Forces Analysis

7.1 Five forces summary

Five forces analysis - Comparison between 2025 and 2030

7.2 Bargaining power of buyers

Bargaining power of buyers - Impact of key factors 2025 and 2030

7.3 Bargaining power of suppliers

Bargaining power of suppliers - Impact of key factors in 2025 and 2030

7.4 Threat of new entrants

Threat of new entrants - Impact of key factors in 2025 and 2030

7.5 Threat of substitutes

Threat of substitutes - Impact of key factors in 2025 and 2030

7.6 Threat of rivalry

Threat of rivalry - Impact of key factors in 2025 and 2030

7.7 Market condition

Chart on Market condition - Five forces 2025 and 2030

8. Market Segmentation by Deployment

8.1 Market segments

Chart on Deployment - Market share 2025-2030 (%)
Data Table on Deployment - Market share 2025-2030 (%)

8.2 Comparison by Deployment

Chart on Comparison by Deployment
Data Table on Comparison by Deployment

8.3 On-premises - Market size and forecast 2025-2030

Chart on On-premises - Market size and forecast 2025-2030 ($ million)
Data Table on On-premises - Market size and forecast 2025-2030 ($ million)
Chart on On-premises - Year-over-year growth 2025-2030 (%)
Data Table on On-premises - Year-over-year growth 2025-2030 (%)

8.4 Cloud - Market size and forecast 2025-2030

Chart on Cloud - Market size and forecast 2025-2030 ($ million)
Data Table on Cloud - Market size and forecast 2025-2030 ($ million)
Chart on Cloud - Year-over-year growth 2025-2030 (%)
Data Table on Cloud - Year-over-year growth 2025-2030 (%)

8.5 Market opportunity by Deployment

Market opportunity by Deployment ($ million)
Data Table on Market opportunity by Deployment ($ million)

9. Market Segmentation by Type

9.1 Market segments

Chart on Type - Market share 2025-2030 (%)
Data Table on Type - Market share 2025-2030 (%)

9.2 Comparison by Type

Chart on Comparison by Type
Data Table on Comparison by Type

9.3 Small and medium size enterprise - Market size and forecast 2025-2030

Chart on Small and medium size enterprise - Market size and forecast 2025-2030 ($ million)
Data Table on Small and medium size enterprise - Market size and forecast 2025-2030 ($ million)
Chart on Small and medium size enterprise - Year-over-year growth 2025-2030 (%)
Data Table on Small and medium size enterprise - Year-over-year growth 2025-2030 (%)

9.4 Large enterprise - Market size and forecast 2025-2030

Chart on Large enterprise - Market size and forecast 2025-2030 ($ million)
Data Table on Large enterprise - Market size and forecast 2025-2030 ($ million)
Chart on Large enterprise - Year-over-year growth 2025-2030 (%)
Data Table on Large enterprise - Year-over-year growth 2025-2030 (%)

9.5 Market opportunity by Type

Market opportunity by Type ($ million)
Data Table on Market opportunity by Type ($ million)

10. Market Segmentation by End-user

10.1 Market segments

Chart on End-user - Market share 2025-2030 (%)
Data Table on End-user - Market share 2025-2030 (%)

10.2 Comparison by End-user

Chart on Comparison by End-user
Data Table on Comparison by End-user

10.3 Media and entertainment - Market size and forecast 2025-2030

Chart on Media and entertainment - Market size and forecast 2025-2030 ($ million)
Data Table on Media and entertainment - Market size and forecast 2025-2030 ($ million)
Chart on Media and entertainment - Year-over-year growth 2025-2030 (%)
Data Table on Media and entertainment - Year-over-year growth 2025-2030 (%)

10.4 Advertising and marketing - Market size and forecast 2025-2030

Chart on Advertising and marketing - Market size and forecast 2025-2030 ($ million)
Data Table on Advertising and marketing - Market size and forecast 2025-2030 ($ million)
Chart on Advertising and marketing - Year-over-year growth 2025-2030 (%)
Data Table on Advertising and marketing - Year-over-year growth 2025-2030 (%)

10.5 Education and e-learning - Market size and forecast 2025-2030

Chart on Education and e-learning - Market size and forecast 2025-2030 ($ million)
Data Table on Education and e-learning - Market size and forecast 2025-2030 ($ million)
Chart on Education and e-learning - Year-over-year growth 2025-2030 (%)
Data Table on Education and e-learning - Year-over-year growth 2025-2030 (%)

10.6 Others - Market size and forecast 2025-2030

Chart on Others - Market size and forecast 2025-2030 ($ million)
Data Table on Others - Market size and forecast 2025-2030 ($ million)
Chart on Others - Year-over-year growth 2025-2030 (%)
Data Table on Others - Year-over-year growth 2025-2030 (%)

10.7 Market opportunity by End-user

Market opportunity by End-user ($ million)
Data Table on Market opportunity by End-user ($ million)

11. Customer Landscape

11.1 Customer landscape overview

Analysis of price sensitivity, lifecycle, customer purchase basket, adoption rates, and purchase criteria

12. Geographic Landscape

12.1 Geographic segmentation

Chart on Market share by geography 2025-2030 (%)
Data Table on Market share by geography 2025-2030 (%)

12.2 Geographic comparison

Chart on Geographic comparison
Data Table on Geographic comparison

12.3 North America - Market size and forecast 2025-2030

Chart on North America - Market size and forecast 2025-2030 ($ million)
Data Table on North America - Market size and forecast 2025-2030 ($ million)
Chart on North America - Year-over-year growth 2025-2030 (%)
Data Table on North America - Year-over-year growth 2025-2030 (%)
Chart on Regional Comparison - North America
Data Table on Regional Comparison - North America

12.3.1 US - Market size and forecast 2025-2030

Chart on US - Market size and forecast 2025-2030 ($ million)
Data Table on US - Market size and forecast 2025-2030 ($ million)
Chart on US - Year-over-year growth 2025-2030 (%)
Data Table on US - Year-over-year growth 2025-2030 (%)

12.3.2 Canada - Market size and forecast 2025-2030

Chart on Canada - Market size and forecast 2025-2030 ($ million)
Data Table on Canada - Market size and forecast 2025-2030 ($ million)
Chart on Canada - Year-over-year growth 2025-2030 (%)
Data Table on Canada - Year-over-year growth 2025-2030 (%)

12.3.3 Mexico - Market size and forecast 2025-2030

Chart on Mexico - Market size and forecast 2025-2030 ($ million)
Data Table on Mexico - Market size and forecast 2025-2030 ($ million)
Chart on Mexico - Year-over-year growth 2025-2030 (%)
Data Table on Mexico - Year-over-year growth 2025-2030 (%)

12.4 Europe - Market size and forecast 2025-2030

Chart on Europe - Market size and forecast 2025-2030 ($ million)
Data Table on Europe - Market size and forecast 2025-2030 ($ million)
Chart on Europe - Year-over-year growth 2025-2030 (%)
Data Table on Europe - Year-over-year growth 2025-2030 (%)
Chart on Regional Comparison - Europe
Data Table on Regional Comparison - Europe

12.4.1 UK - Market size and forecast 2025-2030

Chart on UK - Market size and forecast 2025-2030 ($ million)
Data Table on UK - Market size and forecast 2025-2030 ($ million)
Chart on UK - Year-over-year growth 2025-2030 (%)
Data Table on UK - Year-over-year growth 2025-2030 (%)

12.4.2 Germany - Market size and forecast 2025-2030

Chart on Germany - Market size and forecast 2025-2030 ($ million)
Data Table on Germany - Market size and forecast 2025-2030 ($ million)
Chart on Germany - Year-over-year growth 2025-2030 (%)
Data Table on Germany - Year-over-year growth 2025-2030 (%)

12.4.3 France - Market size and forecast 2025-2030

Chart on France - Market size and forecast 2025-2030 ($ million)
Data Table on France - Market size and forecast 2025-2030 ($ million)
Chart on France - Year-over-year growth 2025-2030 (%)
Data Table on France - Year-over-year growth 2025-2030 (%)

12.4.4 Italy - Market size and forecast 2025-2030

Chart on Italy - Market size and forecast 2025-2030 ($ million)
Data Table on Italy - Market size and forecast 2025-2030 ($ million)
Chart on Italy - Year-over-year growth 2025-2030 (%)
Data Table on Italy - Year-over-year growth 2025-2030 (%)

12.4.5 Spain - Market size and forecast 2025-2030

Chart on Spain - Market size and forecast 2025-2030 ($ million)
Data Table on Spain - Market size and forecast 2025-2030 ($ million)
Chart on Spain - Year-over-year growth 2025-2030 (%)
Data Table on Spain - Year-over-year growth 2025-2030 (%)

12.4.6 The Netherlands - Market size and forecast 2025-2030

Chart on The Netherlands - Market size and forecast 2025-2030 ($ million)
Data Table on The Netherlands - Market size and forecast 2025-2030 ($ million)
Chart on The Netherlands - Year-over-year growth 2025-2030 (%)
Data Table on The Netherlands - Year-over-year growth 2025-2030 (%)

12.5 APAC - Market size and forecast 2025-2030

Chart on APAC - Market size and forecast 2025-2030 ($ million)
Data Table on APAC - Market size and forecast 2025-2030 ($ million)
Chart on APAC - Year-over-year growth 2025-2030 (%)
Data Table on APAC - Year-over-year growth 2025-2030 (%)
Chart on Regional Comparison - APAC
Data Table on Regional Comparison - APAC

12.5.1 China - Market size and forecast 2025-2030

Chart on China - Market size and forecast 2025-2030 ($ million)
Data Table on China - Market size and forecast 2025-2030 ($ million)
Chart on China - Year-over-year growth 2025-2030 (%)
Data Table on China - Year-over-year growth 2025-2030 (%)

12.5.2 Japan - Market size and forecast 2025-2030

Chart on Japan - Market size and forecast 2025-2030 ($ million)
Data Table on Japan - Market size and forecast 2025-2030 ($ million)
Chart on Japan - Year-over-year growth 2025-2030 (%)
Data Table on Japan - Year-over-year growth 2025-2030 (%)

12.5.3 India - Market size and forecast 2025-2030

Chart on India - Market size and forecast 2025-2030 ($ million)
Data Table on India - Market size and forecast 2025-2030 ($ million)
Chart on India - Year-over-year growth 2025-2030 (%)
Data Table on India - Year-over-year growth 2025-2030 (%)

12.5.4 South Korea - Market size and forecast 2025-2030

Chart on South Korea - Market size and forecast 2025-2030 ($ million)
Data Table on South Korea - Market size and forecast 2025-2030 ($ million)
Chart on South Korea - Year-over-year growth 2025-2030 (%)
Data Table on South Korea - Year-over-year growth 2025-2030 (%)

12.5.5 Australia - Market size and forecast 2025-2030

Chart on Australia - Market size and forecast 2025-2030 ($ million)
Data Table on Australia - Market size and forecast 2025-2030 ($ million)
Chart on Australia - Year-over-year growth 2025-2030 (%)
Data Table on Australia - Year-over-year growth 2025-2030 (%)

12.5.6 Indonesia - Market size and forecast 2025-2030

Chart on Indonesia - Market size and forecast 2025-2030 ($ million)
Data Table on Indonesia - Market size and forecast 2025-2030 ($ million)
Chart on Indonesia - Year-over-year growth 2025-2030 (%)
Data Table on Indonesia - Year-over-year growth 2025-2030 (%)

12.6 South America - Market size and forecast 2025-2030

Chart on South America - Market size and forecast 2025-2030 ($ million)
Data Table on South America - Market size and forecast 2025-2030 ($ million)
Chart on South America - Year-over-year growth 2025-2030 (%)
Data Table on South America - Year-over-year growth 2025-2030 (%)
Chart on Regional Comparison - South America
Data Table on Regional Comparison - South America

12.6.1 Brazil - Market size and forecast 2025-2030

Chart on Brazil - Market size and forecast 2025-2030 ($ million)
Data Table on Brazil - Market size and forecast 2025-2030 ($ million)
Chart on Brazil - Year-over-year growth 2025-2030 (%)
Data Table on Brazil - Year-over-year growth 2025-2030 (%)

12.6.2 Argentina - Market size and forecast 2025-2030

Chart on Argentina - Market size and forecast 2025-2030 ($ million)
Data Table on Argentina - Market size and forecast 2025-2030 ($ million)
Chart on Argentina - Year-over-year growth 2025-2030 (%)
Data Table on Argentina - Year-over-year growth 2025-2030 (%)

12.6.3 Chile - Market size and forecast 2025-2030

Chart on Chile - Market size and forecast 2025-2030 ($ million)
Data Table on Chile - Market size and forecast 2025-2030 ($ million)
Chart on Chile - Year-over-year growth 2025-2030 (%)
Data Table on Chile - Year-over-year growth 2025-2030 (%)

12.7 Middle East and Africa - Market size and forecast 2025-2030

Chart on Middle East and Africa - Market size and forecast 2025-2030 ($ million)
Data Table on Middle East and Africa - Market size and forecast 2025-2030 ($ million)
Chart on Middle East and Africa - Year-over-year growth 2025-2030 (%)
Data Table on Middle East and Africa - Year-over-year growth 2025-2030 (%)
Chart on Regional Comparison - Middle East and Africa
Data Table on Regional Comparison - Middle East and Africa

12.7.1 Saudi Arabia - Market size and forecast 2025-2030

Chart on Saudi Arabia - Market size and forecast 2025-2030 ($ million)
Data Table on Saudi Arabia - Market size and forecast 2025-2030 ($ million)
Chart on Saudi Arabia - Year-over-year growth 2025-2030 (%)
Data Table on Saudi Arabia - Year-over-year growth 2025-2030 (%)

12.7.2 UAE - Market size and forecast 2025-2030

Chart on UAE - Market size and forecast 2025-2030 ($ million)
Data Table on UAE - Market size and forecast 2025-2030 ($ million)
Chart on UAE - Year-over-year growth 2025-2030 (%)
Data Table on UAE - Year-over-year growth 2025-2030 (%)

12.7.3 South Africa - Market size and forecast 2025-2030

Chart on South Africa - Market size and forecast 2025-2030 ($ million)
Data Table on South Africa - Market size and forecast 2025-2030 ($ million)
Chart on South Africa - Year-over-year growth 2025-2030 (%)
Data Table on South Africa - Year-over-year growth 2025-2030 (%)

12.7.4 Israel - Market size and forecast 2025-2030

Chart on Israel - Market size and forecast 2025-2030 ($ million)
Data Table on Israel - Market size and forecast 2025-2030 ($ million)
Chart on Israel - Year-over-year growth 2025-2030 (%)
Data Table on Israel - Year-over-year growth 2025-2030 (%)

12.7.5 Turkey - Market size and forecast 2025-2030

Chart on Turkey - Market size and forecast 2025-2030 ($ million)
Data Table on Turkey - Market size and forecast 2025-2030 ($ million)
Chart on Turkey - Year-over-year growth 2025-2030 (%)
Data Table on Turkey - Year-over-year growth 2025-2030 (%)

12.8 Market opportunity by geography

Market opportunity by geography ($ million)
Data Tables on Market opportunity by geography ($ million)

13. Drivers, Challenges, and Opportunity

13.1 Market drivers

Exponential surge in digital video consumption across global platforms
Rising corporate demands for omnichannel marketing and cross-platform asset monetization
Mandatory shift toward cloud-native architectures to facilitate geographically dispersed workflows

13.2 Market challenges

Data security risks and intellectual property protection in cloud-based environments
High interoperability barriers and legacy system integration inefficiencies
Compounding operational costs of long-term large-scale cloud archiving

13.3 Impact of drivers and challenges

Impact of drivers and challenges in 2025 and 2030

13.4 Market opportunities

Deep integration of multimodal AI and ML for automated metadata enrichment
Extensive adoption of microservices architecture and fully containerized platform deployments
Pervasive implementation of automated localization engines

14. Competitive Landscape

14.1 Overview

14.2

Overview on criticality of inputs and factors of differentiation

14.3 Landscape disruption

Overview on factors of disruption

14.4 Industry risks

Impact of key risks on business

15. Competitive Analysis

15.1 Companies profiled

Companies covered

15.2 Company ranking index

15.3 Market positioning of companies

Matrix on companies position and classification

15.4 Acquia Inc.

Acquia Inc. - Overview
Acquia Inc. - Product / Service
Acquia Inc. - Key offerings
SWOT

15.5 Adobe Inc.

Adobe Inc. - Overview
Adobe Inc. - Business segments
Adobe Inc. - Key offerings
Adobe Inc. - Segment focus
SWOT

15.6 Aprimo

Aprimo - Overview
Aprimo - Product / Service
Aprimo - Key offerings
SWOT

15.7 Avid Technology Inc.

Avid Technology Inc. - Overview
Avid Technology Inc. - Product / Service
Avid Technology Inc. - Key offerings
SWOT

15.8 Bynder B.V.

Bynder B.V. - Overview
Bynder B.V. - Product / Service
Bynder B.V. - Key offerings
SWOT

15.9 Canto Inc.

Canto Inc. - Overview
Canto Inc. - Product / Service
Canto Inc. - Key offerings
SWOT

15.10 CELUM GmbH

CELUM GmbH - Overview
CELUM GmbH - Product / Service
CELUM GmbH - Key offerings
SWOT

15.11 Cloudinary Ltd.

Cloudinary Ltd. - Overview
Cloudinary Ltd. - Product / Service
Cloudinary Ltd. - Key offerings
SWOT

15.12 Evolphin Software Inc.

Evolphin Software Inc. - Overview
Evolphin Software Inc. - Product / Service
Evolphin Software Inc. - Key offerings
SWOT

15.13 Frontify AG

Frontify AG - Overview
Frontify AG - Product / Service
Frontify AG - Key offerings
SWOT

15.14 MediaValet Inc.

MediaValet Inc. - Overview
MediaValet Inc. - Product / Service
MediaValet Inc. - Key offerings
SWOT

15.15 Orange Logic LLC

Orange Logic LLC - Overview
Orange Logic LLC - Product / Service
Orange Logic LLC - Key offerings
SWOT

15.16 Papirfly Group

Papirfly Group - Overview
Papirfly Group - Product / Service
Papirfly Group - Key offerings
SWOT

15.17 PhotoShelter Inc.

PhotoShelter Inc. - Overview
PhotoShelter Inc. - Product / Service
PhotoShelter Inc. - Key offerings
SWOT

15.18 Quantum Corp.

Quantum Corp. - Overview
Quantum Corp. - Product / Service
Quantum Corp. - Key offerings
SWOT

16. Appendix

16.1 Scope of the report

Market definition
Objectives
Notes and caveats

16.2 Inclusions and exclusions checklist

Inclusions checklist
Exclusions checklist

16.3 Currency conversion rates for US$

16.4 Research methodology

16.5 Data procurement

Information sources

16.6 Data validation

16.7 Validation techniques employed for market sizing

16.8 Data synthesis

16.9 360 degree market analysis

16.10 List of abbreviations

Research Methodology

Technavio presents a detailed picture of the market by way of study, synthesis, and summation of data from multiple sources. The analysts have presented the various facets of the market with a particular focus on identifying the key industry influencers. The data thus presented is comprehensive, reliable, and the result of extensive research, both primary and secondary.

INFORMATION SOURCES

Primary sources

  • Manufacturers and suppliers
  • Channel partners
  • Industry experts
  • Strategic decision makers

Secondary sources

  • Industry journals and periodicals
  • Government data
  • Financial reports of key industry players
  • Historical data
  • Press releases

DATA ANALYSIS

Data Synthesis

  • Collation of data
  • Estimation of key figures
  • Analysis of derived insights

Data Validation

  • Triangulation with data models
  • Reference against proprietary databases
  • Corroboration with industry experts

REPORT WRITING

Qualitative

  • Market drivers
  • Market challenges
  • Market trends
  • Five forces analysis

Quantitative

  • Market size and forecast
  • Market segmentation
  • Geographical insights
  • Competitive landscape

Interested in this report?

Get your sample now to see our research methodology and insights!

Download Now

Frequently Asked Questions

Media Asset Management (Mam) Solutions market growth will increase by USD 2640.1 million during 2026-2030.

The Media Asset Management (Mam) Solutions market is expected to grow at a CAGR of 17% during 2026-2030.

Media Asset Management (Mam) Solutions market is segmented by Deployment (On-premises, Cloud) Type (Small and medium size enterprise, Large enterprise) End-user (Media and entertainment, Advertising and marketing, Education and e-learning, Others)

Acquia Inc., Adobe Inc., Aprimo, Avid Technology Inc., Brandfolder Inc., Bynder B.V., Canto Inc., CELUM GmbH, Cloudinary Ltd., Dalet SA, Daminion Software, Evolphin Software Inc., Frontify AG, Iconik Media AB, Imagen Ltd., MediaValet Inc., Orange Logic LLC, Papirfly Group, PhotoShelter Inc., Quantum Corp. are a few of the key vendors in the Media Asset Management (Mam) Solutions market.

Europe will register the highest growth rate of 29.9% among the other regions. Therefore, the Media Asset Management (Mam) Solutions market in Europe is expected to garner significant business opportunities for the vendors during the forecast period.

US, Canada, Mexico, UK, Germany, France, Italy, Spain, The Netherlands, China, Japan, India, South Korea, Australia, Indonesia, Brazil, Argentina, Chile, Saudi Arabia, UAE, South Africa, Israel, Turkey

  • Exponential surge in digital video consumption across global platforms is the driving factor this market.

The Media Asset Management (Mam) Solutions market vendors should focus on grabbing business opportunities from the Deployment segment as it accounted for the largest market share in the base year.
RIA - Research AI Assistant
Ask RIA