Medical Active Air Sampling System Market Analysis North America, Europe, Asia, Rest of World (ROW) - US, Canada, Germany, UK, China - Size and Forecast 2024-2028

Medical Active Air Sampling System Market Analysis North America, Europe, Asia, Rest of World (ROW) - US, Canada, Germany, UK, China - Size and Forecast 2024-2028

Published: Mar 2024 164 Pages SKU: IRTNTR76166

Market Overview at a Glance

$129.26 Mn
Market Opportunity
6.71%
CAGR
6.22
YoY growth 2023-2024(%)

Medical Active Air Sampling System Market Size 2024-2028

The medical active air sampling system market size is forecast to increase by USD 129.26 million, at a CAGR of 6.71% between 2023 and 2028.

  • Active air sampling systems have witnessed significant growth In the medical industry due to the increased requirement for microbiological monitoring to ensure patient safety and maintain a clean environment. The integration of the Internet of Things (IoT) and connectivity In these systems enables real-time monitoring and data analysis, enhancing their efficiency and accuracy. However, the high initial investments associated with active air sampling systems may hinder market growth for some healthcare facilities. Despite this challenge, the benefits of these systems, such as early detection and prevention of airborne infections, make them an essential investment for healthcare providers seeking to maintain optimal indoor air quality and protect patient health.

What will be the Size of the Medical Active Air Sampling System Market During the Forecast Period?

Medical Active Air Sampling System Market Size

 Request Free Sample

  • The market encompasses technologies and solutions designed for the detection and analysis of airborne contaminants in healthcare settings. This market exhibits strong growth due to increasing awareness of indoor air quality and the potential health risks associated with airborne pollutants. Factors driving market expansion include the proliferation of advanced technologies, such as real-time monitoring systems and sensor technologies, which enable early detection and mitigation of contaminants. Additionally, the growing prevalence of healthcare-associated infections and the need for stringent regulatory compliance are key market growth drivers.
  • The market scope includes various applications, such as the detection of bacteria, viruses, and volatile organic compounds (VOCs), including those derived from fuel sources like gasoline, ethanol, methanol, and natural gas. These fuels undergo processes like fermentation, refining, and distillation, producing by-products that can impact indoor air quality. Market trends include the development of multi-parameter monitoring systems and the integration of artificial intelligence and machine learning algorithms for enhanced data analysis and interpretation.

How is this Medical Active Air Sampling System Industry segmented and which is the largest segment?

The medical active air sampling system industry research report provides comprehensive data (region-wise segment analysis), with forecasts and estimates in "USD million" for the period 2024-2028, as well as historical data from 2018-2022 for the following segments.

  • Application
    • Pharmaceuticals and biotechnology
    • Hospitals and clinics
    • Others
  • Type
    • Portable microbial sampling system
    • Desktop microbial sampling system
  • Geography
    • North America
      • Canada
      • US
    • Europe
      • Germany
      • UK
    • Asia
      • China
    • Rest of World (ROW)

By Application Insights

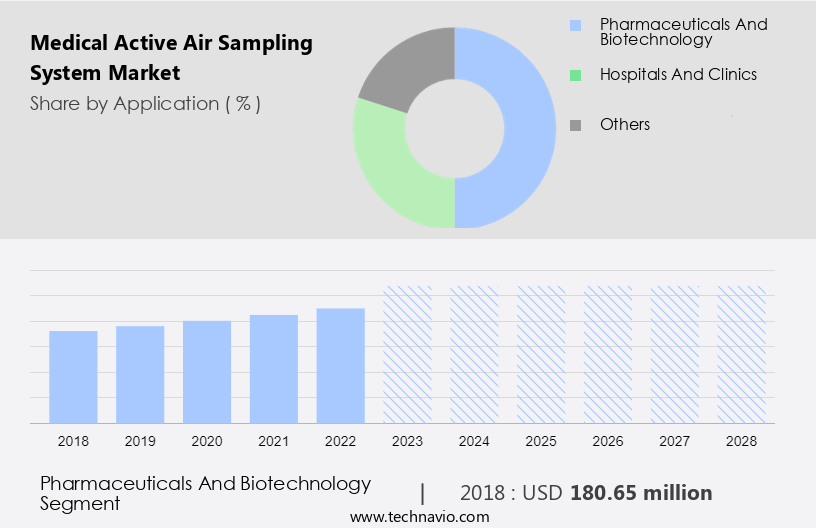
  • The pharmaceuticals and biotechnology segment is estimated to witness significant growth during the forecast period.

In the pharmaceutical and biotechnology sectors, active air sampling systems are essential for maintaining the sterility and quality of production facilities. These systems are crucial in pharmaceutical plants, where the production of medicines and pharmaceutical products directly impacts public health. Biotechnology laboratories, as hubs of innovation, deal with delicate biological materials, cell cultures, and genetic materials that are susceptible to contamination. Active air sampling systems provide real-time data on airborne particles and microorganisms, enabling researchers to maintain experiment sterility and prevent cross-contamination. These systems are particularly important in high-risk locations where contamination can have severe consequences. Active and passive sampling methods, including impaction samplers and settle plates, are used for microbial monitoring.

Calibration, microbial growth identification, and trend analyses are critical components of a monitoring plan. Compliance with regulations, such as those related to environmental monitoring and risk assessment, requires frequent testing and adherence to purity limits. Air sampling techniques, including CFUs (colony-forming units) and quantitative and qualitative results, are essential for ensuring the effectiveness of active air sampling systems.

Medical Active Air Sampling System Market Size

Get a glance at the Medical Active Air Sampling System Industry report of share of various segments Request Free Sample

The pharmaceuticals and biotechnology segment was valued at USD 180.65 million in 2018 and showed a gradual increase during the forecast period.

Regional Analysis

  • North America is estimated to contribute 34% to the growth of the global market during the forecast period.

Technavio's analysts have elaborately explained the regional trends and drivers that shape the market during the forecast period.

Medical Active Air Sampling System Market Share by Geography

For more insights on the market share of various regions, Request Free Sample

The North American market holds a prominent position due to advanced healthcare infrastructure, rigorous infection control regulations, and technological innovation. As a significant player In the global healthcare sector, North America prioritizes patient safety and quality of care, fostering the adoption of advanced air quality management solutions. In the US and Canada, hospitals, clinics, research institutions, and pharmaceutical companies recognize the importance of active air sampling systems in safeguarding patient health and preventing infection spread. Key drivers include the colorless liquid solvents used in medical applications, such as grain alcohol, methanol, and methyl alcohol, which require monitoring for potential contamination.

Air sampling methods, including impaction samplers and settle plates, provide quantitative and qualitative results for microbial growth identification in accordance with 17025 accredited laboratory standards. Regular testing for contaminants like bacteria, yeast, mold, and fungi is essential for risk assessment and trend analyses. The frequency of testing depends on the purity limits and contamination levels set by regulations for high-risk locations. Companies offering air sampling services, such as Trace Analytics and AirCheck Team, provide resources like instructional documents, webinars, and videos to support clients in maintaining environmental monitoring and quality control.

Market Dynamics

Our researchers analyzed the data with 2023 as the base year, along with the key drivers, trends, and challenges. A holistic analysis of drivers will help companies refine their marketing strategies to gain a competitive advantage.

What are the key market drivers leading to the rise In the adoption of Medical Active Air Sampling System Industry?

Increased requirement for microbiological monitoring is the key driver of the market.

  • In the realm of microbiological monitoring, medical active air sampling systems play a pivotal role in ensuring the cleanliness and safety of healthcare facilities. These systems are essential in areas such as operating rooms, laboratories, and patient care units, where airborne microorganisms, including bacteria and viruses, can pose significant risks to patients and healthcare personnel. Microbiological monitoring is a systematic and standardized process that involves collecting and analyzing air samples to assess contamination levels. It is a critical component of quality control (QC) in industries like biotechnology, healthcare, and pharmaceuticals, which are subject to stringent regulations from organizations such as the Health and Safety Executive (HSE) In the UK and the Occupational Safety and Health Administration (OSHA) In the US.
  • Grain alcohol, a flammable, colorless liquid, is often used as a solvent or fuel in various applications, including fermentation processes that convert sugars derived from corn or sugarcane into ethanol. Ethanol, which can be found in fuels like gasoline (E10), octane, flex-fuel vehicles (E85), and cellulosic ethanol, can also serve as a fuel source for microbial growth. Other fuels, such as natural gas, methanol (methyl alcohol), methyl alcohol (wood alcohol), and biodiesel derived from vegetable oil, can also contribute to microbial contamination. To mitigate the risks associated with microbial growth and contamination, it's essential to implement a monitoring plan that includes regular air sampling using tools like impaction samplers and settle plates.
  • This approach allows for both qualitative and quantitative results, enabling the identification of microorganisms like bacteria, yeast, and mold, as well as determining the concentration of contaminants. Calibration, microbial growth identification, and quality control are all essential aspects of microbiological monitoring. A 17025 accredited laboratory can provide the necessary expertise and resources, including instructional documents, webinars, and videos, to help organizations develop and implement effective monitoring plans. Frequency of testing, purity limits, and trend analyses are also crucial factors to consider when implementing a monitoring program.

What are the market trends shaping the Medical Active Air Sampling System Industry?

Integration of IoT and connectivity in active air sampling systems is the upcoming market trend.

  • IoT-integrated active air sampling systems offer healthcare facilities real-time insights into air quality parameters, enhancing infection control efforts. These systems collect and transmit data seamlessly, allowing for prompt responses to potential threats, such as increased pathogen levels or contaminants. Administrators and healthcare personnel receive alerts and updates in real-time, enabling proactive measures to prevent infection spread. The integration of IoT also introduces new connectivity dimensions, enabling remote management and monitoring, freeing personnel from manual data collection tasks, and enabling informed decision-making. Grain alcohol, a flammable, colorless liquid used in fermentation processes, is among the contaminants that active air sampling systems can monitor.
  • Other fuels, such as gasoline, E10, octane, flex-fuel vehicles, E85, E15, cellulosic ethanol, natural gas, methanol, methyl alcohol, and wood alcohol, can also be monitored. Additionally, antifreeze, solvents, windshield wiper fluid, and corrosion byproducts from gasoline refining and crude oil can be detected. Regulations require regular monitoring for microorganisms, including bacteria, yeast, and mold contamination. Monitoring plans include air sampling using impaction samplers and settle plates, with CFUs and quantitative/qualitative results. Calibration, microbial growth identification, and quality control in 17025 accredited laboratories ensure accurate and reliable results. Frequency of testing, trace analytics, and trend analyses are essential components of a comprehensive environmental monitoring and risk assessment strategy.

What challenges does the Medical Active Air Sampling System Industry face during its growth?

High initial investments associated with active air sampling systems is a key challenge affecting the industry growth.

  • Active air sampling systems play a crucial role in ensuring the air quality in healthcare facilities meets stringent infection control standards. However, the initial investment for purchasing and installing these systems can be substantial. The cost includes not only the acquisition of the systems but also installation, personnel training, and ongoing maintenance. The total cost of ownership, which includes calibration and potential upgrades, can strain healthcare budgets, especially in regions with limited funding or financial pressures. Despite the financial commitment, the long-term value of these systems in preventing microbial contamination and ensuring patient safety is significant. Key components of active air sampling systems include impaction samplers, settle plates, and calibration.
  • These tools enable the detection of microorganisms such as bacteria, yeast, and mold, providing both qualitative and quantitative results. Proper implementation of a monitoring plan, including regular testing and trend analyses, is essential for maintaining optimal air quality and complying with regulations. Key considerations include purity limits, frequency of testing, and the use of 17025 accredited laboratories for quality control and environmental monitoring. In high-risk locations, passive sampling methods may also be employed in conjunction with active sampling for comprehensive air quality assessment.

Exclusive Customer Landscape

The medical active air sampling system market forecasting report includes the adoption lifecycle of the market, covering from the innovator's stage to the laggard's stage. It focuses on adoption rates in different regions based on penetration. Furthermore, the medical active air sampling system market report also includes key purchase criteria and drivers of price sensitivity to help companies evaluate and develop their market growth analysis strategies.

Medical Active Air Sampling System Market Share by Geography

 Customer Landscape

Key Companies & Market Insights

Companies are implementing various strategies, such as strategic alliances, medical active air sampling system market forecast, partnerships, mergers and acquisitions, geographical expansion, and product/service launches, to enhance their presence In the industry.

The industry research and growth report includes detailed analyses of the competitive landscape of the market and information about key companies, including:

  • Aquaria Srl
  • Bertin Technologies SAS
  • Cantium Scientific Ltd.
  • Climet Instruments Co.
  • Emtek LLC
  • IUL SA
  • Lighthouse Worldwide Solutions Inc.
  • Merck KGaA
  • Neu tec Group Inc.
  • Orum International Srl
  • SARSTEDT AG and Co. KG
  • Spectris Plc
  • Thermo Fisher Scientific Inc.
  • Tisch Environmental Inc.
  • TSI Inc.
  • Veltek Associates Inc.
  • Acquisition Systems Ltd
  • Avantor Inc
  • bioMerieux SA
  • Sartorius AG

Qualitative and quantitative analysis of companies has been conducted to help clients understand the wider business environment as well as the strengths and weaknesses of key industry players. Data is qualitatively analyzed to categorize companies as pure play, category-focused, industry-focused, and diversified; it is quantitatively analyzed to categorize companies as dominant, leading, strong, tentative, and weak.

Research Analyst Overview

The market encompasses technologies designed to detect and quantify various contaminants present In the air for healthcare applications. These systems play a crucial role in maintaining a clean and safe environment in hospitals, laboratories, and other healthcare facilities. The market dynamics are driven by several factors, including the increasing focus on infection control, stringent regulations, and advancements in technology. The need for effective air quality management in healthcare facilities is a primary driver for the growth of the market. The presence of microorganisms such as bacteria, yeast, and mold In the air can lead to contamination, which can result in adverse health effects for patients and staff.

Further, active air sampling systems employ techniques that actively draw air through a filter or sorbent material to collect contaminants, providing quantitative and qualitative results for a more comprehensive understanding of the air quality. Passive air sampling systems, on the other hand, rely on the natural movement of air to collect contaminants on a sorbent material. While passive sampling systems are less expensive and require minimal maintenance, they may not provide accurate results in high-risk locations or when real-time monitoring is necessary. The market is influenced by various regulations that mandate regular monitoring and reporting of air quality in healthcare facilities.

In addition, these regulations ensure that healthcare providers maintain a clean and safe environment for their patients and staff. Compliance with these regulations can help healthcare facilities avoid costly fines and reputational damage. Advancements in technology have led to the development of more sophisticated air sampling systems that can detect a wider range of contaminants, including volatile organic compounds (VOCs) and particulate matter. These systems can provide real-time monitoring, enabling healthcare facilities to take corrective action promptly and maintain optimal air quality. The market is also influenced by the availability of resources such as instructional documents, webinars, and videos that help healthcare facilities understand the importance of air quality monitoring and the best practices for implementing an effective monitoring plan.

Market Scope

Report Coverage

Details

Page number

164

Base year

2023

Historic period

2018-2022

Forecast period

2024-2028

Growth momentum & CAGR

Accelerate at a CAGR of 6.71%

Market Growth 2024-2028

USD 129.26 million

Market structure

Fragmented

YoY growth 2023-2024(%)

6.22

Key countries

US, Canada, Germany, UK, and China

Competitive landscape

Leading Companies, Market Positioning of Companies, Competitive Strategies, and Industry Risks

Request Free Sample

What are the Key Data Covered in this Medical Active Air Sampling System Market Research and Growth Report?

  • CAGR of the Medical Active Air Sampling System industry during the forecast period
  • Detailed information on factors that will drive the market growth and forecasting between 2024 and 2028
  • Precise estimation of the size of the market and its contribution of the industry in focus to the parent market
  • Accurate predictions about upcoming growth and trends and changes in consumer behaviour
  • Growth of the market across North America, Europe, Asia, and Rest of World (ROW)
  • Thorough analysis of the market's competitive landscape and detailed information about companies
  • Comprehensive analysis of factors that will challenge the medical active air sampling system market growth of industry companies

We can help! Our analysts can customize this medical active air sampling system market research report to meet your requirements.

Get in touch

1 Executive Summary

  • 1.1 Market overview
    • Exhibit 01: Executive Summary – Chart on Market Overview
    • Exhibit 02: Executive Summary – Data Table on Market Overview
    • Exhibit 03: Executive Summary – Chart on Global Market Characteristics
    • Exhibit 04: Executive Summary – Chart on Market by Geography
    • Exhibit 05: Executive Summary – Chart on Market Segmentation by Application
    • Exhibit 06: Executive Summary – Chart on Market Segmentation by Type
    • Exhibit 07: Executive Summary – Chart on Incremental Growth
    • Exhibit 08: Executive Summary – Data Table on Incremental Growth
    • Exhibit 09: Executive Summary – Chart on Vendor Market Positioning

2 Market Landscape

  • 2.1 Market ecosystem
    • Exhibit 10: Parent market
    • Exhibit 11: Market Characteristics

3 Market Sizing

  • 3.1 Market definition
    • Exhibit 12: Offerings of vendors included in the market definition
  • 3.2 Market segment analysis
    • Exhibit 13: Market segments
  • 3.3 Market size 2023
    • 3.4 Market outlook: Forecast for 2023-2028
      • Exhibit 14: Chart on Global - Market size and forecast 2023-2028 ($ million)
      • Exhibit 15: Data Table on Global - Market size and forecast 2023-2028 ($ million)
      • Exhibit 16: Chart on Global Market: Year-over-year growth 2023-2028 (%)
      • Exhibit 17: Data Table on Global Market: Year-over-year growth 2023-2028 (%)

    4 Historic Market Size

    • 4.1 Global medical active air sampling system market 2018 - 2022
      • Exhibit 18: Historic Market Size – Data Table on global medical active air sampling system market 2018 - 2022 ($ million)
    • 4.2 Application Segment Analysis 2018 - 2022
      • Exhibit 19: Historic Market Size – Application Segment 2018 - 2022 ($ million)
    • 4.3 Type Segment Analysis 2018 - 2022
      • Exhibit 20: Historic Market Size – Type Segment 2018 - 2022 ($ million)
    • 4.4 Geography Segment Analysis 2018 - 2022
      • Exhibit 21: Historic Market Size – Geography Segment 2018 - 2022 ($ million)
    • 4.5 Country Segment Analysis 2018 - 2022
      • Exhibit 22: Historic Market Size – Country Segment 2018 - 2022 ($ million)

    5 Five Forces Analysis

    • 5.1 Five forces summary
      • Exhibit 23: Five forces analysis - Comparison between 2023 and 2028
    • 5.2 Bargaining power of buyers
      • Exhibit 24: Chart on Bargaining power of buyers – Impact of key factors 2023 and 2028
    • 5.3 Bargaining power of suppliers
      • Exhibit 25: Bargaining power of suppliers – Impact of key factors in 2023 and 2028
    • 5.4 Threat of new entrants
      • Exhibit 26: Threat of new entrants – Impact of key factors in 2023 and 2028
    • 5.5 Threat of substitutes
      • Exhibit 27: Threat of substitutes – Impact of key factors in 2023 and 2028
    • 5.6 Threat of rivalry
      • Exhibit 28: Threat of rivalry – Impact of key factors in 2023 and 2028
    • 5.7 Market condition
      • Exhibit 29: Chart on Market condition - Five forces 2023 and 2028

    6 Market Segmentation by Application

    • 6.1 Market segments
      • Exhibit 30: Chart on Application - Market share 2023-2028 (%)
      • Exhibit 31: Data Table on Application - Market share 2023-2028 (%)
    • 6.2 Comparison by Application
      • Exhibit 32: Chart on Comparison by Application
      • Exhibit 33: Data Table on Comparison by Application
    • 6.3 Pharmaceuticals and biotechnology - Market size and forecast 2023-2028
      • Exhibit 34: Chart on Pharmaceuticals and biotechnology - Market size and forecast 2023-2028 ($ million)
      • Exhibit 35: Data Table on Pharmaceuticals and biotechnology - Market size and forecast 2023-2028 ($ million)
      • Exhibit 36: Chart on Pharmaceuticals and biotechnology - Year-over-year growth 2023-2028 (%)
      • Exhibit 37: Data Table on Pharmaceuticals and biotechnology - Year-over-year growth 2023-2028 (%)
    • 6.4 Hospitals and clinics - Market size and forecast 2023-2028
      • Exhibit 38: Chart on Hospitals and clinics - Market size and forecast 2023-2028 ($ million)
      • Exhibit 39: Data Table on Hospitals and clinics - Market size and forecast 2023-2028 ($ million)
      • Exhibit 40: Chart on Hospitals and clinics - Year-over-year growth 2023-2028 (%)
      • Exhibit 41: Data Table on Hospitals and clinics - Year-over-year growth 2023-2028 (%)
    • 6.5 Others - Market size and forecast 2023-2028
      • Exhibit 42: Chart on Others - Market size and forecast 2023-2028 ($ million)
      • Exhibit 43: Data Table on Others - Market size and forecast 2023-2028 ($ million)
      • Exhibit 44: Chart on Others - Year-over-year growth 2023-2028 (%)
      • Exhibit 45: Data Table on Others - Year-over-year growth 2023-2028 (%)
    • 6.6 Market opportunity by Application
      • Exhibit 46: Market opportunity by Application ($ million)
      • Exhibit 47: Data Table on Market opportunity by Application ($ million)

    7 Market Segmentation by Type

    • 7.1 Market segments
      • Exhibit 48: Chart on Type - Market share 2023-2028 (%)
      • Exhibit 49: Data Table on Type - Market share 2023-2028 (%)
    • 7.2 Comparison by Type
      • Exhibit 50: Chart on Comparison by Type
      • Exhibit 51: Data Table on Comparison by Type
    • 7.3 Portable microbial sampling system - Market size and forecast 2023-2028
      • Exhibit 52: Chart on Portable microbial sampling system - Market size and forecast 2023-2028 ($ million)
      • Exhibit 53: Data Table on Portable microbial sampling system - Market size and forecast 2023-2028 ($ million)
      • Exhibit 54: Chart on Portable microbial sampling system - Year-over-year growth 2023-2028 (%)
      • Exhibit 55: Data Table on Portable microbial sampling system - Year-over-year growth 2023-2028 (%)
    • 7.4 Desktop microbial sampling system - Market size and forecast 2023-2028
      • Exhibit 56: Chart on Desktop microbial sampling system - Market size and forecast 2023-2028 ($ million)
      • Exhibit 57: Data Table on Desktop microbial sampling system - Market size and forecast 2023-2028 ($ million)
      • Exhibit 58: Chart on Desktop microbial sampling system - Year-over-year growth 2023-2028 (%)
      • Exhibit 59: Data Table on Desktop microbial sampling system - Year-over-year growth 2023-2028 (%)
    • 7.5 Market opportunity by Type
      • Exhibit 60: Market opportunity by Type ($ million)
      • Exhibit 61: Data Table on Market opportunity by Type ($ million)

    8 Customer Landscape

    • 8.1 Customer landscape overview
      • Exhibit 62: Analysis of price sensitivity, lifecycle, customer purchase basket, adoption rates, and purchase criteria

    9 Geographic Landscape

    • 9.1 Geographic segmentation
      • Exhibit 63: Chart on Market share by geography 2023-2028 (%)
      • Exhibit 64: Data Table on Market share by geography 2023-2028 (%)
    • 9.2 Geographic comparison
      • Exhibit 65: Chart on Geographic comparison
      • Exhibit 66: Data Table on Geographic comparison
    • 9.3 North America - Market size and forecast 2023-2028
      • Exhibit 67: Chart on North America - Market size and forecast 2023-2028 ($ million)
      • Exhibit 68: Data Table on North America - Market size and forecast 2023-2028 ($ million)
      • Exhibit 69: Chart on North America - Year-over-year growth 2023-2028 (%)
      • Exhibit 70: Data Table on North America - Year-over-year growth 2023-2028 (%)
    • 9.4 Europe - Market size and forecast 2023-2028
      • Exhibit 71: Chart on Europe - Market size and forecast 2023-2028 ($ million)
      • Exhibit 72: Data Table on Europe - Market size and forecast 2023-2028 ($ million)
      • Exhibit 73: Chart on Europe - Year-over-year growth 2023-2028 (%)
      • Exhibit 74: Data Table on Europe - Year-over-year growth 2023-2028 (%)
    • 9.5 Asia - Market size and forecast 2023-2028
      • Exhibit 75: Chart on Asia - Market size and forecast 2023-2028 ($ million)
      • Exhibit 76: Data Table on Asia - Market size and forecast 2023-2028 ($ million)
      • Exhibit 77: Chart on Asia - Year-over-year growth 2023-2028 (%)
      • Exhibit 78: Data Table on Asia - Year-over-year growth 2023-2028 (%)
    • 9.6 Rest of World (ROW) - Market size and forecast 2023-2028
      • Exhibit 79: Chart on Rest of World (ROW) - Market size and forecast 2023-2028 ($ million)
      • Exhibit 80: Data Table on Rest of World (ROW) - Market size and forecast 2023-2028 ($ million)
      • Exhibit 81: Chart on Rest of World (ROW) - Year-over-year growth 2023-2028 (%)
      • Exhibit 82: Data Table on Rest of World (ROW) - Year-over-year growth 2023-2028 (%)
    • 9.7 US - Market size and forecast 2023-2028
      • Exhibit 83: Chart on US - Market size and forecast 2023-2028 ($ million)
      • Exhibit 84: Data Table on US - Market size and forecast 2023-2028 ($ million)
      • Exhibit 85: Chart on US - Year-over-year growth 2023-2028 (%)
      • Exhibit 86: Data Table on US - Year-over-year growth 2023-2028 (%)
    • 9.8 Germany - Market size and forecast 2023-2028
      • Exhibit 87: Chart on Germany - Market size and forecast 2023-2028 ($ million)
      • Exhibit 88: Data Table on Germany - Market size and forecast 2023-2028 ($ million)
      • Exhibit 89: Chart on Germany - Year-over-year growth 2023-2028 (%)
      • Exhibit 90: Data Table on Germany - Year-over-year growth 2023-2028 (%)
    • 9.9 China - Market size and forecast 2023-2028
      • Exhibit 91: Chart on China - Market size and forecast 2023-2028 ($ million)
      • Exhibit 92: Data Table on China - Market size and forecast 2023-2028 ($ million)
      • Exhibit 93: Chart on China - Year-over-year growth 2023-2028 (%)
      • Exhibit 94: Data Table on China - Year-over-year growth 2023-2028 (%)
    • 9.10 UK - Market size and forecast 2023-2028
      • Exhibit 95: Chart on UK - Market size and forecast 2023-2028 ($ million)
      • Exhibit 96: Data Table on UK - Market size and forecast 2023-2028 ($ million)
      • Exhibit 97: Chart on UK - Year-over-year growth 2023-2028 (%)
      • Exhibit 98: Data Table on UK - Year-over-year growth 2023-2028 (%)
    • 9.11 Canada - Market size and forecast 2023-2028
      • Exhibit 99: Chart on Canada - Market size and forecast 2023-2028 ($ million)
      • Exhibit 100: Data Table on Canada - Market size and forecast 2023-2028 ($ million)
      • Exhibit 101: Chart on Canada - Year-over-year growth 2023-2028 (%)
      • Exhibit 102: Data Table on Canada - Year-over-year growth 2023-2028 (%)
    • 9.12 Market opportunity by geography
      • Exhibit 103: Market opportunity by geography ($ million)
      • Exhibit 104: Data Tables on Market opportunity by geography ($ million)

    10 Drivers, Challenges, and Trends

    • 10.1 Market drivers
      • 10.2 Market challenges
        • 10.3 Impact of drivers and challenges
          • Exhibit 105: Impact of drivers and challenges in 2023 and 2028
        • 10.4 Market trends

          11 Vendor Landscape

          • 11.1 Overview
            • 11.2 Vendor landscape
              • Exhibit 106: Overview on Criticality of inputs and Factors of differentiation
            • 11.3 Landscape disruption
              • Exhibit 107: Overview on factors of disruption
            • 11.4 Industry risks
              • Exhibit 108: Impact of key risks on business

            12 Vendor Analysis

            • 12.1 Vendors covered
              • Exhibit 109: Vendors covered
            • 12.2 Market positioning of vendors
              • Exhibit 110: Matrix on vendor position and classification
            • 12.3 Acquisition Systems Ltd
              • Exhibit 111: Acquisition Systems Ltd - Overview
              • Exhibit 112: Acquisition Systems Ltd - Product / Service
              • Exhibit 113: Acquisition Systems Ltd - Key offerings
            • 12.4 Aquaria Srl
              • Exhibit 114: Aquaria Srl - Overview
              • Exhibit 115: Aquaria Srl - Product / Service
              • Exhibit 116: Aquaria Srl - Key offerings
            • 12.5 Avantor Inc
              • Exhibit 117: Avantor Inc - Overview
              • Exhibit 118: Avantor Inc - Business segments
              • Exhibit 119: Avantor Inc - Key news
              • Exhibit 120: Avantor Inc - Key offerings
              • Exhibit 121: Avantor Inc - Segment focus
            • 12.6 Bertin Technologies SAS
              • Exhibit 122: Bertin Technologies SAS - Overview
              • Exhibit 123: Bertin Technologies SAS - Product / Service
              • Exhibit 124: Bertin Technologies SAS - Key offerings
            • 12.7 bioMerieux SA
              • Exhibit 125: bioMerieux SA - Overview
              • Exhibit 126: bioMerieux SA - Product / Service
              • Exhibit 127: bioMerieux SA - Key news
              • Exhibit 128: bioMerieux SA - Key offerings
            • 12.8 Climet Instruments Co.
              • Exhibit 129: Climet Instruments Co. - Overview
              • Exhibit 130: Climet Instruments Co. - Product / Service
              • Exhibit 131: Climet Instruments Co. - Key offerings
            • 12.9 Lighthouse Worldwide Solutions Inc.
              • Exhibit 132: Lighthouse Worldwide Solutions Inc. - Overview
              • Exhibit 133: Lighthouse Worldwide Solutions Inc. - Product / Service
              • Exhibit 134: Lighthouse Worldwide Solutions Inc. - Key offerings
            • 12.10 Merck KGaA
              • Exhibit 135: Merck KGaA - Overview
              • Exhibit 136: Merck KGaA - Business segments
              • Exhibit 137: Merck KGaA - Key news
              • Exhibit 138: Merck KGaA - Key offerings
              • Exhibit 139: Merck KGaA - Segment focus
            • 12.11 Orum International Srl
              • Exhibit 140: Orum International Srl - Overview
              • Exhibit 141: Orum International Srl - Product / Service
              • Exhibit 142: Orum International Srl - Key offerings
            • 12.12 SARSTEDT AG and Co. KG
              • Exhibit 143: SARSTEDT AG and Co. KG - Overview
              • Exhibit 144: SARSTEDT AG and Co. KG - Product / Service
              • Exhibit 145: SARSTEDT AG and Co. KG - Key offerings
            • 12.13 Sartorius AG
              • Exhibit 146: Sartorius AG - Overview
              • Exhibit 147: Sartorius AG - Business segments
              • Exhibit 148: Sartorius AG - Key news
              • Exhibit 149: Sartorius AG - Key offerings
              • Exhibit 150: Sartorius AG - Segment focus
            • 12.14 Spectris Plc
              • Exhibit 151: Spectris Plc - Overview
              • Exhibit 152: Spectris Plc - Business segments
              • Exhibit 153: Spectris Plc - Key offerings
              • Exhibit 154: Spectris Plc - Segment focus
            • 12.15 Thermo Fisher Scientific Inc.
              • Exhibit 155: Thermo Fisher Scientific Inc. - Overview
              • Exhibit 156: Thermo Fisher Scientific Inc. - Business segments
              • Exhibit 157: Thermo Fisher Scientific Inc. - Key news
              • Exhibit 158: Thermo Fisher Scientific Inc. - Key offerings
              • Exhibit 159: Thermo Fisher Scientific Inc. - Segment focus
            • 12.16 Tisch Environmental Inc.
              • Exhibit 160: Tisch Environmental Inc. - Overview
              • Exhibit 161: Tisch Environmental Inc. - Product / Service
              • Exhibit 162: Tisch Environmental Inc. - Key offerings
            • 12.17 TSI Inc.
              • Exhibit 163: TSI Inc. - Overview
              • Exhibit 164: TSI Inc. - Product / Service
              • Exhibit 165: TSI Inc. - Key offerings

            13 Appendix

            • 13.1 Scope of the report
              • 13.2 Inclusions and exclusions checklist
                • Exhibit 166: Inclusions checklist
                • Exhibit 167: Exclusions checklist
              • 13.3 Currency conversion rates for US$
                • Exhibit 168: Currency conversion rates for US$
              • 13.4 Research methodology
                • Exhibit 169: Research methodology
                • Exhibit 170: Validation techniques employed for market sizing
                • Exhibit 171: Information sources
              • 13.5 List of abbreviations
                • Exhibit 172: List of abbreviations

              Research Methodology

              Technavio presents a detailed picture of the market by way of study, synthesis, and summation of data from multiple sources. The analysts have presented the various facets of the market with a particular focus on identifying the key industry influencers. The data thus presented is comprehensive, reliable, and the result of extensive research, both primary and secondary.

              INFORMATION SOURCES

              Primary sources

              • Manufacturers and suppliers
              • Channel partners
              • Industry experts
              • Strategic decision makers

              Secondary sources

              • Industry journals and periodicals
              • Government data
              • Financial reports of key industry players
              • Historical data
              • Press releases

              DATA ANALYSIS

              Data Synthesis

              • Collation of data
              • Estimation of key figures
              • Analysis of derived insights

              Data Validation

              • Triangulation with data models
              • Reference against proprietary databases
              • Corroboration with industry experts

              REPORT WRITING

              Qualitative

              • Market drivers
              • Market challenges
              • Market trends
              • Five forces analysis

              Quantitative

              • Market size and forecast
              • Market segmentation
              • Geographical insights
              • Competitive landscape

              Interested in this report?

              Get your sample now to see our research methodology and insights!

              Download Now

              Frequently Asked Questions

              Medical Active Air Sampling System market growth will increase by $ 129.26 mn during 2024-2028.

              The Medical Active Air Sampling System market is expected to grow at a CAGR of 6.71% during 2024-2028.

              Medical Active Air Sampling System market is segmented by Application( Pharmaceuticals and biotechnology, Hospitals and clinics, Others) Type( Portable microbial sampling system, Desktop microbial sampling system, Others)

              Aquaria Srl, Bertin Technologies SAS, Cantium Scientific Ltd., Climet Instruments Co., Emtek LLC, IUL SA, Lighthouse Worldwide Solutions Inc., Merck KGaA, Neu tec Group Inc., Orum International Srl, SARSTEDT AG and Co. KG, Spectris Plc, Thermo Fisher Scientific Inc., Tisch Environmental Inc., TSI Inc., Veltek Associates Inc., Acquisition Systems Ltd, Avantor Inc, bioMerieux SA, Sartorius AG are a few of the key vendors in the Medical Active Air Sampling System market.

              North America will register the highest growth rate of 34% among the other regions. Therefore, the Medical Active Air Sampling System market in North America is expected to garner significant business opportunities for the vendors during the forecast period.

              US, Canada, Germany, UK, China

              • Increased requirement for microbiological monitoringMicrobiological monitoring or surveillance in medical active air sampling systems involves monitoring and analyzing the air in healthcare facilities to assess microbial contamination levels. This surveillance is crucial to maintaining a clean and safe environment is the driving factor this market.
              • particularly in areas like operating rooms is the driving factor this market.
              • laboratories is the driving factor this market.
              • and patient care areas where airborne pathogens can pose a risk to patients and healthcare workers. Microbiological monitoring in medical active air sampling systems is typically conducted through a systematic and standardized process. For quality control (QC) is the driving factor this market.
              • air sampling is crucial in the biotechnology is the driving factor this market.
              • healthcare is the driving factor this market.
              • and pharmaceutical industries. Strict guidelines have been developed by several regulatory agencies is the driving factor this market.
              • including the Health and Safety Executive (HSE) in the UK and the Occupational Safety and Health Administration (OSHA) in the US is the driving factor this market.
              • to reduce exposure to bacteria and viruses in the air. Molds is the driving factor this market.
              • airborne germs is the driving factor this market.
              • and yeasts affect how pharmaceutical and medical device operations are carried out is the driving factor this market.
              • which poses a serious risk to the security of both the products and the patients who use them. Microbiological surveillance is crucial in the drug and medical device industries. Additionally is the driving factor this market.
              • it is a legal necessity in industrialized nations such as the US and the UK is the driving factor this market.
              • and there are already published international standards for biocontamination management in cleanrooms and other restricted areas (ISO 14698-1/2). Airborne fungus and bacteria can cause sick-building syndrome. Monitoring airborne microbes is is the driving factor this market.
              • therefore is the driving factor this market.
              • crucial in many industries. Several chemists and medical experts were successful in developing an effective monitoring system that produced a variety of technology solutions for the pharmaceutical sector and hospitals to provide patients with high-quality care. Thus is the driving factor this market.
              • increased requirements for microbiological monitoring are one of the major drivers is the driving factor this market.
              • which is expected to drive the growth of the global medical active air sampling system market during the forecast period. is the driving factor this market.

              The Medical Active Air Sampling System market vendors should focus on grabbing business opportunities from the Pharmaceuticals and biotechnology segment as it accounted for the largest market share in the base year.