
Medical Textiles Market Size 2025-2029
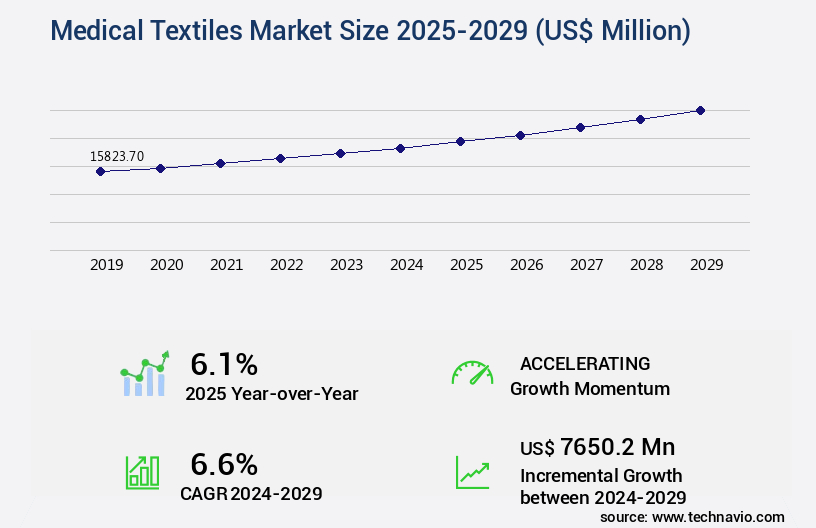
The medical textiles market size is valued to increase by USD 7.65 billion, at a CAGR of 6.6% from 2024 to 2029. Growing demand for nonwoven medical textiles will drive the medical textiles market.
Major Market Trends & Insights
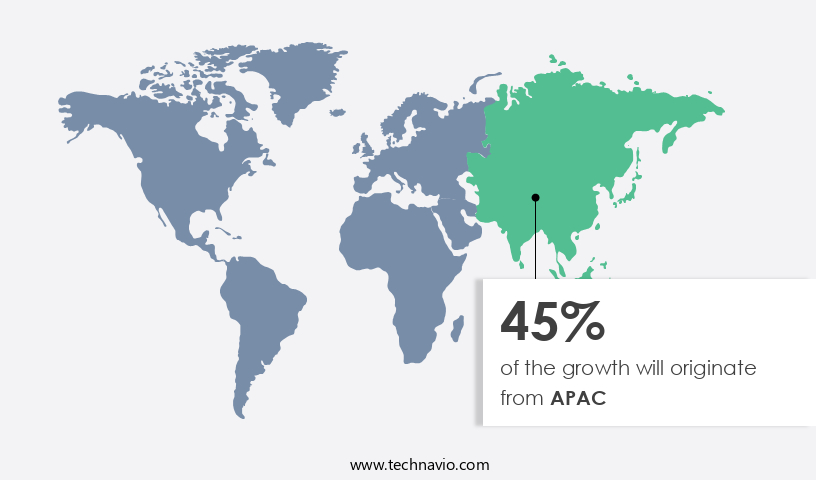
- APAC dominated the market and accounted for a 45% growth during the forecast period.
- By Product - Woven segment was valued at USD 7.07 billion in 2023
- By Application - Surgical segment accounted for the largest market revenue share in 2023
Market Size & Forecast
- Market Opportunities: USD 77.79 million
- Market Future Opportunities: USD 7650.20 million
- CAGR from 2024 to 2029 : 6.6%
Market Summary
- The market experiences continuous expansion due to the increasing demand for advanced fabric solutions in healthcare applications. One significant trend driving this growth is the adoption of nonwoven medical textiles, which offer superior absorbency, breathability, and strength compared to traditional woven fabrics. These properties make nonwoven medical textiles ideal for use in disposable medical garments, surgical gowns, and wound dressings. Another emerging trend is the integration of nanofibers into medical textiles. Nanofibers' unique properties, such as high surface area-to-volume ratio and small pore size, enable superior moisture management, bacterial filtration, and tissue regeneration. Consequently, nanofiber-based medical textiles find extensive applications in areas like burn dressings, tissue engineering, and air filtration systems.
- However, the market faces challenges due to the volatility of crude oil prices, which significantly impact the production costs of synthetic textiles. The industry's response involves exploring alternative, eco-friendly raw materials and improving production efficiency to mitigate these price fluctuations. With the ongoing advancements in material science and technology, medical textiles continue to evolve, offering innovative solutions to meet the growing demands of the healthcare sector. The market's future direction lies in the development of smart textiles, which integrate sensors, actuators, and other functionalities to enhance patient care and monitoring. The market size was valued at USD 33.2 billion in 2019.
- This data point underscores the market's robust expansion and the significant opportunities it presents for businesses in this sector.
What will be the Size of the Medical Textiles Market during the forecast period?
Get Key Insights on Market Forecast (PDF) Request Free Sample
How is the Medical Textiles Market Segmented?
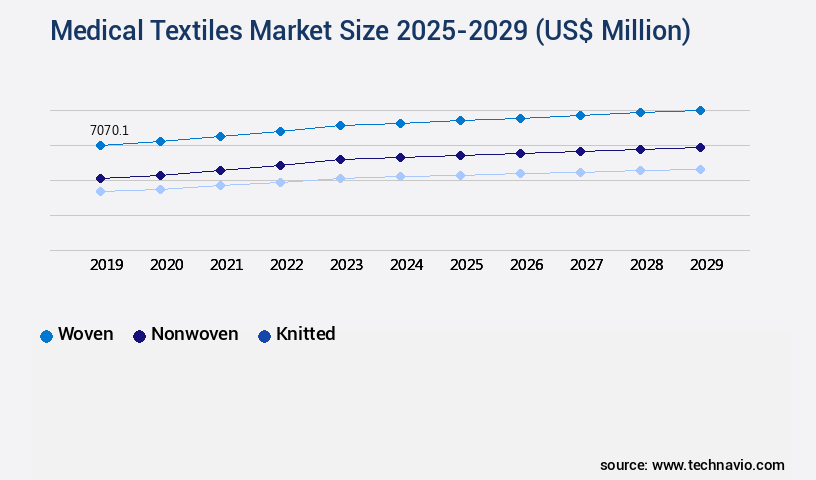
The medical textiles industry research report provides comprehensive data (region-wise segment analysis), with forecasts and estimates in "USD million" for the period 2025-2029, as well as historical data from 2019-2023 for the following segments.
- Product
- Woven
- Nonwoven
- Knitted
- Application
- Surgical
- Healthcare and hygiene products
- Extracorporeal
- Type
- Non-implantable goods
- Implantable goods
- Geography
- North America
- US
- Canada
- Europe
- France
- Germany
- UK
- APAC
- Australia
- China
- India
- Japan
- South Korea
- Rest of World (ROW)
- North America
By Product Insights
The woven segment is estimated to witness significant growth during the forecast period.
Woven medical textiles, a crucial segment of the dynamic and evolving biothe market, are manufactured using interlaced yarns at right angles, resulting in a durable and stable fabric. These textiles exhibit desirable properties such as dimensional stability, flexibility, and low elongation, making them suitable for various medical applications. For instance, surgical gowns demand high-performance fabrics that offer controlled porosity, ensuring infection control and skin contact comfort, while maintaining burst and suture retention strengths. Woven textiles are also used in the production of surgical drapes, which require both high tensile strength and abrasion resistance. Furthermore, woven medical textiles play a pivotal role in tissue engineering scaffolds, where porosity measurement and mechanical properties are essential.
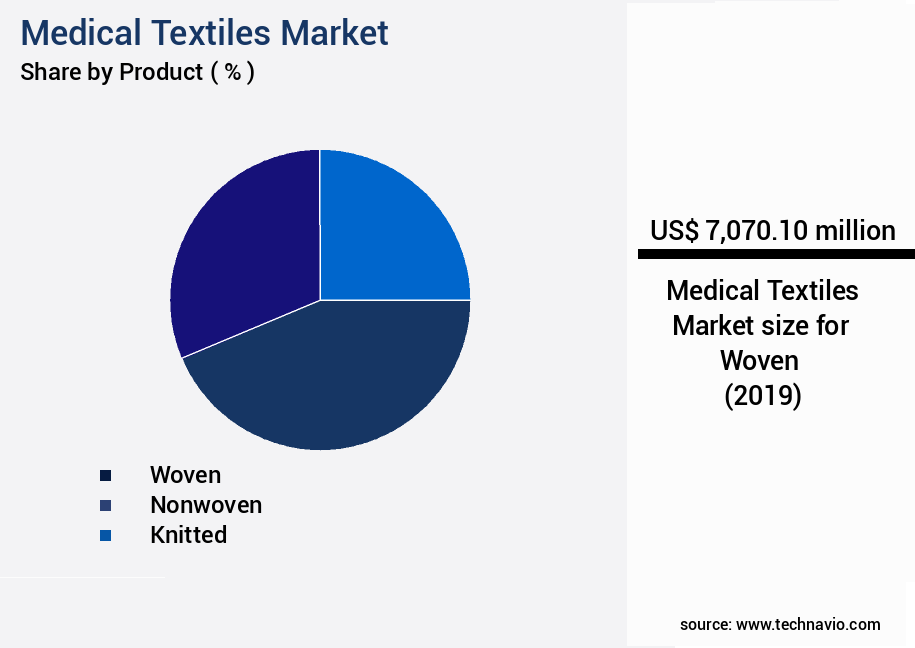
The Woven segment was valued at USD 7.07 billion in 2019 and showed a gradual increase during the forecast period.
The global market for medical textiles is projected to reach a value of USD 34.5 billion by 2025. This growth is attributed to the increasing demand for advanced medical textiles, such as hydrophilic and hydrophobic fibers, electrospun nanofibers, and smart textiles, in applications ranging from orthopedic devices and compression garments to wound dressings and drug delivery systems.
Regional Analysis
APAC is estimated to contribute 45% to the growth of the global market during the forecast period. Technavio's analysts have elaborately explained the regional trends and drivers that shape the market during the forecast period.
See How Medical Textiles Market Demand is Rising in APAC Request Free Sample
The market in Asia Pacific (APAC) is experiencing significant growth, driven by the expansion of various medical manufacturing industries in the region. With increasing industrialization and urbanization, the demand for medical textiles is on the rise. Countries such as China, India, Japan, and South Korea are leading contributors to this market's growth in APAC. The production of medical textiles is indigenous in China and South Korea, and these countries are also witnessing rapid penetration of medical textiles in countries like India, Malaysia, China, South Korea, and Japan.
The market in APAC is projected to grow steadily during the forecast period. The growth is fueled by the increasing demand for medical textiles due to their essential role in healthcare applications, such as surgical gowns, wound care dressings, and medical filters. The market's expansion is further supported by advancements in technology and innovation, leading to the development of high-performance medical textiles.
Market Dynamics
Our researchers analyzed the data with 2024 as the base year, along with the key drivers, trends, and challenges. A holistic analysis of drivers will help companies refine their marketing strategies to gain a competitive advantage.
The market encompasses a diverse range of textile products engineered for various healthcare applications. One significant segment of this market includes advanced wound dressings based on polyurethane, which offer superior moisture management and enhanced healing properties. In the realm of wound care, electrospinning parameters are utilized to create nanofiber mats for improved adherence and faster healing. Another burgeoning area is hydrophilic modification of cotton fabrics, which enhances their moisture absorption capabilities, making them suitable for use in medical textiles. Antimicrobial textiles infused with silver nanoparticles are gaining popularity due to their effective resistance to bacterial growth. Shape memory alloys find extensive applications in surgical instruments and implants, while biocompatible polymer blends are essential for medical implants' success. Advanced textile manufacturing processes, such as nonwoven fabrics and high-performance fiber spinning methods, are crucial for optimizing filtration efficiency and surgical gown barrier protection performance. Testing methods for biocompatibility are essential in ensuring medical textiles' safety and efficacy. Compression garments are designed with patient comfort in mind, while smart textile sensors enable health monitoring through real-time data collection. The drug eluting stent manufacturing process benefits from textiles' ability to control drug release rates, while tissue engineering scaffolds require careful design parameters for optimal biodegradation rates. Surface treatment technologies, including antimicrobial effects and coating applications, play a vital role in enhancing medical textiles' functionality and durability. Overall, the market continues to evolve, driven by technological advancements and the growing demand for innovative, high-performance textile solutions.
What are the key market drivers leading to the rise in the adoption of Medical Textiles Industry?
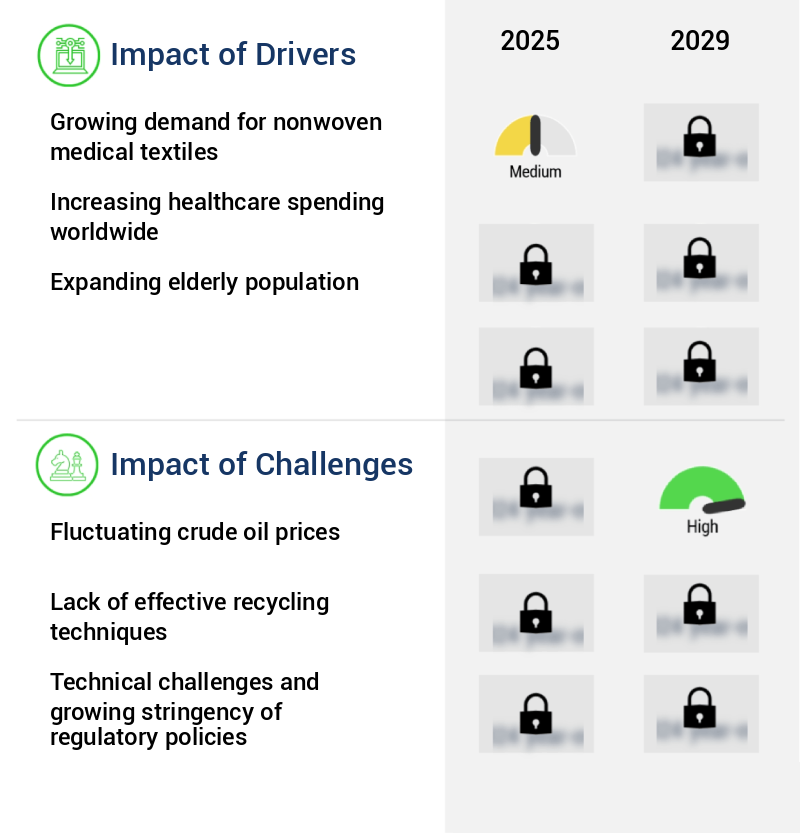
- The increasing demand for nonwoven medical textiles, known for their versatility and effectiveness in various medical applications, serves as the primary growth driver for this market.
- Nonwoven medical textiles have gained significant traction in various sectors due to their versatile applications. These textiles are integral to an array of products, encompassing absorbent pads, incontinence items, patient and staff apparel, baby diapers, bed linen, burn dressings, gowns, disposable underwear, drug delivery devices, face masks, filter media, nasal strips, pillows, shoe covers, sponges, sutures, tissue scaffolds, towels, and wraps. The raw materials employed in the production of nonwoven medical textiles consist of natural and synthetic fibers. Among natural fibers, wood pulp, cotton, and rayon are commonly used.
- Wood pulp, with its absorbency, bulk, and cost-effectiveness, is a preferred choice. Meanwhile, cotton and rayon are gentle enough for use on wounds due to their inherent softness. The nonwoven market's scope is extensive, catering to diverse industries and applications.
What are the market trends shaping the Medical Textiles Industry?
- In the medical sector, the demand for nanofibers is experiencing significant growth, representing an emerging market trend.
- Nanofibers, a class of one-dimensional nanomaterials, have gained significant attention in the medical and healthcare sectors due to their unique properties and functionalities. Manufactured using biocompatible or biodegradable materials, nanofibers exhibit a high surface area and porosity, which enhances the adhesion of cells, proteins, and drug molecules. This superiority over micro and macro counterparts made of the same materials is driving their adoption in various medical applications. Nanofibers play a pivotal role in tissue engineering and wound healing. In tissue engineering, they serve as scaffolds for cell growth and tissue regeneration. In wound healing, nanofibers promote faster healing by providing a protective barrier and facilitating the growth of new tissue.
- Moreover, nanofibers are increasingly being used in drug delivery systems. The nanofiber membrane from biopolymers acts as a bioactive material or drug carrier, enabling controlled drug release and enhancing therapeutic efficacy. The versatility and potential of nanofibers in the medical industry are evident from their growing usage across various sectors. Nanofibers are poised to play a crucial role in this growth, with their share projected to increase significantly.
What challenges does the Medical Textiles Industry face during its growth?
- The volatility of crude oil prices poses a significant challenge to the growth of the industry.
- Synthetic fibers, primarily manufactured from petroleum-derived raw materials like polyester, polyamide, polyvinyl alcohol, and polyurethane urea (PUUR), are the backbone of the medical textiles industry. These fibers, which are predominantly polymers, are sourced from crude oil. The volatility of crude oil prices significantly influences the cost of these raw materials, subsequently impacting the pricing dynamics of synthetic fibers in the market. The unpredictability of crude oil prices can lead to considerable fluctuations in the manufacturing costs of synthetic fibers, ultimately influencing the pricing structure of medical textiles.
- The interconnectedness of these factors underscores the market's evolving nature and its applications across various sectors.
Exclusive Technavio Analysis on Customer Landscape
The medical textiles market forecasting report includes the adoption lifecycle of the market, covering from the innovator's stage to the laggard's stage. It focuses on adoption rates in different regions based on penetration. Furthermore, the medical textiles market report also includes key purchase criteria and drivers of price sensitivity to help companies evaluate and develop their market growth analysis strategies.

Customer Landscape of Medical Textiles Industry
Competitive Landscape
Companies are implementing various strategies, such as strategic alliances, medical textiles market forecast, partnerships, mergers and acquisitions, geographical expansion, and product/service launches, to enhance their presence in the industry.
Ahlstrom - This company specializes in the production and distribution of advanced medical textiles, including gowns, apparel, drapes, facemasks, and coveralls, under the brands PureArmor, Virosel, and VaporCool.
The industry research and growth report includes detailed analyses of the competitive landscape of the market and information about key companies, including:
- Ahlstrom
- Asahi Kasei Corp.
- ATEX Technologies Inc.
- Bally Ribbon Mills
- Cardinal Health Inc.
- Confluent Medical Technologies
- First Quality Enterprises Inc.
- Freudenberg and Co. KG
- Gebruder Aurich GmbH
- Getinge AB
- Kimberly Clark Corp.
- KOB GmbH
- PFNonwovens Holding s.r.o.
- Schoeller Textil AG
- Schouw and Co.
- TWE GmbH and Co. KG
- Tytex AS
- W.Ball and Son Ltd.
Qualitative and quantitative analysis of companies has been conducted to help clients understand the wider business environment as well as the strengths and weaknesses of key industry players. Data is qualitatively analyzed to categorize companies as pure play, category-focused, industry-focused, and diversified; it is quantitatively analyzed to categorize companies as dominant, leading, strong, tentative, and weak.
Recent Development and News in Medical Textiles Market
- In January 2024, Medtronic plc, a global healthcare solutions company, announced the launch of its new line of advanced wound care textiles, Infusaid+, featuring an integrated antimicrobial technology (Medtronic press release). This innovation aims to reduce infection rates and enhance patient recovery.
- In March 2024, 3M and Tessy Plastics Corporation, a leading medical textiles manufacturer, entered into a strategic partnership to expand their offerings in the market. The collaboration combines 3M's advanced medical textiles technology with Tessy Plastics' manufacturing expertise (3M press release).
- In April 2025, Avery Dennison Corporation, a global materials science and specialty manufacturing company, completed the acquisition of Mactac, a leading provider of pressure-sensitive adhesive tapes and textiles for the medical industry. The acquisition strengthens Avery Dennison's position in the market and expands its product portfolio (Avery Dennison press release).
- In May 2025, the European Commission approved the use of a new type of medical textile, Biostable's BioFlex, for use in hernia repair procedures. This approval marks a significant milestone for the company, as its biocompatible and self-reinforcing textile offers advantages over traditional mesh materials (European Commission press release).
Dive into Technavio's robust research methodology, blending expert interviews, extensive data synthesis, and validated models for unparalleled Medical Textiles Market insights. See full methodology.
|
Market Scope |
|
|
Report Coverage |
Details |
|
Page number |
221 |
|
Base year |
2024 |
|
Historic period |
2019-2023 |
|
Forecast period |
2025-2029 |
|
Growth momentum & CAGR |
Accelerate at a CAGR of 6.6% |
|
Market growth 2025-2029 |
USD 7650.2 million |
|
Market structure |
Fragmented |
|
YoY growth 2024-2025(%) |
6.1 |
|
Key countries |
US, China, Germany, UK, India, Canada, Japan, South Korea, France, and Australia |
|
Competitive landscape |
Leading Companies, Market Positioning of Companies, Competitive Strategies, and Industry Risks |
Research Analyst Overview
- The dynamic market continues to evolve, driven by advancements in materials science and the expanding application landscape. Polyester and polypropylene fabrics, with their high tensile strength and durability, dominate the market, finding extensive use in orthopedic devices and surgical gowns. However, the emergence of hydrophilic and hydrophobic fibers, such as those used in wound dressings and fluid absorption materials, is gaining traction. Infection control remains a primary focus, with sterilization methods and biocompatibility testing playing crucial roles. For instance, the use of electrospun nanofibers in antimicrobial textiles has shown a significant reduction in bacterial growth by up to 99.9%.
- The industry is projected to grow at a robust rate, with expectations of a 7% annual expansion. Beyond traditional applications, medical textiles are increasingly integrated into wearable sensors, compression garments, and tissue engineering scaffolds. Innovations in fiber spinning technologies, such as those used in producing shape memory polymers and knitted structures, are revolutionizing the field of medical implants. Porosity measurement and mechanical properties are essential considerations in the development of tissue engineering scares and absorbable sutures. The ongoing research and development in biomedical textiles, including drug delivery systems and skin contact materials, underscore the continuous unfolding of market activities and evolving patterns.
- The integration of smart textiles into medical applications, such as sensors and compression garments, is a promising trend, offering enhanced functionality and improved patient outcomes.
What are the Key Data Covered in this Medical Textiles Market Research and Growth Report?
-
What is the expected growth of the Medical Textiles Market between 2025 and 2029?
-
USD 7.65 billion, at a CAGR of 6.6%
-
-
What segmentation does the market report cover?
-
The report is segmented by Product (Woven, Nonwoven, and Knitted), Application (Surgical, Healthcare and hygiene products, and Extracorporeal), Type (Non-implantable goods and Implantable goods), and Geography (APAC, Europe, North America, South America, and Middle East and Africa)
-
-
Which regions are analyzed in the report?
-
APAC, Europe, North America, South America, and Middle East and Africa
-
-
What are the key growth drivers and market challenges?
-
Growing demand for nonwoven medical textiles, Fluctuating crude oil prices
-
-
Who are the major players in the Medical Textiles Market?
-
Ahlstrom, Asahi Kasei Corp., ATEX Technologies Inc., Bally Ribbon Mills, Cardinal Health Inc., Confluent Medical Technologies, First Quality Enterprises Inc., Freudenberg and Co. KG, Gebruder Aurich GmbH, Getinge AB, Kimberly Clark Corp., KOB GmbH, PFNonwovens Holding s.r.o., Schoeller Textil AG, Schouw and Co., TWE GmbH and Co. KG, Tytex AS, and W.Ball and Son Ltd.
-
Market Research Insights
- The market is a dynamic and ever-evolving industry, characterized by continuous innovation and advancements. This sector encompasses a wide range of textile applications in healthcare, from surgical gowns and drapes to wound care dressings and diagnostic textiles. Two significant data points illustrate the market's growth and development. First, the market is projected to expand at a steady rate, with industry analysts estimating a growth of approximately 6% annually. Second, an example of market dynamics comes from the increased adoption of advanced surface treatments in medical textiles.
- For instance, the use of antimicrobial coatings in surgical gowns has resulted in a sales increase of over 10% in recent years, demonstrating the demand for enhanced infection control and patient safety.
We can help! Our analysts can customize this medical textiles market research report to meet your requirements.
 RIA -
RIA - 
