Mercury Market Analysis APAC, North America, Europe, Middle East and Africa, South America - Mexico, China, Tajikistan, Norway, Peru - Size and Forecast 2024-2028

Mercury Market Analysis APAC, North America, Europe, Middle East and Africa, South America - Mexico, China, Tajikistan, Norway, Peru - Size and Forecast 2024-2028

Published: Jan 2024 152 Pages SKU: IRTNTR77294

Market Overview at a Glance

$695.42 Mn
Market Opportunity
2.94%
CAGR
2.66
YoY growth 2023-2024(%)

Mercury Market Size 2024-2028 

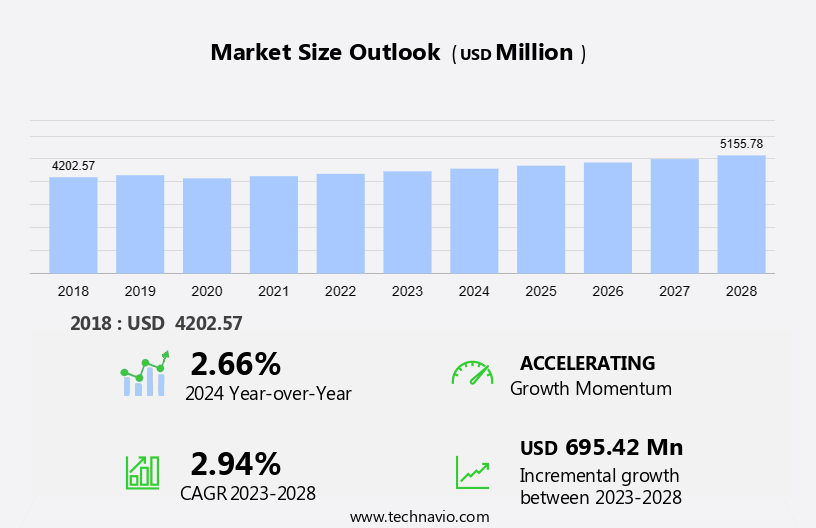
The mercury market size is forecast to increase by USD 695.42 million at a CAGR of 2.94% between 2023 and 2028. The market is witnessing significant growth due to the increasing adoption of mercury in electronics, particularly in button cell batteries. Mercury's unique properties, such as its high electrical conductivity and stability, make it an ideal choice for powering small electronic devices, including those in the semiconductor industry. Additionally, there is a growing emphasis on mercury recycling and recovery to mitigate environmental concerns and reduce the emissions of this toxic heavy metal. Stringent regulations on mercury emission and use in various industries, including healthcare, lighting systems, and pumps, are also driving market growth. In the healthcare sector, mercury continues to be used in medical instruments, such as thermometers and dental amalgams, despite efforts to find alternatives. The recycling and recovery of mercury from waste streams offer opportunities for market expansion while addressing environmental challenges. Overall, the market for mercury is expected to grow steadily due to these factors.

Market Analysis

Mercury Market Size

 Request Free Sample

The market encompasses various industries, primarily focusing on electronics, healthcare, and recycling. Mercury is a precious metal with unique properties, making it indispensable in numerous applications. In electronics, mercury is used in switches, sensors, and lighting systems. In healthcare, mercury is found in medical instruments such as thermometers, dental amalgams, and sphygmomanometers for blood pressure measurement. The economic activity in the construction and chemical industries also contributes to the market. Mercury testing services are essential to ensure health and safety standards, especially in the context of mercury-containing products like batteries, medical devices, and measuring devices.

The mining sector, particularly small-scale gold mining using mercury in the Amalgamated Small-Scale Gold Mining (ASGM) process, is another significant contributor. Despite its widespread use, mercury faces regulatory challenges due to its toxicity and environmental impact. Bans on mercury-containing products and initiatives to promote mercury-free alternatives are shaping the market's future. The supply chain for mercury and mercury-based components, including metals, alloys, and compounds, plays a crucial role in its availability and pricing. Consumer electronics and automotive industries are significant end-users of mercury-based components.

Market Segmentation

The market research report provides comprehensive data (region-wise segment analysis), with forecasts and estimates in "USD million" for the period 2024-2028, as well as historical data from 2018-2022 for the following segments.

  • Application
    • Electrical and electronics
    • Measuring and controlling devices
    • Dental application
    • Gold processing
  • Product
    • Metal
    • Alloys
    • Compounds
  • Geography
    • APAC
      • China
    • North America
      • Mexico
    • Europe
      • Norway
    • Middle East and Africa
    • South America
      • Peru

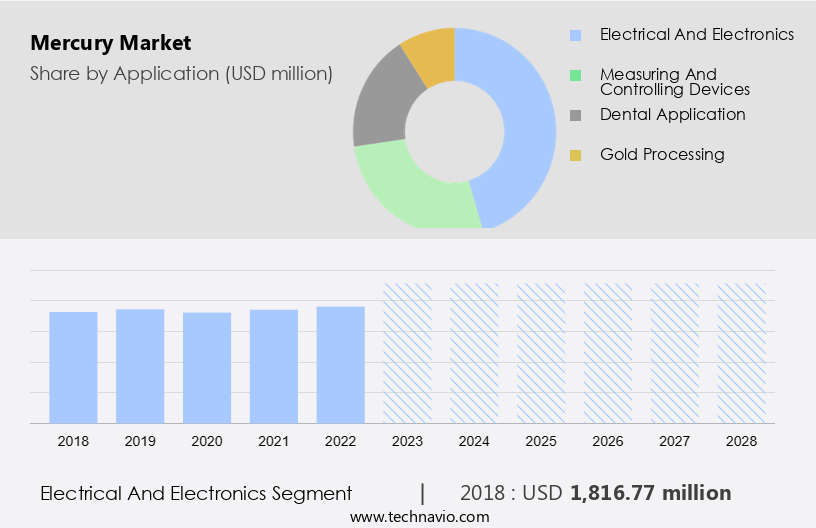
By Application Insights

The electrical and electronics segment is estimated to witness significant growth during the forecast period. The market holds significant importance in various industries, including automotive, chemical, infrastructure, construction, agriculture, and environmental monitoring, due to mercury's unique properties. In the electrical and electronics sector, mercury's high conductivity and stable liquid state at room temperature make it an essential component in numerous devices and electronic components. For instance, mercury is used in fluorescent lamps, where it emits ultraviolet rays (253.7 nm) when an electric current passes through the lamp's electrode and collides with mercury atoms. This reaction generates light through the combination of mercury and fluorescence. For example, a 40 W linear fluorescent lamp manufactured in Japan contains approximately 5-7 mg of mercury.

Mercury's applications extend beyond lighting, as it is also used as a catalyst in various chemical processes, a component in automotive switches, and a crucial element in infrastructure projects, agriculture, and environmental monitoring and remediation.

Mercury Market Size

Get a glance at the market share of various segments Request Free Sample

The electrical and electronics segment accounted for USD 1.82 billion in 2018 and showed a gradual increase during the forecast period.

Regional Insights

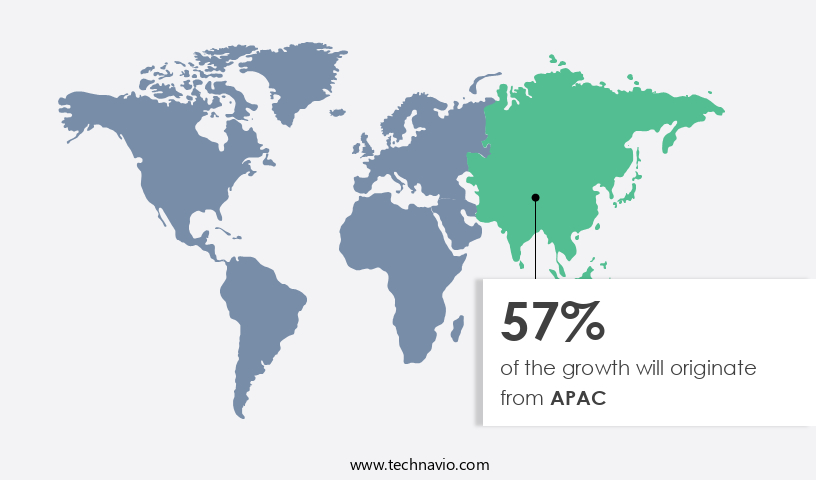
APAC is estimated to contribute 57% to the growth of the global market during the forecast period. Technavio's analysts have elaborately explained the regional trends and drivers that shape the market during the forecast period.

Mercury Market Share by Geography

For more insights on the market share of various regions Request Free Sample

The Asia-Pacific region plays a pivotal role in The market, driven by the region's industrial expansion and economic growth. Countries like China and India, in particular, are major contributors to the market's demand due to their burgeoning industries. Mercury finds extensive applications in various sectors, including electrical and electronics, chemical manufacturing, and mining, mirroring the region's industrial development. In the electronics industry, mercury's demand is on the rise due to the region's dominance in manufacturing electronic devices. Mercury is essential for producing electronic components, such as sensors, compact fluorescent lamps (CFLs), and batteries. Furthermore, mercury is used in the automotive industry for switches and in infrastructure projects, construction, agriculture, environmental monitoring, and remediation.

Market Dynamics

Our researchers analyzed the data with 2023 as the base year, along with the key drivers, trends, and challenges. A holistic analysis of drivers will help companies refine their marketing strategies to gain a competitive advantage.

Market Driver

An increase in adoption of mercury in button cell batteries is the key driver of the market. Mercury plays a significant role in the electronics industry, particularly in the production of batteries, specifically mercury oxide batteries. These batteries, which include button cells and certain types of alkaline batteries, utilize mercury to generate electrical energy storage due to its unique properties, such as high energy density and stable voltage output. Mercury's applications extend to medical devices and aviation equipment, where a reliable and long-lasting power source is essential. In the healthcare sector, mercury-containing button cells have been widely used in hearing aids and watches.

Moreover, mercury is employed in batteries by manufacturers worldwide to prevent internal gas accumulation that could lead to battery bulging and leaking, as stated by the US Environmental Protection Agency on February 21, 2023. Mercury's use extends beyond batteries, with applications in medical instruments, dental amalgams, and lighting systems. The recycling and recovery of mercury from waste streams is a critical aspect of minimizing its environmental impact.

Market Trends

Increasing efforts to recycle and recover emissions of mercury is the upcoming trend in the market. The market is witnessing a significant focus on recycling and recovery initiatives to minimize the environmental impact and decrease the release of mercury into the environment. As mercury is a persistent and toxic substance, there is a growing concern among stakeholders to improve recycling practices and recover mercury from end-of-life products. This includes the development of efficient mercury recycling technologies for items such as batteries, medical instruments like thermometers and dental amalgams, and lighting systems like fluorescent lamps and electronic devices. Recycling not only helps reduce the environmental footprint by preventing improper disposal but also decreases the demand for newly extracted mercury, aligning with sustainability objectives. The market growth is fueled by increasing environmental consciousness, stringent regulations, and corporate responsibility efforts.

Market Challenge

Stringent regulation on emission and use of mercury is a key challenge affecting market growth. Mercury, a significant element in electronics and various industries, including healthcare with medical instruments, thermometers, and dental amalgams, and lighting systems, is subject to increasing regulatory scrutiny due to its harmful effects on the environment and human health. The Minamata Convention, a multilateral environmental agreement signed on 10 October 2013, targets specific human activities contributing to mercury pollution. By 12 December 2023, the US Environmental Protection Agency implemented this agreement, addressing mercury emissions from industries and products. The international community acknowledges the importance of this agreement in reducing mercury pollution from major contributors over the coming decades. This collective effort will contribute significantly to the global reduction of mercury pollution, safeguarding both the environment and public health.

Exclusive Customer Landscape

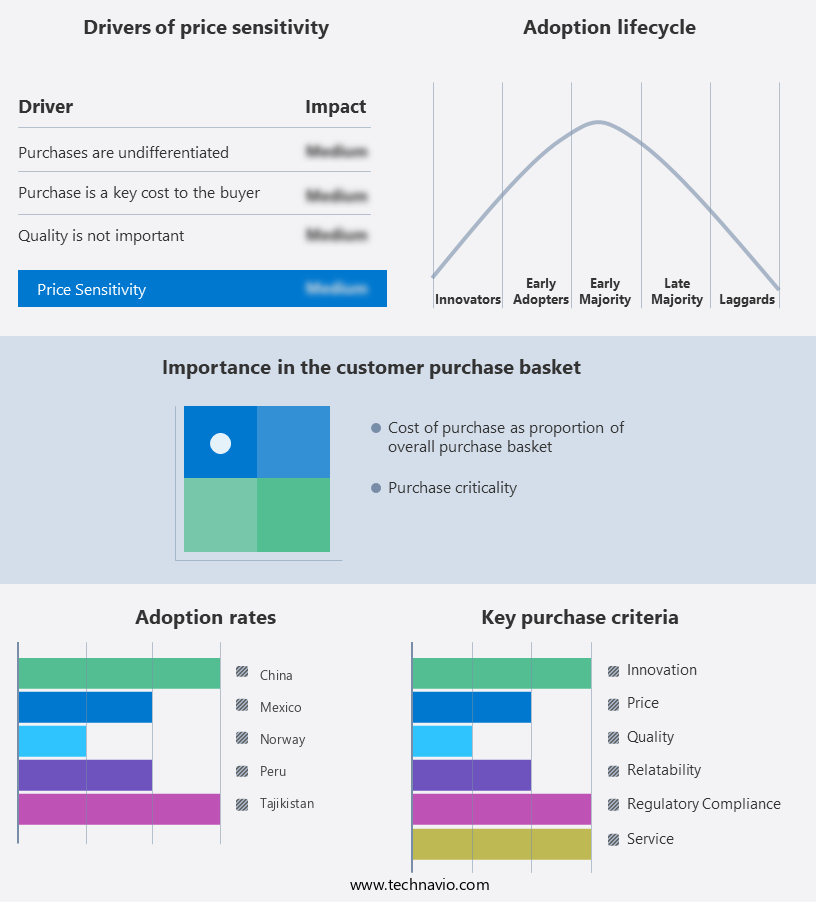
The market forecasting report includes the adoption lifecycle of the market, covering from the innovator's stage to the laggard's stage. It focuses on adoption rates in different regions based on penetration. Furthermore, the report also includes key purchase criteria and drivers of price sensitivity to help companies evaluate and develop their market growth analysis strategies.

Mercury Market Share by Geography

 Customer Landscape

Key Companies & Market Insights

Companies are implementing various strategies, such as strategic alliances, partnerships, mergers and acquisitions, geographical expansion, and product/service launches, to enhance their presence in the market.

Aldrett Hermanos SA de CV - The company offers mercury such as Metallic Mercury, which is used in electrical switches as a liquid contact material, as a working fluid in diffusion pumps in vacuum techniques.

The market research and growth report includes detailed analyses of the competitive landscape of the market and information about key companies, including:

  • Albemarle Corp.
  • Almaden Minerals
  • Avantor Inc.
  • Carbanio
  • China Jin Run Industrial Co. Ltd.
  • Henan Tianfu Chemical Co. Ltd
  • High Purity Standards
  • Lab Alley
  • Labogens Fine Chem Industry
  • Luciteria Science
  • MaTecK GmbH
  • Merck KGaA
  • MERU CHEM PVT. LTD.
  • Nanoshel LLC
  • Noah Chemicals
  • NovaElements
  • Spa Corp.
  • Vivid India
  • Wake Group

Qualitative and quantitative analysis of companies has been conducted to help clients understand the wider business environment as well as the strengths and weaknesses of key market players. Data is qualitatively analyzed to categorize companies as pure play, category-focused, industry-focused, and diversified; it is quantitatively analyzed to categorize companies as dominant, leading, strong, tentative, and weak.

Research Analyst Overview

Mercury, a precious metal known for its unique properties, plays a significant role in various sectors of the electronics industry and beyond. In the realm of healthcare, mercury is used in medical instruments such as thermometers and dental amalgams. The electrical and electronics sector relies on mercury for its high electrical and thermal conductivity in batteries, sensors, and lighting systems. The automotive industry incorporates mercury in automotive switches and catalysts for infrastructure projects and construction equipment. Mercury's role extends to agriculture, where it is used for environmental monitoring and remediation. In the aerospace sector, mercury-based components are essential for electronic devices and measuring devices.

The economic activity surrounding mercury is vast, with mercury testing services, bans on mercury-containing products, and the mining industry producing mercury resources. Mercury emissions stem from mine production, small-scale gold mining, coal combustion, and chemical processes. Mercury's applications span various industries, including healthcare, electronics, automotive, infrastructure, agriculture, and aerospace. Its unique properties, such as electrical and thermal conductivity, make it an indispensable component in numerous applications. However, health and safety concerns and environmental regulations necessitate careful handling and disposal of mercury-based components.

Market Scope

Report Coverage

Details

Page number

152

Base year

2023

Historic period

2018-2022

Forecast period

2024-2028

Growth momentum & CAGR

Accelerate at a CAGR of 2.94%

Market Growth 2024-2028

USD 695.42 million

Market structure

Fragmented

YoY growth 2023-2024(%)

2.66

Regional analysis

APAC, North America, Europe, Middle East and Africa, and South America

Performing market contribution

APAC at 57%

Key countries

Mexico, China, Tajikistan, Norway, and Peru

Competitive landscape

Leading Companies, Market Positioning of Companies, Competitive Strategies, and Industry Risks

Key companies profiled

Aldrett Hermanos SA de CV, Albemarle Corp., Almaden Minerals, Avantor Inc., Carbanio, China Jin Run Industrial Co. Ltd., Henan Tianfu Chemical Co. Ltd, High Purity Standards, Lab Alley, Labogens Fine Chem Industry, Luciteria Science, MaTecK GmbH, Merck KGaA, MERU CHEM PVT. LTD., Nanoshel LLC, Noah Chemicals, NovaElements, Spa Corp., Vivid India, and Wake Group

Market dynamics

Parent market analysis, market growth inducers and obstacles, market forecast, fast-growing and slow-growing segment analysis, COVID-19 impact and recovery analysis and future consumer dynamics, market condition analysis for the forecast period

Customization purview

If our market report has not included the data that you are looking for, you can reach out to our analysts and get segments customized.

Request Free Sample

What are the Key Data Covered in this Market Research and Growth Report?

  • CAGR of the market during the forecast period
  • Detailed information on factors that will drive the market growth and forecasting between 2024 and 2028
  • Precise estimation of the size of the market  and its contribution of the market in focus to the parent market
  • Accurate predictions about upcoming market growth and trends and changes in consumer behaviour
  • Growth of the market across APAC, North America, Europe, Middle East and Africa, and South America
  • Thorough analysis of the market's competitive landscape and detailed information about companies
  • Comprehensive analysis of factors that will challenge the growth of market companies

We can help! Our analysts can customize this market research report to meet your requirements. Get in touch

1 Executive Summary

  • 1.1 Market overview
    • Exhibit 01: Executive Summary – Chart on Market Overview
    • Exhibit 02: Executive Summary – Data Table on Market Overview
    • Exhibit 03: Executive Summary – Chart on Global Market Characteristics
    • Exhibit 04: Executive Summary – Chart on Market by Geography
    • Exhibit 05: Executive Summary – Chart on Market Segmentation by Application
    • Exhibit 06: Executive Summary – Chart on Market Segmentation by Product
    • Exhibit 07: Executive Summary – Chart on Incremental Growth
    • Exhibit 08: Executive Summary – Data Table on Incremental Growth
    • Exhibit 09: Executive Summary – Chart on Vendor Market Positioning

2 Market Landscape

  • 2.1 Market ecosystem
    • Exhibit 10: Parent market
    • Exhibit 11: Market Characteristics

3 Market Sizing

  • 3.1 Market definition
    • Exhibit 12: Offerings of vendors included in the market definition
  • 3.2 Market segment analysis
    • Exhibit 13: Market segments
  • 3.3 Market size 2023
    • 3.4 Market outlook: Forecast for 2023-2028
      • Exhibit 14: Chart on Global - Market size and forecast 2023-2028 ($ million)
      • Exhibit 15: Data Table on Global - Market size and forecast 2023-2028 ($ million)
      • Exhibit 16: Chart on Global Market: Year-over-year growth 2023-2028 (%)
      • Exhibit 17: Data Table on Global Market: Year-over-year growth 2023-2028 (%)

    4 Historic Market Size

    • 4.1 Global mercury market 2018 - 2022
      • Exhibit 18: Historic Market Size – Data Table on global mercury market 2018 - 2022 ($ million)
    • 4.2 Application Segment Analysis 2018 - 2022
      • Exhibit 19: Historic Market Size – Application Segment 2018 - 2022 ($ million)
    • 4.3 Product Segment Analysis 2018 - 2022
      • Exhibit 20: Historic Market Size – Product Segment 2018 - 2022 ($ million)
    • 4.4 Geography Segment Analysis 2018 - 2022
      • Exhibit 21: Historic Market Size – Geography Segment 2018 - 2022 ($ million)
    • 4.5 Country Segment Analysis 2018 - 2022
      • Exhibit 22: Historic Market Size – Country Segment 2018 - 2022 ($ million)

    5 Five Forces Analysis

    • 5.1 Five forces summary
      • Exhibit 23: Five forces analysis - Comparison between 2023 and 2028
    • 5.2 Bargaining power of buyers
      • Exhibit 24: Chart on Bargaining power of buyers – Impact of key factors 2023 and 2028
    • 5.3 Bargaining power of suppliers
      • Exhibit 25: Bargaining power of suppliers – Impact of key factors in 2023 and 2028
    • 5.4 Threat of new entrants
      • Exhibit 26: Threat of new entrants – Impact of key factors in 2023 and 2028
    • 5.5 Threat of substitutes
      • Exhibit 27: Threat of substitutes – Impact of key factors in 2023 and 2028
    • 5.6 Threat of rivalry
      • Exhibit 28: Threat of rivalry – Impact of key factors in 2023 and 2028
    • 5.7 Market condition
      • Exhibit 29: Chart on Market condition - Five forces 2023 and 2028

    6 Market Segmentation by Application

    • 6.1 Market segments
      • Exhibit 30: Chart on Application - Market share 2023-2028 (%)
      • Exhibit 31: Data Table on Application - Market share 2023-2028 (%)
    • 6.2 Comparison by Application
      • Exhibit 32: Chart on Comparison by Application
      • Exhibit 33: Data Table on Comparison by Application
    • 6.3 Electrical and electronics - Market size and forecast 2023-2028
      • Exhibit 34: Chart on Electrical and electronics - Market size and forecast 2023-2028 ($ million)
      • Exhibit 35: Data Table on Electrical and electronics - Market size and forecast 2023-2028 ($ million)
      • Exhibit 36: Chart on Electrical and electronics - Year-over-year growth 2023-2028 (%)
      • Exhibit 37: Data Table on Electrical and electronics - Year-over-year growth 2023-2028 (%)
    • 6.4 Measuring and controlling devices - Market size and forecast 2023-2028
      • Exhibit 38: Chart on Measuring and controlling devices - Market size and forecast 2023-2028 ($ million)
      • Exhibit 39: Data Table on Measuring and controlling devices - Market size and forecast 2023-2028 ($ million)
      • Exhibit 40: Chart on Measuring and controlling devices - Year-over-year growth 2023-2028 (%)
      • Exhibit 41: Data Table on Measuring and controlling devices - Year-over-year growth 2023-2028 (%)
    • 6.5 Dental application - Market size and forecast 2023-2028
      • Exhibit 42: Chart on Dental application - Market size and forecast 2023-2028 ($ million)
      • Exhibit 43: Data Table on Dental application - Market size and forecast 2023-2028 ($ million)
      • Exhibit 44: Chart on Dental application - Year-over-year growth 2023-2028 (%)
      • Exhibit 45: Data Table on Dental application - Year-over-year growth 2023-2028 (%)
    • 6.6 Gold processing - Market size and forecast 2023-2028
      • Exhibit 46: Chart on Gold processing - Market size and forecast 2023-2028 ($ million)
      • Exhibit 47: Data Table on Gold processing - Market size and forecast 2023-2028 ($ million)
      • Exhibit 48: Chart on Gold processing - Year-over-year growth 2023-2028 (%)
      • Exhibit 49: Data Table on Gold processing - Year-over-year growth 2023-2028 (%)
    • 6.7 Market opportunity by Application
      • Exhibit 50: Market opportunity by Application ($ million)
      • Exhibit 51: Data Table on Market opportunity by Application ($ million)

    7 Market Segmentation by Product

    • 7.1 Market segments
      • Exhibit 52: Chart on Product - Market share 2023-2028 (%)
      • Exhibit 53: Data Table on Product - Market share 2023-2028 (%)
    • 7.2 Comparison by Product
      • Exhibit 54: Chart on Comparison by Product
      • Exhibit 55: Data Table on Comparison by Product
    • 7.3 Metal - Market size and forecast 2023-2028
      • Exhibit 56: Chart on Metal - Market size and forecast 2023-2028 ($ million)
      • Exhibit 57: Data Table on Metal - Market size and forecast 2023-2028 ($ million)
      • Exhibit 58: Chart on Metal - Year-over-year growth 2023-2028 (%)
      • Exhibit 59: Data Table on Metal - Year-over-year growth 2023-2028 (%)
    • 7.4 Alloys - Market size and forecast 2023-2028
      • Exhibit 60: Chart on Alloys - Market size and forecast 2023-2028 ($ million)
      • Exhibit 61: Data Table on Alloys - Market size and forecast 2023-2028 ($ million)
      • Exhibit 62: Chart on Alloys - Year-over-year growth 2023-2028 (%)
      • Exhibit 63: Data Table on Alloys - Year-over-year growth 2023-2028 (%)
    • 7.5 Compounds - Market size and forecast 2023-2028
      • Exhibit 64: Chart on Compounds - Market size and forecast 2023-2028 ($ million)
      • Exhibit 65: Data Table on Compounds - Market size and forecast 2023-2028 ($ million)
      • Exhibit 66: Chart on Compounds - Year-over-year growth 2023-2028 (%)
      • Exhibit 67: Data Table on Compounds - Year-over-year growth 2023-2028 (%)
    • 7.6 Market opportunity by Product
      • Exhibit 68: Market opportunity by Product ($ million)
      • Exhibit 69: Data Table on Market opportunity by Product ($ million)

    8 Customer Landscape

    • 8.1 Customer landscape overview
      • Exhibit 70: Analysis of price sensitivity, lifecycle, customer purchase basket, adoption rates, and purchase criteria

    9 Geographic Landscape

    • 9.1 Geographic segmentation
      • Exhibit 71: Chart on Market share by geography 2023-2028 (%)
      • Exhibit 72: Data Table on Market share by geography 2023-2028 (%)
    • 9.2 Geographic comparison
      • Exhibit 73: Chart on Geographic comparison
      • Exhibit 74: Data Table on Geographic comparison
    • 9.3 APAC - Market size and forecast 2023-2028
      • Exhibit 75: Chart on APAC - Market size and forecast 2023-2028 ($ million)
      • Exhibit 76: Data Table on APAC - Market size and forecast 2023-2028 ($ million)
      • Exhibit 77: Chart on APAC - Year-over-year growth 2023-2028 (%)
      • Exhibit 78: Data Table on APAC - Year-over-year growth 2023-2028 (%)
    • 9.4 North America - Market size and forecast 2023-2028
      • Exhibit 79: Chart on North America - Market size and forecast 2023-2028 ($ million)
      • Exhibit 80: Data Table on North America - Market size and forecast 2023-2028 ($ million)
      • Exhibit 81: Chart on North America - Year-over-year growth 2023-2028 (%)
      • Exhibit 82: Data Table on North America - Year-over-year growth 2023-2028 (%)
    • 9.5 Europe - Market size and forecast 2023-2028
      • Exhibit 83: Chart on Europe - Market size and forecast 2023-2028 ($ million)
      • Exhibit 84: Data Table on Europe - Market size and forecast 2023-2028 ($ million)
      • Exhibit 85: Chart on Europe - Year-over-year growth 2023-2028 (%)
      • Exhibit 86: Data Table on Europe - Year-over-year growth 2023-2028 (%)
    • 9.6 Middle East and Africa - Market size and forecast 2023-2028
      • Exhibit 87: Chart on Middle East and Africa - Market size and forecast 2023-2028 ($ million)
      • Exhibit 88: Data Table on Middle East and Africa - Market size and forecast 2023-2028 ($ million)
      • Exhibit 89: Chart on Middle East and Africa - Year-over-year growth 2023-2028 (%)
      • Exhibit 90: Data Table on Middle East and Africa - Year-over-year growth 2023-2028 (%)
    • 9.7 South America - Market size and forecast 2023-2028
      • Exhibit 91: Chart on South America - Market size and forecast 2023-2028 ($ million)
      • Exhibit 92: Data Table on South America - Market size and forecast 2023-2028 ($ million)
      • Exhibit 93: Chart on South America - Year-over-year growth 2023-2028 (%)
      • Exhibit 94: Data Table on South America - Year-over-year growth 2023-2028 (%)
    • 9.8 China - Market size and forecast 2023-2028
      • Exhibit 95: Chart on China - Market size and forecast 2023-2028 ($ million)
      • Exhibit 96: Data Table on China - Market size and forecast 2023-2028 ($ million)
      • Exhibit 97: Chart on China - Year-over-year growth 2023-2028 (%)
      • Exhibit 98: Data Table on China - Year-over-year growth 2023-2028 (%)
    • 9.9 Tajikistan - Market size and forecast 2023-2028
      • Exhibit 99: Chart on Tajikistan - Market size and forecast 2023-2028 ($ million)
      • Exhibit 100: Data Table on Tajikistan - Market size and forecast 2023-2028 ($ million)
      • Exhibit 101: Chart on Tajikistan - Year-over-year growth 2023-2028 (%)
      • Exhibit 102: Data Table on Tajikistan - Year-over-year growth 2023-2028 (%)
    • 9.10 Mexico - Market size and forecast 2023-2028
      • Exhibit 103: Chart on Mexico - Market size and forecast 2023-2028 ($ million)
      • Exhibit 104: Data Table on Mexico - Market size and forecast 2023-2028 ($ million)
      • Exhibit 105: Chart on Mexico - Year-over-year growth 2023-2028 (%)
      • Exhibit 106: Data Table on Mexico - Year-over-year growth 2023-2028 (%)
    • 9.11 Peru - Market size and forecast 2023-2028
      • Exhibit 107: Chart on Peru - Market size and forecast 2023-2028 ($ million)
      • Exhibit 108: Data Table on Peru - Market size and forecast 2023-2028 ($ million)
      • Exhibit 109: Chart on Peru - Year-over-year growth 2023-2028 (%)
      • Exhibit 110: Data Table on Peru - Year-over-year growth 2023-2028 (%)
    • 9.12 Norway - Market size and forecast 2023-2028
      • Exhibit 111: Chart on Norway - Market size and forecast 2023-2028 ($ million)
      • Exhibit 112: Data Table on Norway - Market size and forecast 2023-2028 ($ million)
      • Exhibit 113: Chart on Norway - Year-over-year growth 2023-2028 (%)
      • Exhibit 114: Data Table on Norway - Year-over-year growth 2023-2028 (%)
    • 9.13 Market opportunity by geography
      • Exhibit 115: Market opportunity by geography ($ million)
      • Exhibit 116: Data Tables on Market opportunity by geography ($ million)

    10 Drivers, Challenges, and Trends

    • 10.1 Market drivers
      • 10.2 Market challenges
        • 10.3 Impact of drivers and challenges
          • Exhibit 117: Impact of drivers and challenges in 2023 and 2028
        • 10.4 Market trends

          11 Vendor Landscape

          • 11.1 Overview
            • 11.2 Vendor landscape
              • Exhibit 118: Overview on Criticality of inputs and Factors of differentiation
            • 11.3 Landscape disruption
              • Exhibit 119: Overview on factors of disruption
            • 11.4 Industry risks
              • Exhibit 120: Impact of key risks on business

            12 Vendor Analysis

            • 12.1 Vendors covered
              • Exhibit 121: Vendors covered
            • 12.2 Market positioning of vendors
              • Exhibit 122: Matrix on vendor position and classification
            • 12.3 Aldrett Hermanos SA de CV
              • Exhibit 123: Aldrett Hermanos SA de CV - Overview
              • Exhibit 124: Aldrett Hermanos SA de CV - Product / Service
              • Exhibit 125: Aldrett Hermanos SA de CV - Key offerings
            • 12.4 Albemarle Corp.
              • Exhibit 126: Albemarle Corp. - Overview
              • Exhibit 127: Albemarle Corp. - Business segments
              • Exhibit 128: Albemarle Corp. - Key news
              • Exhibit 129: Albemarle Corp. - Key offerings
              • Exhibit 130: Albemarle Corp. - Segment focus
            • 12.5 Almaden Minerals
              • Exhibit 131: Almaden Minerals - Overview
              • Exhibit 132: Almaden Minerals - Product / Service
              • Exhibit 133: Almaden Minerals - Key offerings
            • 12.6 Avantor Inc.
              • Exhibit 134: Avantor Inc. - Overview
              • Exhibit 135: Avantor Inc. - Business segments
              • Exhibit 136: Avantor Inc. - Key offerings
              • Exhibit 137: Avantor Inc. - Segment focus
            • 12.7 Carbanio
              • Exhibit 138: Carbanio - Overview
              • Exhibit 139: Carbanio - Product / Service
              • Exhibit 140: Carbanio - Key offerings
            • 12.8 High Purity Standards
              • Exhibit 141: High Purity Standards - Overview
              • Exhibit 142: High Purity Standards - Product / Service
              • Exhibit 143: High Purity Standards - Key offerings
            • 12.9 Lab Alley
              • Exhibit 144: Lab Alley - Overview
              • Exhibit 145: Lab Alley - Product / Service
              • Exhibit 146: Lab Alley - Key offerings
            • 12.10 Labogens Fine Chem Industry
              • Exhibit 147: Labogens Fine Chem Industry - Overview
              • Exhibit 148: Labogens Fine Chem Industry - Product / Service
              • Exhibit 149: Labogens Fine Chem Industry - Key offerings
            • 12.11 MaTecK GmbH
              • Exhibit 150: MaTecK GmbH - Overview
              • Exhibit 151: MaTecK GmbH - Product / Service
              • Exhibit 152: MaTecK GmbH - Key offerings
            • 12.12 Merck KGaA
              • Exhibit 153: Merck KGaA - Overview
              • Exhibit 154: Merck KGaA - Product / Service
              • Exhibit 155: Merck KGaA - Key offerings
            • 12.13 Nanoshel LLC
              • Exhibit 156: Nanoshel LLC - Overview
              • Exhibit 157: Nanoshel LLC - Product / Service
              • Exhibit 158: Nanoshel LLC - Key offerings
            • 12.14 Noah Chemicals
              • Exhibit 159: Noah Chemicals - Overview
              • Exhibit 160: Noah Chemicals - Product / Service
              • Exhibit 161: Noah Chemicals - Key offerings
            • 12.15 Spa Corp.
              • Exhibit 162: Spa Corp. - Overview
              • Exhibit 163: Spa Corp. - Product / Service
              • Exhibit 164: Spa Corp. - Key offerings
            • 12.16 Vivid India
              • Exhibit 165: Vivid India - Overview
              • Exhibit 166: Vivid India - Product / Service
              • Exhibit 167: Vivid India - Key offerings
            • 12.17 Wake Group
              • Exhibit 168: Wake Group - Overview
              • Exhibit 169: Wake Group - Product / Service
              • Exhibit 170: Wake Group - Key offerings

            13 Appendix

            • 13.1 Scope of the report
              • 13.2 Inclusions and exclusions checklist
                • Exhibit 171: Inclusions checklist
                • Exhibit 172: Exclusions checklist
              • 13.3 Currency conversion rates for US$
                • Exhibit 173: Currency conversion rates for US$
              • 13.4 Research methodology
                • Exhibit 174: Research methodology
                • Exhibit 175: Validation techniques employed for market sizing
                • Exhibit 176: Information sources
              • 13.5 List of abbreviations
                • Exhibit 177: List of abbreviations

              Research Methodology

              Technavio presents a detailed picture of the market by way of study, synthesis, and summation of data from multiple sources. The analysts have presented the various facets of the market with a particular focus on identifying the key industry influencers. The data thus presented is comprehensive, reliable, and the result of extensive research, both primary and secondary.

              INFORMATION SOURCES

              Primary sources

              • Manufacturers and suppliers
              • Channel partners
              • Industry experts
              • Strategic decision makers

              Secondary sources

              • Industry journals and periodicals
              • Government data
              • Financial reports of key industry players
              • Historical data
              • Press releases

              DATA ANALYSIS

              Data Synthesis

              • Collation of data
              • Estimation of key figures
              • Analysis of derived insights

              Data Validation

              • Triangulation with data models
              • Reference against proprietary databases
              • Corroboration with industry experts

              REPORT WRITING

              Qualitative

              • Market drivers
              • Market challenges
              • Market trends
              • Five forces analysis

              Quantitative

              • Market size and forecast
              • Market segmentation
              • Geographical insights
              • Competitive landscape

              Interested in this report?

              Get your sample now to see our research methodology and insights!

              Download Now

              Frequently Asked Questions

              Mercury market growth will increase by $ 695.42 mn during 2024-2028.

              The Mercury market is expected to grow at a CAGR of 2.94% during 2024-2028.

              Mercury market is segmented by Application( Electrical and electronics, Measuring and controlling devices, Dental application, Gold processing) Product( Metal, Alloys, Compounds)

              Aldrett Hermanos SA de CV, Albemarle Corp., Almaden Minerals, Avantor Inc., Carbanio, China Jin Run Industrial Co. Ltd., Henan Tianfu Chemical Co. Ltd, High Purity Standards, Lab Alley, Labogens Fine Chem Industry, Luciteria Science, MaTecK GmbH, Merck KGaA, MERU CHEM PVT. LTD., Nanoshel LLC, Noah Chemicals, NovaElements, Spa Corp., Vivid India, Wake Group are a few of the key vendors in the Mercury market.

              APAC will register the highest growth rate of 57% among the other regions. Therefore, the Mercury market in APAC is expected to garner significant business opportunities for the vendors during the forecast period.

              Mexico, China, Tajikistan, Norway, Peru

              • Increase in adoption of mercury in button cell batteriesThe use of mercury in batteries serves as a driver in the global mercury market is the driving factor this market.
              • particularly in the production of button cells and certain types of alkaline batteries. Mercury oxide batteries is the driving factor this market.
              • commonly known as mercuric oxide batteries is the driving factor this market.
              • have historically utilized mercury to generate electrical energy. These batteries have unique characteristics is the driving factor this market.
              • such as high energy density and stable voltage output is the driving factor this market.
              • making them suitable for certain applications is the driving factor this market.
              • such as medical devices and aviation equipment. Mercury-containing button cells have been commonly employed in applications where a stable and long-lasting power source is crucial is the driving factor this market.
              • such as in hearing aids and watches. For instance is the driving factor this market.
              • on 21 February 2023 is the driving factor this market.
              • according to the US Environmental Protection Agency is the driving factor this market.
              • mercury is used in batteries by producers all over the world to stop internal gas accumulation that could lead to a bulging and leaking battery. Coin- or button-shaped tiny batteries are called button cell batteries. These are found in toys is the driving factor this market.
              • digital thermometers is the driving factor this market.
              • watches is the driving factor this market.
              • cameras is the driving factor this market.
              • calculators is the driving factor this market.
              • and other small is the driving factor this market.
              • portable electronics. Mercury is present in trace amounts in button cell batteries made of silver oxide is the driving factor this market.
              • alkaline is the driving factor this market.
              • and zinc air. Because there is little possibility of mercury leaking out is the driving factor this market.
              • these batteries do not present a health risk when in use. After button cell batteries are thrown away and either burned or wind up in a landfill is the driving factor this market.
              • the mercury in them may leak into the environment. Even though it is not against federal law to dispose of button cell batteries with regular trash is the driving factor this market.
              • button cell batteries ought to be recycled. The surge in button cell mercury battery adoption is the driving factor this market.
              • fueled by their compact design and prolonged use in small electronic devices is the driving factor this market.
              • acts as a key driver for the global mercury market. Growing demand for these batteries propels market expansion is the driving factor this market.
              • meeting the rising need for reliable power sources in various applications worldwide. Therefore is the driving factor this market.
              • an increase in the use of mercury in button cell batteries will drive the growth of the global mercury market during the forecast period.global mercury market during the forecast period. is the driving factor this market.

              The Mercury market vendors should focus on grabbing business opportunities from the Electrical and electronics segment as it accounted for the largest market share in the base year.