Metal Additive Manufacturing Market Analysis, Size, and Forecast 2026-2030: North America (US, Canada, and Mexico), Europe (Germany, France, and UK), APAC (China, Japan, and South Korea), South America (Brazil, Argentina, and Colombia), Middle East and Africa (UAE, South Africa, and Saudi Arabia), and Rest of World (ROW)

Metal Additive Manufacturing Market Analysis, Size, and Forecast 2026-2030:
North America (US, Canada, and Mexico), Europe (Germany, France, and UK), APAC (China, Japan, and South Korea), South America (Brazil, Argentina, and Colombia), Middle East and Africa (UAE, South Africa, and Saudi Arabia), and Rest of World (ROW)

Published: Mar 2026 306 Pages SKU: IRTNTR41666

Market Overview at a Glance

$7.03 B
Market Opportunity
14.4%
CAGR 2025 - 2030
43.7%
North America Growth
$4.18 B
Selective laser melting segment 2024

Metal Additive Manufacturing Market Size 2026-2030

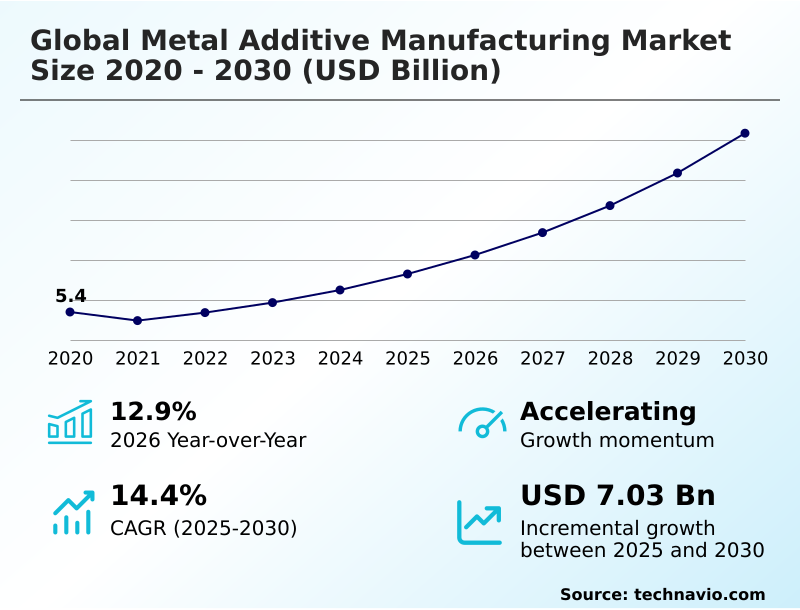
The metal additive manufacturing market size is valued to increase by USD 7.03 billion, at a CAGR of 14.4% from 2025 to 2030. Industrialization of production-scale metal additive manufacturing in aerospace and defense will drive the metal additive manufacturing market.

Major Market Trends & Insights

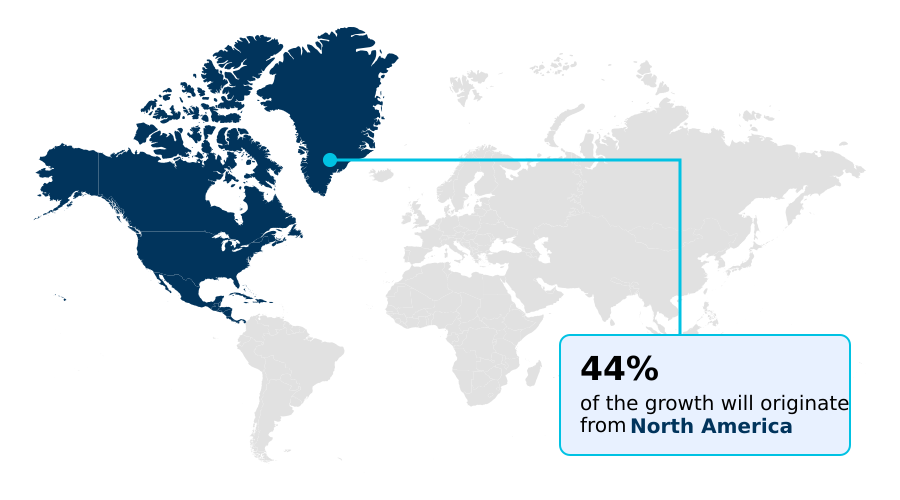
  • North America dominated the market and accounted for a 43.7% growth during the forecast period.
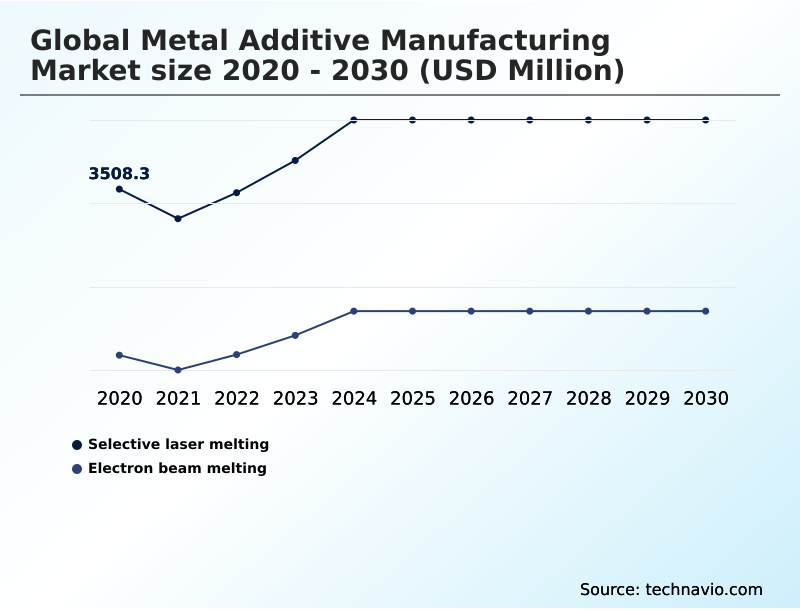
  • By Type - Selective laser melting segment was valued at USD 4.18 billion in 2024
  • By Application - Aerospace segment accounted for the largest market revenue share in 2024

Market Size & Forecast

  • Market Opportunities: USD 8.94 billion
  • Market Future Opportunities: USD 7.03 billion
  • CAGR from 2025 to 2030 : 14.4%

Market Summary

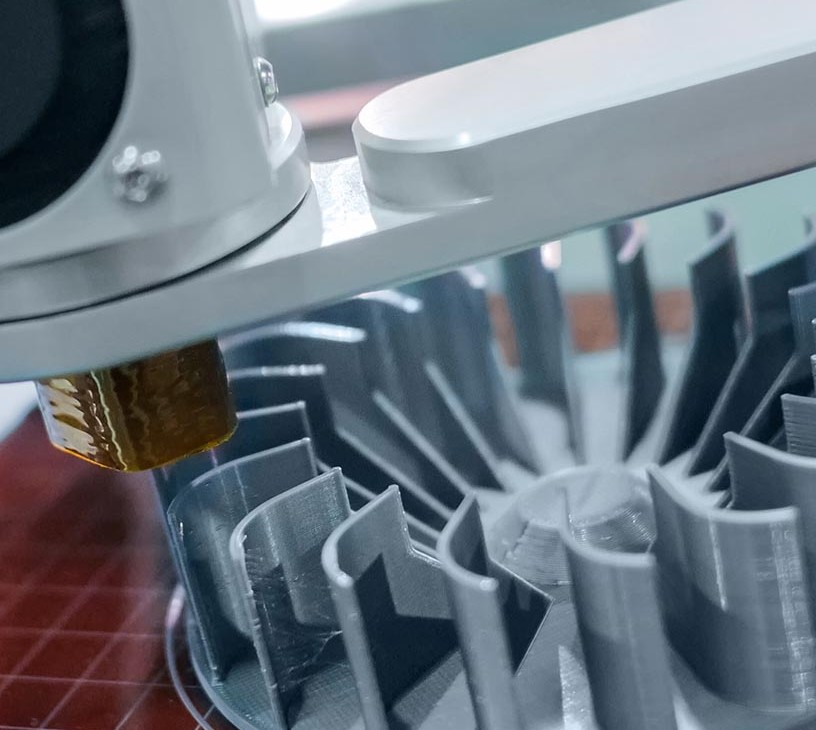
  • The metal additive manufacturing market is shifting from prototyping to industrialized production, driven by demand for high-performance components. This evolution is defined by advancements in core technologies like powder bed fusion and directed energy deposition, which enable the creation of parts with complex internal geometries previously unachievable.
  • Key sectors such as aerospace and healthcare are leveraging these capabilities for lightweighting structural parts and producing 3d printed orthopedic devices. For instance, in a medical supply chain scenario, point-of-care manufacturing allows hospitals to produce patient-specific implants on-demand, drastically reducing lead times and inventory costs associated with traditional implant distribution.
  • The integration of digital twin simulation and in-situ process monitoring addresses challenges related to part qualification standards and repeatability. As the industry matures, the focus on sustainable manufacturing practices, including metal powder feedstock recycling, and cost per part reduction will continue to shape its trajectory, making it a viable alternative to conventional methods like metal injection molding.

What will be the Size of the Metal Additive Manufacturing Market during the forecast period?

Get Key Insights on Market Forecast (PDF) Request Free Sample

How is the Metal Additive Manufacturing Market Segmented?

The metal additive manufacturing industry research report provides comprehensive data (region-wise segment analysis), with forecasts and estimates in "USD million" for the period 2026-2030, as well as historical data from 2020-2024 for the following segments.

  • Type
    • Selective laser melting
    • Electron beam melting
  • Application
    • Aerospace
    • Healthcare
    • Tools and mold
    • Automobile
    • Others
  • Material
    • Stainless steel
    • Titanium and alloys
    • Nickel alloys
    • Aluminum alloys
    • Others
  • Geography
    • North America
      • US
      • Canada
      • Mexico
    • Europe
      • Germany
      • France
      • UK
    • APAC
      • China
      • Japan
      • South Korea
    • South America
      • Brazil
      • Argentina
      • Colombia
    • Middle East and Africa
      • UAE
      • South Africa
      • Saudi Arabia
    • Rest of World (ROW)

By Type Insights

The selective laser melting segment is estimated to witness significant growth during the forecast period.

The selective laser melting segment leads due to its precision and material versatility. This technology uses a high-power laser for fusing metallic powders, enabling complex part production with high density.

Key sectors leverage it for fabricating intricate geometries and lattice structure designs for weight optimization. The move from rapid prototyping to production is enabled by multi-laser systems, which improve build rates and economic viability.

Integrated real-time monitoring enhances process reliability, with some systems achieving build speeds up to 900% faster than standard methods. This powder bed fusion technique is crucial for industrial production scaling.

The focus on cost per part reduction and high-throughput metal printing is expanding its adoption for aerospace-grade components and patient-specific implants.

Request Free Sample

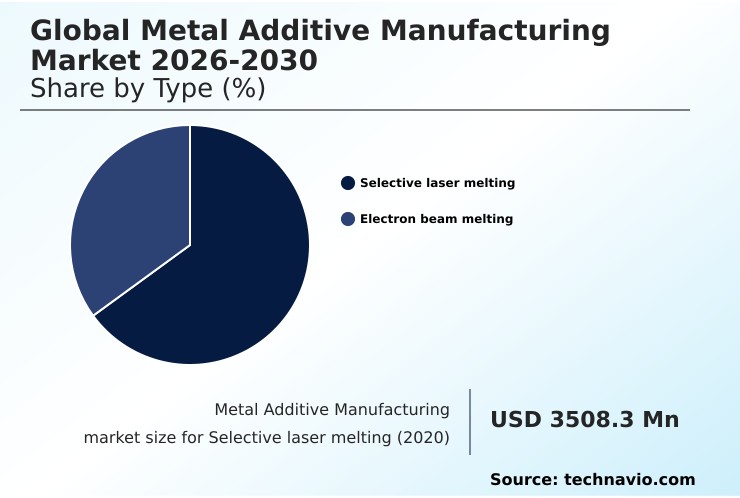
The Selective laser melting segment was valued at USD 4.18 billion in 2024 and showed a gradual increase during the forecast period.

Request Free Sample

Regional Analysis

North America is estimated to contribute 43.7% to the growth of the global market during the forecast period.Technavio’s analysts have elaborately explained the regional trends and drivers that shape the market during the forecast period.

See How Metal Additive Manufacturing Market Demand is Rising in North America Request Free Sample

The geographic landscape is led by North America, which accounts for over 43% of the market's incremental growth, driven by its advanced aerospace and medical sectors.

In this region, the focus is on industrial production scaling and leveraging technologies like electron beam melting for aerospace-grade components. Europe remains a key innovation hub, with a strong emphasis on part qualification standards and developing hybrid manufacturing systems.

Meanwhile, APAC is the fastest-growing region, with a projected CAGR of 14.9%, fueled by automotive and electronics manufacturing. The region is rapidly adopting binder jetting technology and developing its own metal powder feedstock supply chains to support high-volume production.

This global distribution underscores the technology's adaptability, from on-demand spare part fabrication in mature markets to green additive manufacturing initiatives in emerging economies.
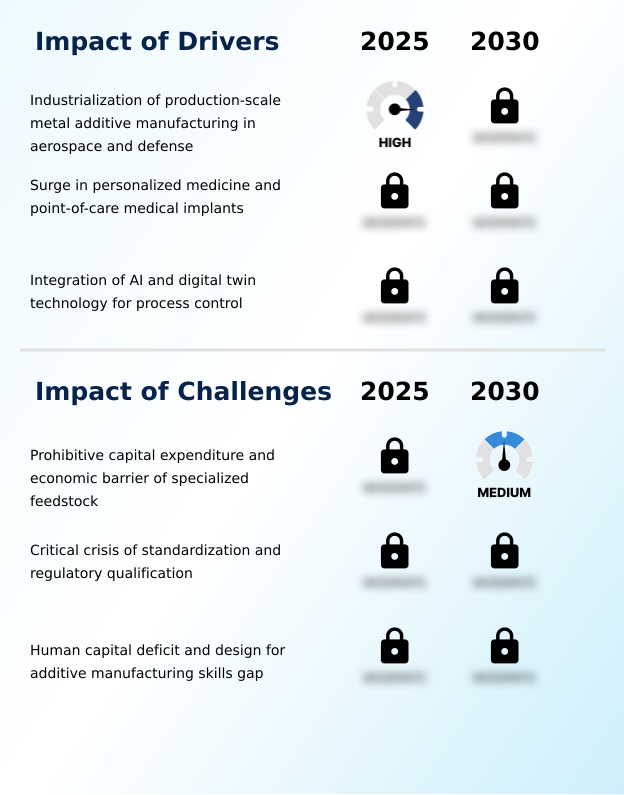
Market Dynamics

Our researchers analyzed the data with 2025 as the base year, along with the key drivers, trends, and challenges. A holistic analysis of drivers will help companies refine their marketing strategies to gain a competitive advantage.

  • The evolution of the global metal additive manufacturing market 2026-2030 is increasingly shaped by how selective laser melting impacts aerospace component design, enabling lighter and stronger parts. Simultaneously, the benefits of electron beam melting for titanium medical implants are becoming more pronounced, offering superior biocompatibility and customization.
  • A key enabler of this progress is the role of digital twin technology in metal am process control, which allows for predictive analysis and optimization. However, significant challenges in qualifying additively manufactured parts for defense persist, demanding rigorous validation. In the automotive sector, engineers are using topology optimization for automotive weight reduction, a strategy that pairs well with additive techniques.
  • The conformal cooling channels in injection mold tooling benefits provide a clear economic advantage, reducing cycle times by over 40% compared to traditionally machined tools. The cost analysis of powder bed fusion vs traditional casting continues to evolve with advancements in nickel superalloy 3d printing for turbines.
  • Techniques such as in-situ monitoring techniques for ensuring part quality and residual stress reduction methods in metal 3d printing are critical for achieving consistency. Implementing a digital thread for metal additive manufacturing is becoming standard, as are sustainability gains from metal powder recycling systems.
  • As the industry explores the material properties of 3d printed high-entropy alloys, scaling metal additive manufacturing for serial production is the ultimate goal, where the binder jetting process for mass producing stainless steel parts and wire arc additive manufacturing for large marine components showcase diverse pathways.

What are the key market drivers leading to the rise in the adoption of Metal Additive Manufacturing Industry?

  • The industrialization of production-scale metal additive manufacturing, particularly within the aerospace and defense sectors, is a key driver for market expansion.

  • Market growth is driven by the increasing demand for lightweighting structural parts and the capability for on-demand spare part fabrication, which enhances supply chain resilience.
  • The integration of AI-driven defect detection has improved first-pass yield rates by up to 20%, a critical factor for high-value industries. The ability to create complex internal geometries allows for optimized thermal management solutions in electronics and energy applications.
  • In healthcare, point-of-care manufacturing of 3d printed orthopedic devices offers personalized solutions that improve patient outcomes. This is further supported by streamlined processes for regulatory compliance for implants.
  • The push for industrial production scaling is also fueled by a continuous focus on cost per part reduction, making the technology economically viable for a broader range of applications.

What are the market trends shaping the Metal Additive Manufacturing Industry?

  • The proliferation of industrial-scale, multi-laser systems is a significant market trend. This development indicates a maturation toward mass production capabilities across key industrial sectors.

  • Key market trends are centered on the shift from rapid prototyping to production and the maturation of industrial-scale technologies. High-throughput metal printing is becoming a reality as multi-laser systems are more widely adopted, with some platforms demonstrating a 300% increase in build speed. This enables effective part consolidation strategy, which simplifies complex assemblies in aerospace and automotive applications.
  • The evolution of advanced metallurgical engineering is expanding the material palette to include high-performance alloy printing. Additionally, the development of orbital manufacturing platforms represents a forward-looking trend focused on in-space production. Sustainable manufacturing practices are also gaining traction, as feedstock recycling systems can recover over 95% of unused powder, significantly reducing material waste and operational costs.

What challenges does the Metal Additive Manufacturing Industry face during its growth?

  • Prohibitive capital expenditure, along with the economic barrier of specialized feedstock, presents a key challenge affecting widespread industry adoption and growth.

  • The market faces challenges related to standardization and the high initial investment for industrial systems. A significant hurdle is the complex process of functional validation testing, which can be time-consuming and costly, sometimes offsetting the speed advantages of additive manufacturing.
  • The skills gap in design for additive manufacturing (DFAM) remains a constraint, as engineers require specialized training to fully leverage the technology. While non-destructive testing methods are advancing, ensuring consistent quality assurance in AM across different machines and materials is still a complex issue.
  • The high cost of specialized metal powder feedstock and the operational expenses of automated powder handling systems also present economic barriers for smaller enterprises, limiting broader adoption. The lack of universal part qualification standards creates bottlenecks, particularly in safety-critical sectors.

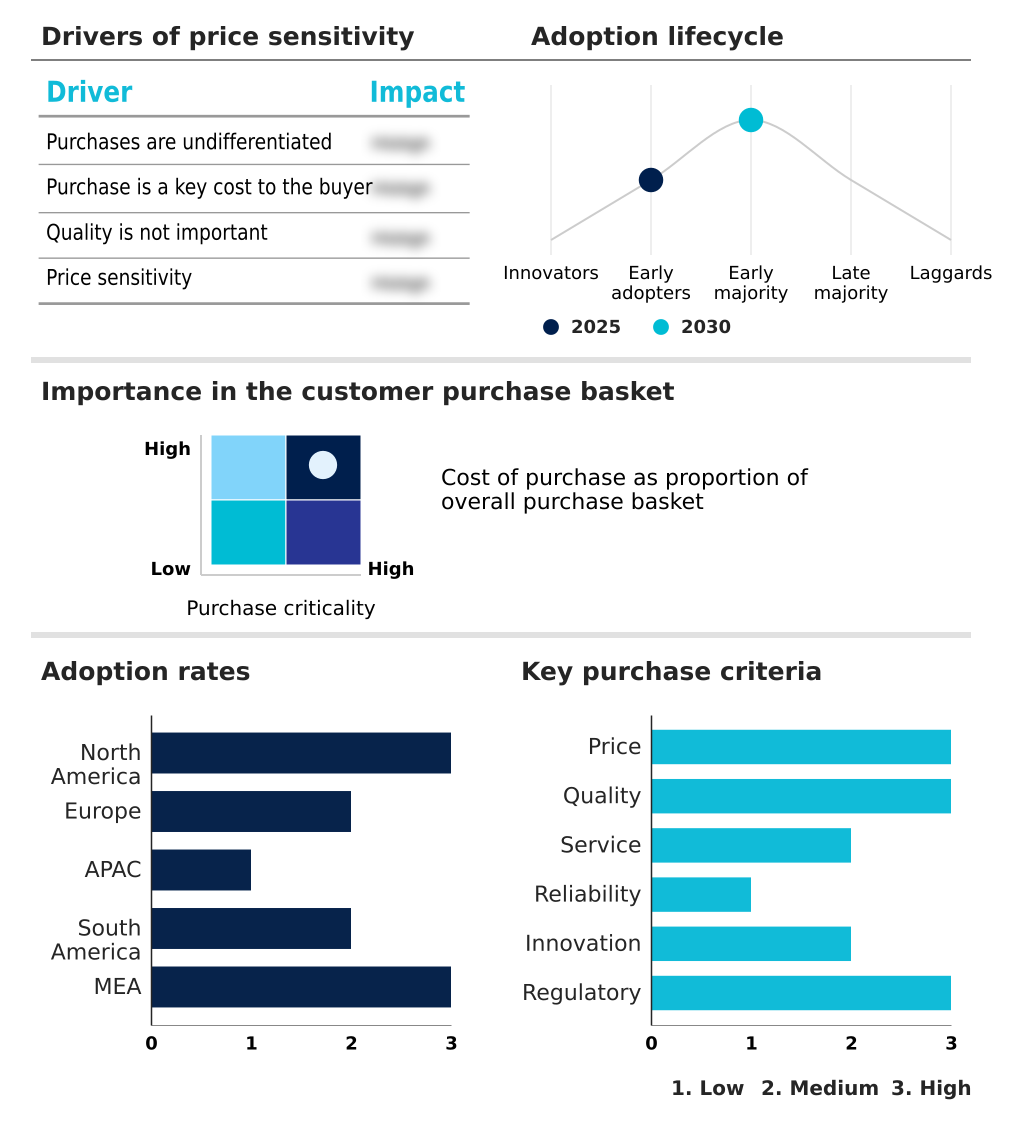
Exclusive Technavio Analysis on Customer Landscape

The metal additive manufacturing market forecasting report includes the adoption lifecycle of the market, covering from the innovator’s stage to the laggard’s stage. It focuses on adoption rates in different regions based on penetration. Furthermore, the metal additive manufacturing market report also includes key purchase criteria and drivers of price sensitivity to help companies evaluate and develop their market growth analysis strategies.

Customer Landscape of Metal Additive Manufacturing Industry

Competitive Landscape

Companies are implementing various strategies, such as strategic alliances, metal additive manufacturing market forecast, partnerships, mergers and acquisitions, geographical expansion, and product/service launches, to enhance their presence in the industry.

3D Systems Corp. - Offers metal additive manufacturing with advanced powder bed fusion systems, featuring integrated software solutions to enhance production workflows and part quality.

The industry research and growth report includes detailed analyses of the competitive landscape of the market and information about key companies, including:

  • 3D Systems Corp.
  • Additive Industries BV
  • DMG MORI Co. Ltd.
  • EOS GmbH
  • Eplus 3D
  • Hoganas AB
  • HP Inc.
  • Markforged Holding Corp.
  • Nikon Corp.
  • Norsk Titanium AS
  • Optomec Inc.
  • Renishaw Plc
  • Sandvik AB
  • Sciaky Inc.
  • Stratasys Ltd.
  • The Lincoln Electric Co.
  • TRUMPF SE Co. KG
  • Velo3D Inc.
  • Xact Metal Inc.
  • Xjet Ltd.

Qualitative and quantitative analysis of companies has been conducted to help clients understand the wider business environment as well as the strengths and weaknesses of key industry players. Data is qualitatively analyzed to categorize companies as pure play, category-focused, industry-focused, and diversified; it is quantitatively analyzed to categorize companies as dominant, leading, strong, tentative, and weak.

Recent Development and News in Metal additive manufacturing market

  • In September 2024, Innospace announced a strategic agreement to supply its INNO AM-X process control system to Hyundai for real-time quality management of metal additive manufacturing processes.
  • In January 2025, Hadrian launched its Hadrian Additive division to provide scalable, production-ready metal additive manufacturing capacity for the United States Defense Industrial Base and allied partners.
  • In March 2025, The European Union updated its industrial manufacturing guidelines, establishing clearer qualification pathways for 12-kilowatt laser powder bed fusion lines to reduce per-part production costs.
  • In April 2025, a Chilean medical startup successfully completed the implantation of several hundred customized titanium craniomaxillofacial devices, demonstrating advanced regional medical manufacturing capabilities.

Dive into Technavio’s robust research methodology, blending expert interviews, extensive data synthesis, and validated models for unparalleled Metal Additive Manufacturing Market insights. See full methodology.

Market Scope
Page number 306
Base year 2025
Historic period 2020-2024
Forecast period 2026-2030
Growth momentum & CAGR Accelerate at a CAGR of 14.4%
Market growth 2026-2030 USD 7032.8 million
Market structure Fragmented
YoY growth 2025-2026(%) 12.9%
Key countries US, Canada, Mexico, Germany, France, UK, Italy, Spain, The Netherlands, China, Japan, South Korea, India, Australia, Indonesia, Brazil, Argentina, Colombia, UAE, South Africa, Saudi Arabia, Israel and Egypt
Competitive landscape Leading Companies, Market Positioning of Companies, Competitive Strategies, and Industry Risks

Request Free Sample

Research Analyst Overview

  • The market is defined by a strategic transition toward full-scale industrialization, where the focus is on producing born-qualified parts through advanced manufacturing processes. Technologies such as selective laser melting and electron beam melting are foundational, supported by innovations in multi-laser systems and binder jetting technology.
  • The development of high-entropy alloy development and refractory metal processing is expanding application possibilities into extreme environments. A key trend impacting boardroom strategy is the integration of a complete digital thread, which combines topology optimization software and digital twin simulation for end-to-end process control.
  • This approach not only facilitates the creation of complex lattice structure designs but also addresses critical compliance requirements by ensuring layer-by-layer inspection and traceability. For instance, firms adopting closed-loop feedback control have reported a 20% improvement in part consistency, directly impacting qualification timelines and cost.
  • This push for reliability, from metal powder feedstock to post-processing heat treatment, is making metal additive manufacturing a viable alternative for creating patient-specific implants and aerospace-grade components.

What are the Key Data Covered in this Metal Additive Manufacturing Market Research and Growth Report?

  • What is the expected growth of the Metal Additive Manufacturing Market between 2026 and 2030?

    • USD 7.03 billion, at a CAGR of 14.4%

  • What segmentation does the market report cover?

    • The report is segmented by Type (Selective laser melting, and Electron beam melting), Application (Aerospace, Healthcare, Tools and mold, Automobile, and Others), Material (Stainless steel, Titanium and alloys, Nickel alloys, Aluminum alloys, and Others) and Geography (North America, Europe, APAC, South America, Middle East and Africa)

  • Which regions are analyzed in the report?

    • North America, Europe, APAC, South America and Middle East and Africa

  • What are the key growth drivers and market challenges?

    • Industrialization of production-scale metal additive manufacturing in aerospace and defense, Prohibitive capital expenditure and economic barrier of specialized feedstock

  • Who are the major players in the Metal Additive Manufacturing Market?

    • 3D Systems Corp., Additive Industries BV, DMG MORI Co. Ltd., EOS GmbH, Eplus 3D, Hoganas AB, HP Inc., Markforged Holding Corp., Nikon Corp., Norsk Titanium AS, Optomec Inc., Renishaw Plc, Sandvik AB, Sciaky Inc., Stratasys Ltd., The Lincoln Electric Co., TRUMPF SE Co. KG, Velo3D Inc., Xact Metal Inc. and Xjet Ltd.

Market Research Insights

  • The market is defined by a strategic shift from rapid prototyping to production, where advanced metallurgical engineering is enabling high-performance alloy printing. This transition is supported by innovations that directly impact operational efficiency, with some multi-laser systems improving throughput by over 300% compared to single-laser counterparts.
  • Furthermore, the use of AI-driven defect detection during layer-by-layer inspection has reduced part rejection rates by up to 25% in critical applications. The implementation of a part consolidation strategy through generative design algorithms allows manufacturers to combine multiple components into a single unit, simplifying assembly and strengthening the metal 3d printing supply chain.
  • This focus on process parameter optimization and automated powder handling is essential for achieving the industrial production scaling needed for mainstream adoption.

We can help! Our analysts can customize this metal additive manufacturing market research report to meet your requirements.

Get in touch

1. Executive Summary

1.1 Market overview

Executive Summary - Chart on Market Overview
Executive Summary - Data Table on Market Overview
Executive Summary - Chart on Global Market Characteristics
Executive Summary - Chart on Market by Geography
Executive Summary - Chart on Market Segmentation by Type
Executive Summary - Chart on Market Segmentation by Application
Executive Summary - Chart on Market Segmentation by Material
Executive Summary - Chart on Incremental Growth
Executive Summary - Data Table on Incremental Growth
Executive Summary - Chart on Company Market Positioning

2. Technavio Analysis

2.1 Analysis of price sensitivity, lifecycle, customer purchase basket, adoption rates, and purchase criteria

2.2 Criticality of inputs and Factors of differentiation

Chart on Overview on criticality of inputs and factors of differentiation

2.3 Factors of disruption

Chart on Overview on factors of disruption

2.4 Impact of drivers and challenges

Chart on Impact of drivers and challenges in 2025 and 2030

3. Market Landscape

3.1 Market ecosystem

Chart on Parent Market
Data Table on - Parent Market

3.2 Market characteristics

Chart on Market characteristics analysis

3.3 Value chain analysis

Chart on Value chain analysis

4. Market Sizing

4.1 Market definition

Data Table on Offerings of companies included in the market definition

4.2 Market segment analysis

Market segments

4.3 Market size 2025

4.4 Market outlook: Forecast for 2025-2030

Chart on Global - Market size and forecast 2025-2030 ($ million)
Data Table on Global - Market size and forecast 2025-2030 ($ million)
Chart on Global Market: Year-over-year growth 2025-2030 (%)
Data Table on Global Market: Year-over-year growth 2025-2030 (%)

5. Historic Market Size

5.1 Global Metal Additive Manufacturing Market 2020 - 2024

Historic Market Size - Data Table on Global Metal Additive Manufacturing Market 2020 - 2024 ($ million)

5.2 Type segment analysis 2020 - 2024

Historic Market Size - Type Segment 2020 - 2024 ($ million)

5.3 Application segment analysis 2020 - 2024

Historic Market Size - Application Segment 2020 - 2024 ($ million)

5.4 Material segment analysis 2020 - 2024

Historic Market Size - Material Segment 2020 - 2024 ($ million)

5.5 Geography segment analysis 2020 - 2024

Historic Market Size - Geography Segment 2020 - 2024 ($ million)

5.6 Country segment analysis 2020 - 2024

Historic Market Size - Country Segment 2020 - 2024 ($ million)

6. Qualitative Analysis

6.1 Impact of AI in global metal additive manufacturing market

7. Five Forces Analysis

7.1 Five forces summary

Five forces analysis - Comparison between 2025 and 2030

7.2 Bargaining power of buyers

Bargaining power of buyers - Impact of key factors 2025 and 2030

7.3 Bargaining power of suppliers

Bargaining power of suppliers - Impact of key factors in 2025 and 2030

7.4 Threat of new entrants

Threat of new entrants - Impact of key factors in 2025 and 2030

7.5 Threat of substitutes

Threat of substitutes - Impact of key factors in 2025 and 2030

7.6 Threat of rivalry

Threat of rivalry - Impact of key factors in 2025 and 2030

7.7 Market condition

Chart on Market condition - Five forces 2025 and 2030

8. Market Segmentation by Type

8.1 Market segments

Chart on Type - Market share 2025-2030 (%)
Data Table on Type - Market share 2025-2030 (%)

8.2 Comparison by Type

Chart on Comparison by Type
Data Table on Comparison by Type

8.3 Selective laser melting - Market size and forecast 2025-2030

Chart on Selective laser melting - Market size and forecast 2025-2030 ($ million)
Data Table on Selective laser melting - Market size and forecast 2025-2030 ($ million)
Chart on Selective laser melting - Year-over-year growth 2025-2030 (%)
Data Table on Selective laser melting - Year-over-year growth 2025-2030 (%)

8.4 Electron beam melting - Market size and forecast 2025-2030

Chart on Electron beam melting - Market size and forecast 2025-2030 ($ million)
Data Table on Electron beam melting - Market size and forecast 2025-2030 ($ million)
Chart on Electron beam melting - Year-over-year growth 2025-2030 (%)
Data Table on Electron beam melting - Year-over-year growth 2025-2030 (%)

8.5 Market opportunity by Type

Market opportunity by Type ($ million)
Data Table on Market opportunity by Type ($ million)

9. Market Segmentation by Application

9.1 Market segments

Chart on Application - Market share 2025-2030 (%)
Data Table on Application - Market share 2025-2030 (%)

9.2 Comparison by Application

Chart on Comparison by Application
Data Table on Comparison by Application

9.3 Aerospace - Market size and forecast 2025-2030

Chart on Aerospace - Market size and forecast 2025-2030 ($ million)
Data Table on Aerospace - Market size and forecast 2025-2030 ($ million)
Chart on Aerospace - Year-over-year growth 2025-2030 (%)
Data Table on Aerospace - Year-over-year growth 2025-2030 (%)

9.4 Healthcare - Market size and forecast 2025-2030

Chart on Healthcare - Market size and forecast 2025-2030 ($ million)
Data Table on Healthcare - Market size and forecast 2025-2030 ($ million)
Chart on Healthcare - Year-over-year growth 2025-2030 (%)
Data Table on Healthcare - Year-over-year growth 2025-2030 (%)

9.5 Tools and mold - Market size and forecast 2025-2030

Chart on Tools and mold - Market size and forecast 2025-2030 ($ million)
Data Table on Tools and mold - Market size and forecast 2025-2030 ($ million)
Chart on Tools and mold - Year-over-year growth 2025-2030 (%)
Data Table on Tools and mold - Year-over-year growth 2025-2030 (%)

9.6 Automobile - Market size and forecast 2025-2030

Chart on Automobile - Market size and forecast 2025-2030 ($ million)
Data Table on Automobile - Market size and forecast 2025-2030 ($ million)
Chart on Automobile - Year-over-year growth 2025-2030 (%)
Data Table on Automobile - Year-over-year growth 2025-2030 (%)

9.7 Others - Market size and forecast 2025-2030

Chart on Others - Market size and forecast 2025-2030 ($ million)
Data Table on Others - Market size and forecast 2025-2030 ($ million)
Chart on Others - Year-over-year growth 2025-2030 (%)
Data Table on Others - Year-over-year growth 2025-2030 (%)

9.8 Market opportunity by Application

Market opportunity by Application ($ million)
Data Table on Market opportunity by Application ($ million)

10. Market Segmentation by Material

10.1 Market segments

Chart on Material - Market share 2025-2030 (%)
Data Table on Material - Market share 2025-2030 (%)

10.2 Comparison by Material

Chart on Comparison by Material
Data Table on Comparison by Material

10.3 Stainless steel - Market size and forecast 2025-2030

Chart on Stainless steel - Market size and forecast 2025-2030 ($ million)
Data Table on Stainless steel - Market size and forecast 2025-2030 ($ million)
Chart on Stainless steel - Year-over-year growth 2025-2030 (%)
Data Table on Stainless steel - Year-over-year growth 2025-2030 (%)

10.4 Titanium and alloys - Market size and forecast 2025-2030

Chart on Titanium and alloys - Market size and forecast 2025-2030 ($ million)
Data Table on Titanium and alloys - Market size and forecast 2025-2030 ($ million)
Chart on Titanium and alloys - Year-over-year growth 2025-2030 (%)
Data Table on Titanium and alloys - Year-over-year growth 2025-2030 (%)

10.5 Nickel alloys - Market size and forecast 2025-2030

Chart on Nickel alloys - Market size and forecast 2025-2030 ($ million)
Data Table on Nickel alloys - Market size and forecast 2025-2030 ($ million)
Chart on Nickel alloys - Year-over-year growth 2025-2030 (%)
Data Table on Nickel alloys - Year-over-year growth 2025-2030 (%)

10.6 Aluminum alloys - Market size and forecast 2025-2030

Chart on Aluminum alloys - Market size and forecast 2025-2030 ($ million)
Data Table on Aluminum alloys - Market size and forecast 2025-2030 ($ million)
Chart on Aluminum alloys - Year-over-year growth 2025-2030 (%)
Data Table on Aluminum alloys - Year-over-year growth 2025-2030 (%)

10.7 Others - Market size and forecast 2025-2030

Chart on Others - Market size and forecast 2025-2030 ($ million)
Data Table on Others - Market size and forecast 2025-2030 ($ million)
Chart on Others - Year-over-year growth 2025-2030 (%)
Data Table on Others - Year-over-year growth 2025-2030 (%)

10.8 Market opportunity by Material

Market opportunity by Material ($ million)
Data Table on Market opportunity by Material ($ million)

11. Customer Landscape

11.1 Customer landscape overview

Analysis of price sensitivity, lifecycle, customer purchase basket, adoption rates, and purchase criteria

12. Geographic Landscape

12.1 Geographic segmentation

Chart on Market share by geography 2025-2030 (%)
Data Table on Market share by geography 2025-2030 (%)

12.2 Geographic comparison

Chart on Geographic comparison
Data Table on Geographic comparison

12.3 North America - Market size and forecast 2025-2030

Chart on North America - Market size and forecast 2025-2030 ($ million)
Data Table on North America - Market size and forecast 2025-2030 ($ million)
Chart on North America - Year-over-year growth 2025-2030 (%)
Data Table on North America - Year-over-year growth 2025-2030 (%)
Chart on Regional Comparison - North America
Data Table on Regional Comparison - North America

12.3.1 US - Market size and forecast 2025-2030

Chart on US - Market size and forecast 2025-2030 ($ million)
Data Table on US - Market size and forecast 2025-2030 ($ million)
Chart on US - Year-over-year growth 2025-2030 (%)
Data Table on US - Year-over-year growth 2025-2030 (%)

12.3.2 Canada - Market size and forecast 2025-2030

Chart on Canada - Market size and forecast 2025-2030 ($ million)
Data Table on Canada - Market size and forecast 2025-2030 ($ million)
Chart on Canada - Year-over-year growth 2025-2030 (%)
Data Table on Canada - Year-over-year growth 2025-2030 (%)

12.3.3 Mexico - Market size and forecast 2025-2030

Chart on Mexico - Market size and forecast 2025-2030 ($ million)
Data Table on Mexico - Market size and forecast 2025-2030 ($ million)
Chart on Mexico - Year-over-year growth 2025-2030 (%)
Data Table on Mexico - Year-over-year growth 2025-2030 (%)

12.4 Europe - Market size and forecast 2025-2030

Chart on Europe - Market size and forecast 2025-2030 ($ million)
Data Table on Europe - Market size and forecast 2025-2030 ($ million)
Chart on Europe - Year-over-year growth 2025-2030 (%)
Data Table on Europe - Year-over-year growth 2025-2030 (%)
Chart on Regional Comparison - Europe
Data Table on Regional Comparison - Europe

12.4.1 Germany - Market size and forecast 2025-2030

Chart on Germany - Market size and forecast 2025-2030 ($ million)
Data Table on Germany - Market size and forecast 2025-2030 ($ million)
Chart on Germany - Year-over-year growth 2025-2030 (%)
Data Table on Germany - Year-over-year growth 2025-2030 (%)

12.4.2 France - Market size and forecast 2025-2030

Chart on France - Market size and forecast 2025-2030 ($ million)
Data Table on France - Market size and forecast 2025-2030 ($ million)
Chart on France - Year-over-year growth 2025-2030 (%)
Data Table on France - Year-over-year growth 2025-2030 (%)

12.4.3 UK - Market size and forecast 2025-2030

Chart on UK - Market size and forecast 2025-2030 ($ million)
Data Table on UK - Market size and forecast 2025-2030 ($ million)
Chart on UK - Year-over-year growth 2025-2030 (%)
Data Table on UK - Year-over-year growth 2025-2030 (%)

12.4.4 Italy - Market size and forecast 2025-2030

Chart on Italy - Market size and forecast 2025-2030 ($ million)
Data Table on Italy - Market size and forecast 2025-2030 ($ million)
Chart on Italy - Year-over-year growth 2025-2030 (%)
Data Table on Italy - Year-over-year growth 2025-2030 (%)

12.4.5 Spain - Market size and forecast 2025-2030

Chart on Spain - Market size and forecast 2025-2030 ($ million)
Data Table on Spain - Market size and forecast 2025-2030 ($ million)
Chart on Spain - Year-over-year growth 2025-2030 (%)
Data Table on Spain - Year-over-year growth 2025-2030 (%)

12.4.6 The Netherlands - Market size and forecast 2025-2030

Chart on The Netherlands - Market size and forecast 2025-2030 ($ million)
Data Table on The Netherlands - Market size and forecast 2025-2030 ($ million)
Chart on The Netherlands - Year-over-year growth 2025-2030 (%)
Data Table on The Netherlands - Year-over-year growth 2025-2030 (%)

12.5 APAC - Market size and forecast 2025-2030

Chart on APAC - Market size and forecast 2025-2030 ($ million)
Data Table on APAC - Market size and forecast 2025-2030 ($ million)
Chart on APAC - Year-over-year growth 2025-2030 (%)
Data Table on APAC - Year-over-year growth 2025-2030 (%)
Chart on Regional Comparison - APAC
Data Table on Regional Comparison - APAC

12.5.1 China - Market size and forecast 2025-2030

Chart on China - Market size and forecast 2025-2030 ($ million)
Data Table on China - Market size and forecast 2025-2030 ($ million)
Chart on China - Year-over-year growth 2025-2030 (%)
Data Table on China - Year-over-year growth 2025-2030 (%)

12.5.2 Japan - Market size and forecast 2025-2030

Chart on Japan - Market size and forecast 2025-2030 ($ million)
Data Table on Japan - Market size and forecast 2025-2030 ($ million)
Chart on Japan - Year-over-year growth 2025-2030 (%)
Data Table on Japan - Year-over-year growth 2025-2030 (%)

12.5.3 South Korea - Market size and forecast 2025-2030

Chart on South Korea - Market size and forecast 2025-2030 ($ million)
Data Table on South Korea - Market size and forecast 2025-2030 ($ million)
Chart on South Korea - Year-over-year growth 2025-2030 (%)
Data Table on South Korea - Year-over-year growth 2025-2030 (%)

12.5.4 India - Market size and forecast 2025-2030

Chart on India - Market size and forecast 2025-2030 ($ million)
Data Table on India - Market size and forecast 2025-2030 ($ million)
Chart on India - Year-over-year growth 2025-2030 (%)
Data Table on India - Year-over-year growth 2025-2030 (%)

12.5.5 Australia - Market size and forecast 2025-2030

Chart on Australia - Market size and forecast 2025-2030 ($ million)
Data Table on Australia - Market size and forecast 2025-2030 ($ million)
Chart on Australia - Year-over-year growth 2025-2030 (%)
Data Table on Australia - Year-over-year growth 2025-2030 (%)

12.5.6 Indonesia - Market size and forecast 2025-2030

Chart on Indonesia - Market size and forecast 2025-2030 ($ million)
Data Table on Indonesia - Market size and forecast 2025-2030 ($ million)
Chart on Indonesia - Year-over-year growth 2025-2030 (%)
Data Table on Indonesia - Year-over-year growth 2025-2030 (%)

12.6 South America - Market size and forecast 2025-2030

Chart on South America - Market size and forecast 2025-2030 ($ million)
Data Table on South America - Market size and forecast 2025-2030 ($ million)
Chart on South America - Year-over-year growth 2025-2030 (%)
Data Table on South America - Year-over-year growth 2025-2030 (%)
Chart on Regional Comparison - South America
Data Table on Regional Comparison - South America

12.6.1 Brazil - Market size and forecast 2025-2030

Chart on Brazil - Market size and forecast 2025-2030 ($ million)
Data Table on Brazil - Market size and forecast 2025-2030 ($ million)
Chart on Brazil - Year-over-year growth 2025-2030 (%)
Data Table on Brazil - Year-over-year growth 2025-2030 (%)

12.6.2 Argentina - Market size and forecast 2025-2030

Chart on Argentina - Market size and forecast 2025-2030 ($ million)
Data Table on Argentina - Market size and forecast 2025-2030 ($ million)
Chart on Argentina - Year-over-year growth 2025-2030 (%)
Data Table on Argentina - Year-over-year growth 2025-2030 (%)

12.6.3 Colombia - Market size and forecast 2025-2030

Chart on Colombia - Market size and forecast 2025-2030 ($ million)
Data Table on Colombia - Market size and forecast 2025-2030 ($ million)
Chart on Colombia - Year-over-year growth 2025-2030 (%)
Data Table on Colombia - Year-over-year growth 2025-2030 (%)

12.7 Middle East and Africa - Market size and forecast 2025-2030

Chart on Middle East and Africa - Market size and forecast 2025-2030 ($ million)
Data Table on Middle East and Africa - Market size and forecast 2025-2030 ($ million)
Chart on Middle East and Africa - Year-over-year growth 2025-2030 (%)
Data Table on Middle East and Africa - Year-over-year growth 2025-2030 (%)
Chart on Regional Comparison - Middle East and Africa
Data Table on Regional Comparison - Middle East and Africa

12.7.1 UAE - Market size and forecast 2025-2030

Chart on UAE - Market size and forecast 2025-2030 ($ million)
Data Table on UAE - Market size and forecast 2025-2030 ($ million)
Chart on UAE - Year-over-year growth 2025-2030 (%)
Data Table on UAE - Year-over-year growth 2025-2030 (%)

12.7.2 South Africa - Market size and forecast 2025-2030

Chart on South Africa - Market size and forecast 2025-2030 ($ million)
Data Table on South Africa - Market size and forecast 2025-2030 ($ million)
Chart on South Africa - Year-over-year growth 2025-2030 (%)
Data Table on South Africa - Year-over-year growth 2025-2030 (%)

12.7.3 Saudi Arabia - Market size and forecast 2025-2030

Chart on Saudi Arabia - Market size and forecast 2025-2030 ($ million)
Data Table on Saudi Arabia - Market size and forecast 2025-2030 ($ million)
Chart on Saudi Arabia - Year-over-year growth 2025-2030 (%)
Data Table on Saudi Arabia - Year-over-year growth 2025-2030 (%)

12.7.4 Israel - Market size and forecast 2025-2030

Chart on Israel - Market size and forecast 2025-2030 ($ million)
Data Table on Israel - Market size and forecast 2025-2030 ($ million)
Chart on Israel - Year-over-year growth 2025-2030 (%)
Data Table on Israel - Year-over-year growth 2025-2030 (%)

12.7.5 Egypt - Market size and forecast 2025-2030

Chart on Egypt - Market size and forecast 2025-2030 ($ million)
Data Table on Egypt - Market size and forecast 2025-2030 ($ million)
Chart on Egypt - Year-over-year growth 2025-2030 (%)
Data Table on Egypt - Year-over-year growth 2025-2030 (%)

12.8 Market opportunity by geography

Market opportunity by geography ($ million)
Data Tables on Market opportunity by geography ($ million)

13. Drivers, Challenges, and Opportunity

13.1 Market drivers

Industrialization of production-scale metal additive manufacturing in aerospace and defense
Surge in personalized medicine and point-of-care medical implants
Integration of AI and digital twin technology for process control

13.2 Market challenges

Prohibitive capital expenditure and economic barrier of specialized feedstock
Critical crisis of standardization and regulatory qualification
Human capital deficit and design for additive manufacturing skills gap

13.3 Impact of drivers and challenges

Impact of drivers and challenges in 2025 and 2030

13.4 Market opportunities

Proliferation of industrial-scale multi-laser systems and mass production maturation
Evolution of specialized material portfolios and green metallurgical engineering
Transition toward in-space manufacturing and microgravity material processing

14. Competitive Landscape

14.1 Overview

14.2

Overview on criticality of inputs and factors of differentiation

14.3 Landscape disruption

Overview on factors of disruption

14.4 Industry risks

Impact of key risks on business

15. Competitive Analysis

15.1 Companies profiled

Companies covered

15.2 Company ranking index

15.3 Market positioning of companies

Matrix on companies position and classification

15.4 3D Systems Corp.

3D Systems Corp. - Overview
3D Systems Corp. - Business segments
3D Systems Corp. - Key news
3D Systems Corp. - Key offerings
3D Systems Corp. - Segment focus
SWOT

15.5 Additive Industries BV

Additive Industries BV - Overview
Additive Industries BV - Product / Service
Additive Industries BV - Key offerings
SWOT

15.6 DMG MORI Co. Ltd.

DMG MORI Co. Ltd. - Overview
DMG MORI Co. Ltd. - Business segments
DMG MORI Co. Ltd. - Key offerings
DMG MORI Co. Ltd. - Segment focus
SWOT

15.7 EOS GmbH

EOS GmbH - Overview
EOS GmbH - Product / Service
EOS GmbH - Key news
EOS GmbH - Key offerings
SWOT

15.8 Eplus 3D

Eplus 3D - Overview
Eplus 3D - Product / Service
Eplus 3D - Key offerings
SWOT

15.9 Hoganas AB

Hoganas AB - Overview
Hoganas AB - Product / Service
Hoganas AB - Key offerings
SWOT

15.10 HP Inc.

HP Inc. - Overview
HP Inc. - Business segments
HP Inc. - Key news
HP Inc. - Key offerings
HP Inc. - Segment focus
SWOT

15.11 Markforged Holding Corp.

Markforged Holding Corp. - Overview
Markforged Holding Corp. - Product / Service
Markforged Holding Corp. - Key offerings
SWOT

15.12 Nikon Corp.

Nikon Corp. - Overview
Nikon Corp. - Business segments
Nikon Corp. - Key offerings
Nikon Corp. - Segment focus
SWOT

15.13 Optomec Inc.

Optomec Inc. - Overview
Optomec Inc. - Product / Service
Optomec Inc. - Key offerings
SWOT

15.14 Renishaw Plc

Renishaw Plc - Overview
Renishaw Plc - Business segments
Renishaw Plc - Key offerings
Renishaw Plc - Segment focus
SWOT

15.15 Sandvik AB

Sandvik AB - Overview
Sandvik AB - Business segments
Sandvik AB - Key news
Sandvik AB - Key offerings
Sandvik AB - Segment focus
SWOT

15.16 Stratasys Ltd.

Stratasys Ltd. - Overview
Stratasys Ltd. - Product / Service
Stratasys Ltd. - Key news
Stratasys Ltd. - Key offerings
SWOT

15.17 The Lincoln Electric Co.

The Lincoln Electric Co. - Overview
The Lincoln Electric Co. - Business segments
The Lincoln Electric Co. - Key news
The Lincoln Electric Co. - Key offerings
The Lincoln Electric Co. - Segment focus
SWOT

15.18 Xact Metal Inc.

Xact Metal Inc. - Overview
Xact Metal Inc. - Product / Service
Xact Metal Inc. - Key offerings
SWOT

16. Appendix

16.1 Scope of the report

Market definition
Objectives
Notes and caveats

16.2 Inclusions and exclusions checklist

Inclusions checklist
Exclusions checklist

16.3 Currency conversion rates for US$

16.4 Research methodology

16.5 Data procurement

Information sources

16.6 Data validation

16.7 Validation techniques employed for market sizing

16.8 Data synthesis

16.9 360 degree market analysis

16.10 List of abbreviations

Research Methodology

Technavio presents a detailed picture of the market by way of study, synthesis, and summation of data from multiple sources. The analysts have presented the various facets of the market with a particular focus on identifying the key industry influencers. The data thus presented is comprehensive, reliable, and the result of extensive research, both primary and secondary.

INFORMATION SOURCES

Primary sources

  • Manufacturers and suppliers
  • Channel partners
  • Industry experts
  • Strategic decision makers

Secondary sources

  • Industry journals and periodicals
  • Government data
  • Financial reports of key industry players
  • Historical data
  • Press releases

DATA ANALYSIS

Data Synthesis

  • Collation of data
  • Estimation of key figures
  • Analysis of derived insights

Data Validation

  • Triangulation with data models
  • Reference against proprietary databases
  • Corroboration with industry experts

REPORT WRITING

Qualitative

  • Market drivers
  • Market challenges
  • Market trends
  • Five forces analysis

Quantitative

  • Market size and forecast
  • Market segmentation
  • Geographical insights
  • Competitive landscape

Interested in this report?

Get your sample now to see our research methodology and insights!

Download Now

Frequently Asked Questions

Metal Additive Manufacturing market growth will increase by USD 7032.8 million during 2026-2030.

The Metal Additive Manufacturing market is expected to grow at a CAGR of 14.4% during 2026-2030.

Metal Additive Manufacturing market is segmented by Type (Selective laser melting, Electron beam melting) Application (Aerospace, Healthcare, Tools and mold, Automobile, Others) Material (Stainless steel, Titanium and alloys, Nickel alloys, Aluminum alloys, Others)

3D Systems Corp., Additive Industries BV, DMG MORI Co. Ltd., EOS GmbH, Eplus 3D, Hoganas AB, HP Inc., Markforged Holding Corp., Nikon Corp., Norsk Titanium AS, Optomec Inc., Renishaw Plc, Sandvik AB, Sciaky Inc., Stratasys Ltd., The Lincoln Electric Co., TRUMPF SE Co. KG, Velo3D Inc., Xact Metal Inc., Xjet Ltd. are a few of the key vendors in the Metal Additive Manufacturing market.

North America will register the highest growth rate of 43.7% among the other regions. Therefore, the Metal Additive Manufacturing market in North America is expected to garner significant business opportunities for the vendors during the forecast period.

US, Canada, Mexico, Germany, France, UK, Italy, Spain, The Netherlands, China, Japan, South Korea, India, Australia, Indonesia, Brazil, Argentina, Colombia, UAE, South Africa, Saudi Arabia, Israel, Egypt

  • Industrialization of production-scale metal additive manufacturing in aerospace and defense is the driving factor this market.

The Metal Additive Manufacturing market vendors should focus on grabbing business opportunities from the Type segment as it accounted for the largest market share in the base year.