Metal Treatment Chemical Market Size 2024-2028
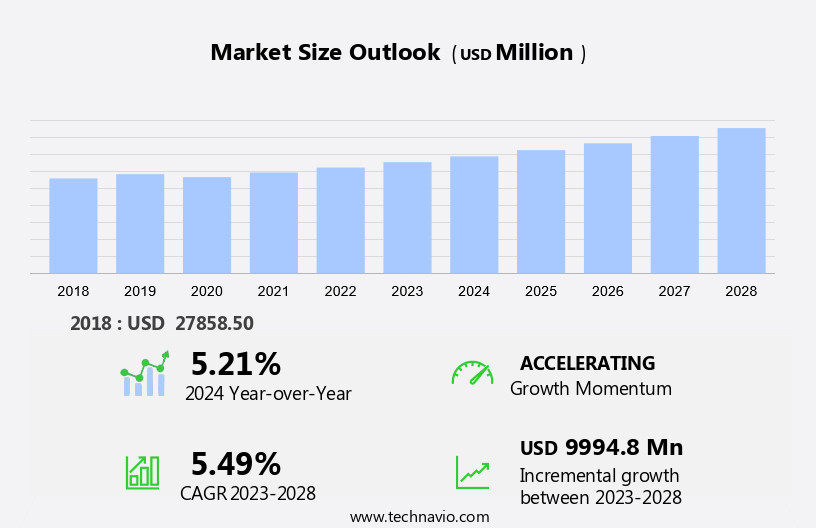
The metal treatment chemical market size is forecast to increase by USD 9.99 billion at a CAGR of 5.49% between 2023 and 2028.
- The market is experiencing significant growth due to several key factors. Firstly, the increasing demand for dependable machinery and its subsequent maintenance is driving market expansion. This need is particularly prominent in North America, where industries such as automotive and aerospace rely heavily on metal treatment chemicals for manufacturing and maintaining their equipment. Another trend influencing the market is the emergence of bio-based metal treatment chemicals. These eco-friendly alternatives offer a sustainable solution to traditional metal treatment methods and are gaining popularity among environmentally-conscious consumers and businesses. Additionally, fluctuations in crude oil prices can impact the market as many metal treatment chemicals are derived from petroleum. Overall, these factors contribute to the dynamic and evolving landscape of the metal treatment chemical industry.
What will be the Size of the Metal Treatment Chemical Market During the Forecast Period?
- The market encompasses a wide range of products and technologies used to protect and enhance the properties of metal surfaces. International firms and local players alike are investing significantly in this sector, driven by the growing demand for lightweight metals and corrosion-resistant metals in various industries. The automotive sector is a major consumer of metal surface protection solutions, with a focus on emissions-free mobility and the need for durable, high-performance components. Surface coating technology plays a crucial role in this regard, offering barrier protection against corrosive conditions and enhancing the electrical properties, deterioration resistance, stain resistance, reflectivity, rigidity, and organic resistance of metal parts.
- Pre-treatment coatings and membranes are essential components of the metal finishing process, providing a foundation for effective surface coating. These treatments often involve the use of metal surface preparation chemicals, such as chlorinated solvents and oxygenated solvents, which help to clean and prepare the surface for optimal coating adhesion. Surfactants are another key category of metal treatment chemicals, used in polishing processes to improve the smoothness and appearance of metal surfaces. These chemicals help to reduce surface tension and improve the wetting properties of the metal, facilitating efficient and effective polishing. In summary, the market is a dynamic and innovative sector, driven by the evolving needs of various industries for durable, high-performance metal components. From pre-treatment coatings and membranes to surface finishing chemicals and polishing agents, a diverse range of products and technologies are available to meet these demands.
How is this Metal Treatment Chemical Industry segmented and which is the largest segment?
The metal treatment chemical industry research report provides comprehensive data (region-wise segment analysis), with forecasts and estimates in "USD billion" for the period 2024-2028, as well as historical data from 2018-2022 for the following segments.
- Type
- Cleaners
- Lubricants and coolants
- Conversion coatings
- Rust and scale removers
- Others
- Application
- Automotive
- Manufacturing
- Construction
- Aerospace
- Metalworking and Others
- Geography
- APAC
- China
- India
- North America
- Mexico
- US
- Europe
- Germany
- UK
- South America
- Middle East and Africa
- APAC
By Type Insights
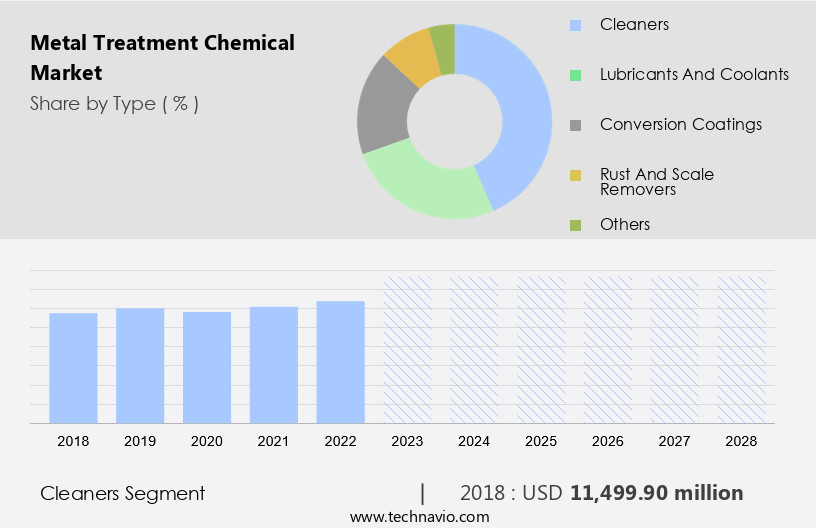
- The cleaners segment is estimated to witness significant growth during the forecast period.
Metallic cleaners are essential in the manufacturing process of components for automobiles, aviation, and durable goods such as washing machines. Following machining processes, metal parts require cleaning to prepare them for subsequent finishing stages, including painting. Inadequate cleaning negatively impacts paintability and contributes to painted part defects. Selecting an appropriate metal cleaner depends on the type of dirt and metal substrate. It is crucial to use a cleaner that does not damage the metal substrate. The choice of metal cleaner is a significant challenge due to the need for effective cleaning without harming the underlying metal.
Metal treatment chemicals, including stain resistance agents, reflectivity enhancers, rigidity enhancers, organic resistance agents, electrical conductivity enhancers, chlorinated solvents, oxygenated solvents, surfactants, solutions of metals, salts, and acids, play a vital role in addressing these challenges. These chemicals enhance the properties of metals, ensuring optimal cleaning and preparing them for further processing.

Get a glance at the market report of share of various segments Request Free Sample
The cleaners segment was valued at USD 11.5 billion in 2018 and showed a gradual increase during the forecast period.
Regional Analysis
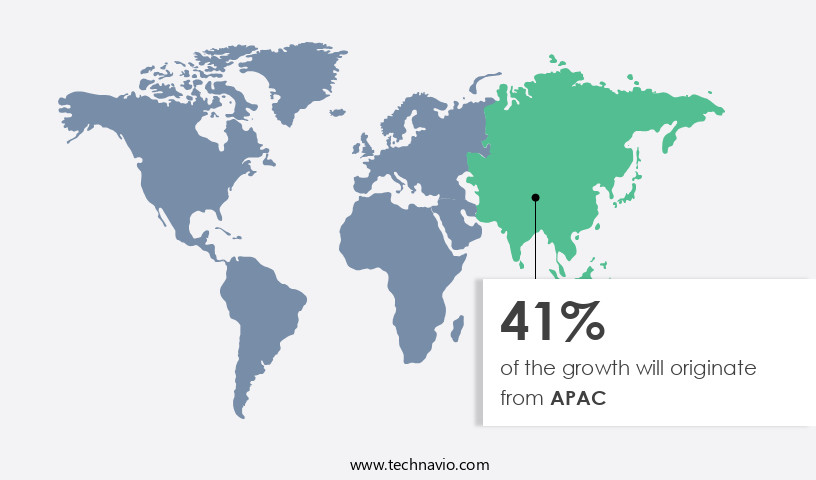
- APAC is estimated to contribute 41% to the growth of the global market during the forecast period.
Technavio's analysts have elaborately explained the regional trends and drivers that shape the market during the forecast period.
For more insights on the market size of various regions, Request Free Sample
The market in the Asia Pacific (APAC) region is experiencing significant growth due to the high demand in industries such as automotive, construction, and refining. Key contributing countries include China, India, Japan, and South Korea. The market's diversity is driven by rapid industrialization, business expansion, and a large number of regional and local companies. The automotive sector is the primary driver of demand for metal treatment chemicals in APAC, with the increasing focus on lightweight and corrosion-resistant metals for emissions-free mobility. Metal surface protection technologies, including anodizing and plating, are also gaining popularity for their corrosion protective properties. The market in APAC is expected to continue its growth trajectory, making it an attractive investment opportunity for international firms.
Market Dynamics
Our researchers analyzed the data with 2023 as the base year, along with the key drivers, trends, and challenges. A holistic analysis of drivers will help companies refine their marketing strategies to gain a competitive advantage.
What are the key market drivers leading to the rise in the adoption of Metal Treatment Chemical Industry?
Increasing need for reliable machinery and its effective maintenance is the key driver of the market.
- The market encompasses a range of specialty chemicals used for Metal Surface Protection in various industries. International and local firms manufacture and supply these chemicals for applications in lightweight metals and corrosion-resistant metals. The automotive sector is a significant end-user, with a focus on emissions-free mobility driving demand for corrosion-protective coatings and surface finishing technologies like anodizing and plating. Industrial machinery, electronics & electrical, construction, aerospace, transportation, and original equipment manufacturers (OEMs) also utilize metalworking chemicals for cleaning, pre-treatment coatings, and polishing processes. These treatments enhance corrosion resistance, wear resistance, and improve the appearance of metal parts in harsh, corrosive conditions. Surface coating technologies, such as membrane technology and metal finishing chemicals, play a crucial role in ensuring the longevity and functionality of metal components in diverse industries.
- Moreover, metal plating processes, including electroplating and plastisol plating, provide additional barrier protection against moisture and other environmental factors. In summary, the Metal Treatment Chemical Market caters to the needs of numerous industries, offering a wide range of solutions for metal surface protection, including cleaning, pre-treatment coatings, polishing processes, and metal plating. These treatments ensure the durability, functionality, and aesthetics of metal parts in various applications, from vehicle manufacturing to industrial machinery and construction. Thus, such factors are driving the growth of the market during the forecast period.
What are the market trends shaping the Metal Treatment Chemical Industry?
Emergence of bio-based metal treatment chemicals is the upcoming market trend.
- The market encompasses a wide range of specialty chemicals used for Metal Surface Protection in various industries. International and local firms manufacture and supply these chemicals for Lightweight Metals and Corrosion-Resistant Metals, catering to the demands of the Automotive Sector, Emissions-Free Mobility, and other sectors. Surface Coating Technology plays a crucial role in this market, with techniques such as Anodizing, Platting, and Cleaning being commonly used for corrosion protection and enhancing the appearance and wear resistance of Metal parts.
- Moreover, the pre-treatment coatings, Membrane technology, and Metal finishing chemicals are essential components of the metalworking process. Polishing processes and Corrosion resistance treatments are also in high demand, particularly in industries exposed to harsh, corrosive conditions. Industrial Machinery, Electronics & Electrical, Construction, Aerospace, Transportation, Original Equipment Manufacturers, and Specialty Chemicals are key end-users of these Metal Treatment Chemicals. Coatings treatments are used to provide a barrier against moisture, while Metal plating and Plastics are utilized in various applications, including Electronics and electrical components. Thus, such trends will shape the growth of the market during the forecast period.
What challenges does the Metal Treatment Chemical Industry face during its growth?
Fluctuations in crude oil prices is a key challenge affecting the industry growth.
- The market encompasses a wide range of products and processes used for enhancing the properties of metal surfaces. International and local firms provide solutions for Metal Surface Protection, catering to various industries such as Lightweight Metals, Corrosion-Resistant Metals, Automotive Sector, Emissions-Free Mobility, and more. Surface Coating Technology plays a crucial role in this market, with techniques like Anodizing, Platting, and various pre-treatment coatings offering corrosion protection and improved appearance. Metalworking processes like Cleaning, Paint Stripping, and Polishing are integral to the market. Industrial Machinery, Electronics & Electrical, Construction, Aerospace, Transportation, and Original Equipment Manufacturers (OEMs) are significant consumers of metal treatment chemicals.
- Moreover, specialty Chemicals, including coating treatments, membranes, and metal finishing chemicals, are essential for ensuring the barrier against corrosive conditions. Moisture resistance, wear resistance, and enhanced corrosion resistance are key benefits of metal treatment chemicals. They are used in vehicles, plastics, electronics and electrical, and various other applications. Electroplating is a popular method for applying metal coatings to enhance durability and electrical conductivity. The Metal Treatment Chemical Market is expected to grow significantly due to the increasing demand for high-performance materials in various industries. Hence, the above factors will impede the growth of the market during the forecast period.
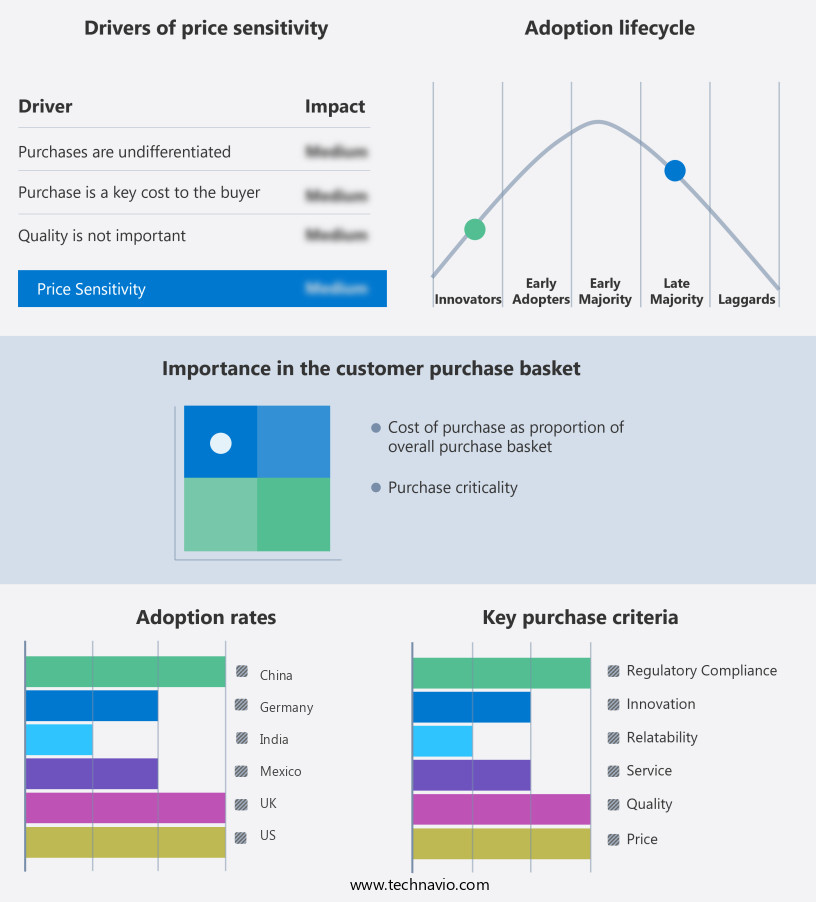
Exclusive Customer Landscape
The metal treatment chemical market forecasting report includes the adoption lifecycle of the market, market growth and forecasting, covering from the innovator's stage to the laggard's stage. It focuses on adoption rates in different regions based on penetration. Furthermore, the metal treatment chemical market report also includes key purchase criteria and drivers of price sensitivity to help companies evaluate and develop their market growth analysis strategies.
Customer Landscape
Key Companies & Market Insights
Companies are implementing various strategies, such as strategic alliances, metal treatment chemical market forecast, partnerships, mergers and acquisitions, geographical expansion, and product/service launches, to enhance their presence in the industry.
The industry research and growth report includes detailed analyses of the competitive landscape of the market and information about key companies, including:
- AD International B.V.
- Algol Chemicals
- AL-SAIF CHEMICAL MANUFACTURING
- Ashok Industry
- BASF SE
- Chemetall GmbH
- Dimetrics Chemicals Pvt Ltd
- Diya Chemicals
- Dow Inc.
- Eastman Chemical Co.
- Evonik Industries AG
- Mahavir Chemicals
- Nihon Parkerizing Co., Ltd.
- Prime Chemicals
- Salts and Chemicals Private Ltd.
- Sanko Shokai Co., Ltd.
- Shandong IRO Chelating Chemical Co. Ltd.
- Vanchem Performance Chemicals
- Wuhan Jadechem International Trade Co.,Ltd.
Qualitative and quantitative analysis of companies has been conducted to help clients understand the wider business environment as well as the strengths and weaknesses of key industry players. Data is qualitatively analyzed to categorize companies as pure play, category-focused, industry-focused, and diversified; it is quantitatively analyzed to categorize companies as dominant, leading, strong, tentative, and weak.
Research Analyst Overview
Metal surface protection is a critical aspect of various industries, including automotive, aerospace, construction, industrial machinery, electronics & electrical, and transportation. The demand for metal surface protection solutions continues to grow due to the increasing use of lightweight metals and corrosion-resistant metals in these sectors. In this article, we will explore the market dynamics and trends in the metal surface protection chemical industry. The metal surface protection chemical market is driven by several factors, including the growing demand for corrosion-resistant metals, increasing focus on emissions-free mobility, and the need for improved surface coating technology. The market is segmented into various categories, including anodizing, plating, cleaning, polishing processes, and pre-treatment coatings. One of the significant trends in the metal surface protection chemical market is the increasing use of anodizing and plating techniques to enhance the corrosion protective properties of metals. Anodizing is an electrochemical process that creates a porous oxide layer on the metal surface, while plating involves depositing a thin layer of metal on the surface of another metal. In the automotive sector, metal treatment chemicals are used for vehicle parts, batteries, coaxial cables, cleats bolts, and machinery to enhance their performance and longevity.
Both techniques offer excellent corrosion resistance, wear resistance, and improved appearance. Another trend in the market is the development of membrane technology for metal finishing chemicals. Membrane technology enables the production of high-purity chemicals, which are essential for various applications, including electronics and electrical components. The metal surface protection chemical market comprises both international and local firms. The international firms dominate the market due to their extensive research and development capabilities and global presence. However, local firms offer competitive pricing and cater to the specific needs of regional markets. The metal surface protection chemical market caters to various industries, including automotive, aerospace, industrial machinery, electronics & electrical, construction, and transportation. In the automotive sector, metal surface protection chemicals are used to enhance the appearance and durability of automotive parts, such as engine components and body panels.
In the aerospace industry, these chemicals are used to protect the surfaces of aircraft from corrosive conditions during flight. In the electronics & electrical industry, metal surface protection chemicals are used to enhance the electrical properties of metals and improve their deterioration resistance. The metal surface protection chemical market is a dynamic and growing industry, driven by the increasing demand for corrosion-resistant metals, emissions-free mobility, and improved surface coating technology. The market is segmented into various categories, including anodizing, plating, cleaning, polishing processes, and pre-treatment coatings. The use of membrane technology for metal finishing chemicals is a significant trend in the market, offering high-purity chemicals for various applications. The market comprises both international and local firms, catering to various industries, including automotive, aerospace, industrial machinery, electronics & electrical, construction, and transportation.
|
Market Scope |
|
|
Report Coverage |
Details |
|
Page number |
213 |
|
Base year |
2023 |
|
Historic period |
2018-2022 |
|
Forecast period |
2024-2028 |
|
Growth momentum & CAGR |
Accelerate at a CAGR of 5.49% |
|
Market growth 2024-2028 |
USD 9.99 billion |
|
Market structure |
Fragmented |
|
YoY growth 2023-2024(%) |
5.21 |
|
Key countries |
US, China, India, UK, Mexico, and Germany |
|
Competitive landscape |
Leading Companies, Market Positioning of Companies, Competitive Strategies, and Industry Risks |
What are the Key Data Covered in this Metal Treatment Chemical Market Research and Growth Report?
- CAGR of the Metal Treatment Chemical industry during the forecast period
- Detailed information on factors that will drive the growth and forecasting between 2024 and 2028
- Precise estimation of the size of the market and its contribution of the industry in focus to the parent market
- Accurate predictions about upcoming growth and trends and changes in consumer behaviour
- Growth of the market across APAC, North America, Europe, South America, and Middle East and Africa
- Thorough analysis of the market's competitive landscape and detailed information about companies
- Comprehensive analysis of factors that will challenge the metal treatment chemical market growth of industry companies
We can help! Our analysts can customize this metal treatment chemical market research report to meet your requirements.


