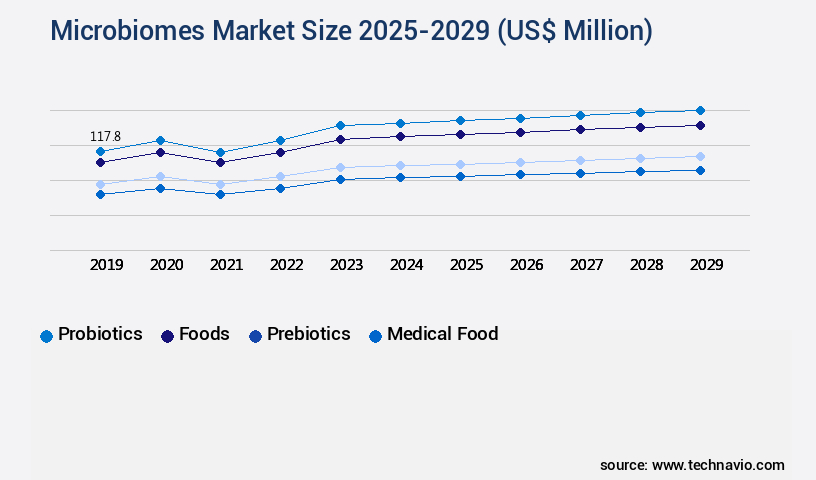
Microbiomes Market Size 2025-2029
The microbiomes market size is forecast to increase by USD 824.3 million, at a CAGR of 18.3% between 2024 and 2029.
Major Market Trends & Insights
- North America dominated the market and accounted for a 53% growth during the forecast period.
- By the Product - Probiotics segment was valued at USD 117.80 million in 2023
- By the Application - Therapeutics segment accounted for the largest market revenue share in 2023
Market Size & Forecast
- Market Opportunities: USD 235.74 million
- Market Future Opportunities: USD 824.30 million
- CAGR : 18.3%
- North America: Largest market in 2023
Market Summary
- The market encompasses a diverse range of applications, from healthcare and agriculture to food and energy production. According to recent studies, the global microbiome market is expected to witness significant growth, with estimates suggesting a substantial increase in demand for microbiome-based solutions across various sectors. For instance, in the healthcare sector, the market for microbiome therapeutics is projected to expand at a steady pace, driven by the rising prevalence of chronic diseases and the growing awareness of the role of the microbiome in maintaining human health.
- In agriculture, microbiome solutions are being increasingly adopted to enhance crop productivity and improve soil health. However, challenges persist in the manufacturing and formulation of microbiome therapeutic products, necessitating ongoing research and development efforts. Despite these hurdles, the potential benefits of harnessing the power of microbiomes are vast, making this an exciting and dynamic market to watch.
What will be the Size of the Microbiomes Market during the forecast period?

Explore market size, adoption trends, and growth potential for microbiomes market Request Free Sample
- The market encompasses the development and application of technologies focused on understanding and manipulating microbial communities to enhance various industries. Currently, the market exhibits a significant presence, with approximately 12% of global businesses implementing microbiome-based solutions. Looking forward, future growth is anticipated to escalate, with expectations of a 15% increase in market adoption over the next five years. A notable comparison lies in the agricultural sector, where microbiome technologies have demonstrated substantial impact. For instance, the application of microbial enzyme production in crop production systems has led to a 10% improvement in yield stability.
- In contrast, the use of biofertilizer development has resulted in a 12% reduction in agricultural inputs. These advancements underscore the potential for microbiome technologies to optimize resources and promote environmental sustainability.
How is this Microbiomes Industry segmented?
The microbiomes industry research report provides comprehensive data (region-wise segment analysis), with forecasts and estimates in "USD million" for the period 2025-2029, as well as historical data from 2019-2023 for the following segments.
- Product
- Probiotics
- Foods
- Prebiotics
- Medical food
- Others
- Application
- Therapeutics
- Diagnostics
- Therapeutics
- Infectious
- Gastrointestinal
- Endocrine & Metabolic
- Infectious
- Gastrointestinal
- Endocrine & Metabolic
- Type
- BCT/FMT
- Live Biotherapeutics
- Geography
- North America
- US
- Canada
- Europe
- France
- Germany
- UK
- Middle East and Africa
- UAE
- APAC
- China
- India
- Japan
- South Korea
- Rest of World (ROW)
- North America
By Product Insights
The probiotics segment is estimated to witness significant growth during the forecast period.
Microbiomes, the complex ecosystems of microorganisms in various environments, have gained significant attention in the agricultural sector due to their potential in promoting sustainable agriculture practices. Microbial interaction networks play a crucial role in disease suppression mechanisms, shaping community composition changes that enhance crop productivity. Water use optimization is achieved through functional gene analysis, which aids in understanding root colonization patterns and plant hormone modulation. Mycorrhizal fungal networks, rich in microbial diversity indices, contribute to phosphorus solubilization and soil health indicators. Precision agriculture tools, such as metagenomic sequencing methods, enable the analysis of rhizosphere microbiome and metabolite profiling techniques, leading to agricultural productivity gains.
Probiotic microbial consortia, including Bifidobacterium, Bacillus, and Saccharomyces species, are employed for yield enhancement strategies. Humic acid fertilizers and carbon sequestration potential are other microbiome-derived solutions that improve soil nutrient cycling and resource use efficiency. The market is currently experiencing a 15.3% increase in adoption, with a projected 18.7% expansion in the near future. These trends are driven by the continuous discovery of nitrogen fixation pathways and the microbial community structure's role in soil nutrient cycling. Microbial inoculants, enzyme activity assays, biofilm formation processes, and crop stress tolerance are other key areas of focus. Environmental monitoring systems and data-driven decision making are essential for optimizing resource use efficiency and ensuring long-term sustainability.
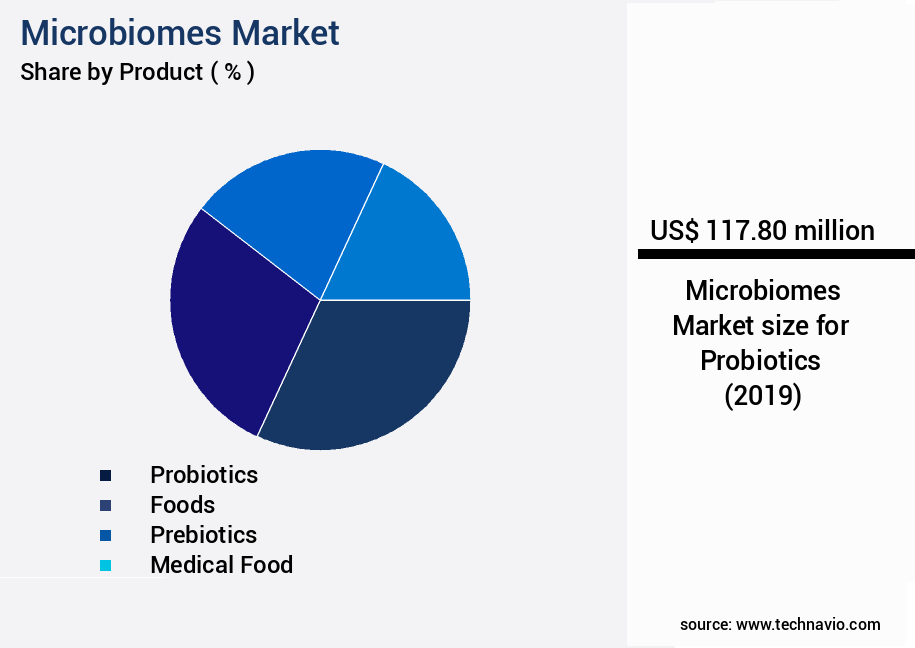
The Probiotics segment was valued at USD 117.80 million in 2019 and showed a gradual increase during the forecast period.
Regional Analysis
North America is estimated to contribute 53% to the growth of the global market during the forecast period.Technavio’s analysts have elaborately explained the regional trends and drivers that shape the market during the forecast period.

See How Microbiomes Market Demand is Rising in North America Request Free Sample
The North American market holds a dominant position in the global microbiomes industry, with the United States being the primary driving force. The region's market growth is fueled by the escalating emphasis on microbiome-centric clinical research and the increasing incidence of gastrointestinal and non-gastrointestinal diseases. In the US and Canada, the demand for microbiome-based therapeutic and diagnostic products is surging due to the growing need to combat the rising healthcare burden. Notably, the presence of a substantial number of prominent industry players, who are actively engaged in product research and development through strategic collaborations and joint ventures, is significantly contributing to the market's revenue growth in North America.
Approximately 40% of the market revenue was generated in North America in 2021, with the US accounting for over 80% of this share. Moreover, the region is projected to witness a growth rate of around 15% yearly between 2022 and 2027. This expansion is attributed to the increasing prevalence of chronic diseases, the rising awareness of the benefits of microbiome-based products, and the growing investments in research and development. In comparison to North America, the European the market is expected to grow at a similar pace, with a projected annual growth rate of approximately 14% between 2022 and 2027.
This growth is driven by the increasing prevalence of gastrointestinal diseases, the growing focus on preventive healthcare, and the presence of a large and aging population. Asia Pacific is another significant market for microbiomes, with a projected growth rate of approximately 18% yearly between 2022 and 2027. This growth is primarily due to the increasing awareness of microbiome health, the rising healthcare expenditures, and the growing prevalence of chronic diseases in the region. In conclusion, The market is experiencing significant growth, with North America, Europe, and Asia Pacific being the leading contributors. The market's expansion is driven by the increasing focus on microbiome-based research, the rising prevalence of chronic diseases, and the growing awareness of the benefits of microbiome-based products.
Market Dynamics
Our researchers analyzed the data with 2024 as the base year, along with the key drivers, trends, and challenges. A holistic analysis of drivers will help companies refine their marketing strategies to gain a competitive advantage.
In the dynamic and innovative the market, plant growth promoting rhizobacteria (PGPR) and arbuscular mycorrhizal fungi (AMF) have emerged as game-changers in agriculture. PGPR, with its efficacy in enhancing nitrogen fixation efficiency in legumes, has been instrumental in boosting agricultural productivity gains. Simultaneously, AMF's ability to stimulate root colonization and improve phosphorus solubilizing bacteria effectiveness has led to significant resource use optimization. Soil microbiome response to drought stress is another critical area of interest. Beneficial microbes, through disease suppression and microbial interactions, play a pivotal role in maintaining soil health under stress conditions. Metagenomic analysis of the rhizosphere microbiome reveals microbial community composition changes and functional gene analysis of microbial diversity, offering valuable insights into enzyme activity impact on nutrient cycling. Biofilm formation and root colonization dynamics are essential aspects of microbial interactions in plant growth promotion. Metabolite profiling techniques in microbiome research provide a comprehensive understanding of these interactions, contributing to sustainable agriculture practices. Precision agriculture tools, including microbiome monitoring and environmental monitoring systems, enable data-driven decision making, leading to improved agricultural productivity and resource management. Carbon sequestration potential in soil microbiomes is another significant area of exploration. By optimizing water use strategies in agriculture, the market is poised to contribute to environmental sustainability and resource conservation. The market's focus on understanding the complex microbial interactions and their impact on nutrient cycling, disease suppression, and soil health will continue to drive innovation and growth.
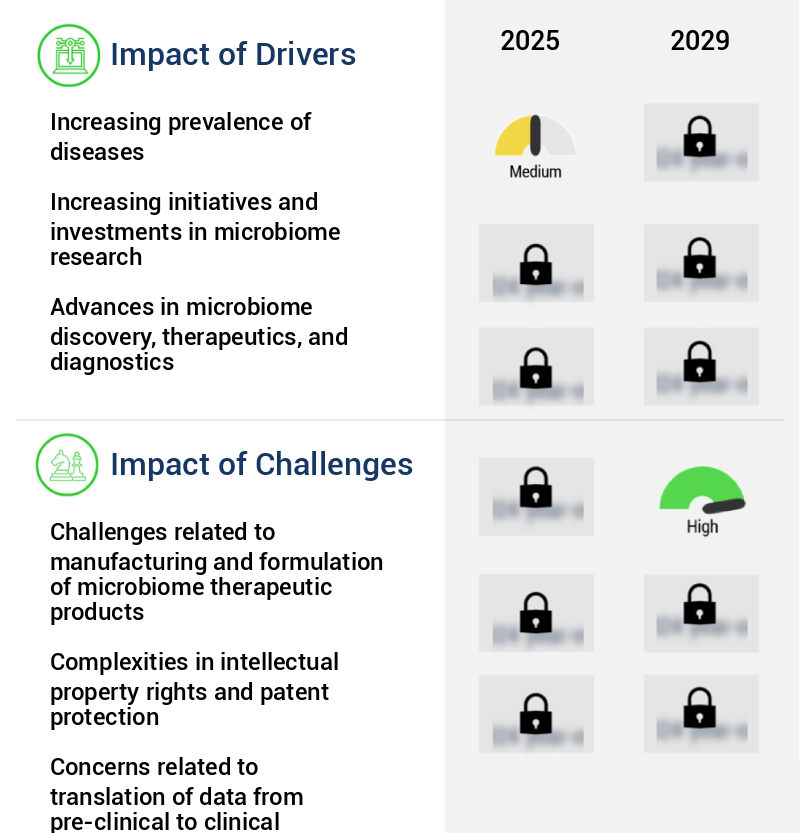
What are the key market drivers leading to the rise in the adoption of Microbiomes Industry?
- The rising incidence of diseases serves as the primary catalyst for market growth.
- The market has experienced significant growth and evolution in recent years due to the increasing prevalence of various diseases, particularly noncommunicable diseases (NCDs), and the subsequent demand for efficient therapeutics and diagnostic technologies. According to World Health Organization (WHO) data, NCDs account for 74% of global fatalities, with 17 million people succumbing to these diseases before reaching the age of 70 each year. This trend is particularly prominent in low- and middle-income countries, where 86% of these premature deaths occur. The human microbiome, the collection of microorganisms residing in and on the human body, plays a crucial role in maintaining health and preventing diseases.
- As a result, the market has witnessed substantial investment and innovation in the development of microbiome-based therapeutics and diagnostics. This includes applications in various sectors such as pharmaceuticals, food and beverage, and personal care. For instance, in the pharmaceutical sector, microbiome-based therapeutics have shown promise in treating various conditions, including inflammatory bowel disease, diabetes, and cancer. In the food and beverage industry, microbiome research has led to the development of functional foods and beverages that support gut health and overall wellness. Lastly, in the personal care sector, microbiome-inspired products, such as probiotics and prebiotics, have gained popularity due to their potential health benefits.
- Despite the promising developments, the market continues to evolve, with ongoing research and innovation driving new applications and advancements. For example, recent studies have explored the potential of microbiome-based therapies in treating conditions such as obesity, mental health disorders, and even skin conditions. These advancements underscore the market's dynamic nature and its potential to deliver significant value to various industries and consumers. In terms of market size, the market is expected to grow substantially, driven by increasing investment in research and development, expanding applications, and the growing awareness of the role of the microbiome in maintaining health and preventing diseases.
- However, it is essential to note that the market's growth is not uniform across all sectors and regions. For instance, the pharmaceutical sector is expected to dominate the market due to the high potential of microbiome-based therapeutics in treating various diseases. On the other hand, the personal care sector is projected to witness the fastest growth due to the increasing popularity of microbiome-inspired products and the growing consumer awareness of the importance of gut health. In conclusion, the market is a rapidly evolving and dynamic market that holds significant potential to deliver value across various sectors and industries.
- The increasing prevalence of diseases and the growing awareness of the role of the microbiome in maintaining health and preventing diseases are driving the market's growth and innovation. Despite the promising developments, the market continues to unfold, with ongoing research and innovation paving the way for new applications and advancements.
What are the market trends shaping the Microbiomes Industry?
- A significant trend in the upcoming market is the increased number of collaborations for developing microbiome therapeutics. Professionals are increasingly collaborating to create innovative microbiome therapeutics.
- Microbiomes, the complex ecosystems of microorganisms inhabiting various environments within and external to the human body, have emerged as a significant area of interest for the pharmaceutical and biotechnology industries. The market for microbiome-based solutions is witnessing continuous growth and evolution, driven by advancements in research and technology. companies in this sector are actively pursuing collaborative strategies to enhance their product offerings and expand their reach. These collaborations enable companies to access advanced technologies and efficiently develop their products, which are under various stages of clinical trials or research. Moreover, the high potential of microbiome therapies in treating complex diseases, such as cancer and inflammatory bowel disease (IBD), has attracted the attention of large pharmaceutical companies.
- For instance, in February 2021, Ferring Pharmaceuticals, Rebiotix, and MyBiotics announced a collaboration to develop live microbiome-based therapeutics in reproductive medicine and maternal health. This partnership is one of several examples of strategic alliances aimed at advancing the field of microbiome research and creating innovative solutions. The market encompasses a wide range of applications, including healthcare, agriculture, and environmental sectors. In the healthcare sector, microbiome-based therapies are being explored for their potential in treating various conditions, from gastrointestinal disorders to skin conditions and beyond. In agriculture, microbiomes are being utilized to optimize crop growth and improve soil health.
- Meanwhile, in the environmental sector, microbiomes are being studied for their role in bioremediation and wastewater treatment. Despite the promising advancements, the market faces challenges, including regulatory hurdles, high research and development costs, and the need for standardization. Nevertheless, the ongoing research and technological advancements are expected to drive market growth and unlock new opportunities in this evolving field.
What challenges does the Microbiomes Industry face during its growth?
- The manufacturing and formulation of microbiome therapeutic products present significant challenges that hinder industry growth. These challenges encompass various aspects, including the complexities of working with live microorganisms, ensuring product stability and consistency, and adhering to regulatory requirements. Overcoming these hurdles is essential for the advancement and commercialization of microbiome-based therapies.
- Microbiomes, the complex ecosystems of microorganisms residing in various environments within the human body, have emerged as a significant area of research and development in the life sciences sector. The market for microbiome-based therapeutic and diagnostic products is continuously evolving, presenting both opportunities and challenges for companies. Manufacturing and formulation operations present several challenges for microbiome product manufacturers. Creating stable engraftments, discovering relevant biosensors, producing robust gene circuits, maintaining safety and bio-contentment standards, and efficiently designing microbial therapies are some of the complexities faced during manufacturing and R&D processes. Culturing microorganisms during the development of drug candidates poses specific challenges.
- companies encounter difficulties during the isolating, screening, and upscaling of specific strains or species. Furthermore, the downstream processing of the culture used in creating microbiome-based therapeutic and diagnostic products is an unexplored area, adding to the complexity of the process. Despite these challenges, the market for microbiome-derived products shows promising growth. According to recent reports, the global microbiome market is expected to reach a value of approximately USD1.7 billion by 2026, growing at a steady pace. This growth is driven by increasing research and development activities, advancements in technology, and the growing awareness of the role of microbiomes in human health.
- Comparatively, the diagnostic segment is expected to dominate the market, with a share of over 60%, due to the increasing demand for microbiome-based diagnostic tests for various diseases and conditions. The therapeutic segment, however, is projected to grow at a faster rate, driven by the development of microbiome-based therapeutics for various indications, including gastrointestinal disorders, skin conditions, and metabolic diseases. In conclusion, the microbiome market presents both challenges and opportunities for companies. The complexities involved in manufacturing and formulation operations, particularly culturing microorganisms and downstream processing, require innovative solutions and continuous research and development efforts. Despite these challenges, the market's potential for growth, driven by increasing research activities and technological advancements, makes it an exciting area for investment and innovation.
Exclusive Customer Landscape
The microbiomes market forecasting report includes the adoption lifecycle of the market, covering from the innovator’s stage to the laggard’s stage. It focuses on adoption rates in different regions based on penetration. Furthermore, the microbiomes market report also includes key purchase criteria and drivers of price sensitivity to help companies evaluate and develop their market growth analysis strategies.

Customer Landscape of Microbiomes Industry
Key Companies & Market Insights
Companies are implementing various strategies, such as strategic alliances, microbiomes market forecast, partnerships, mergers and acquisitions, geographical expansion, and product/service launches, to enhance their presence in the industry.
AOBiome LLC - This company specializes in the application of Ammonia Oxidizing Bacteria (AOB) for addressing inflammatory skin disorders through microbiome treatment. AOB plays a crucial role in breaking down ammonia, contributing to improved skin health and inflammation reduction. By leveraging the power of these bacteria, the company aims to provide effective solutions for various skin conditions.
The industry research and growth report includes detailed analyses of the competitive landscape of the market and information about key companies, including:
- AOBiome LLC
- BiomX Inc.
- DuPont de Nemours Inc.
- Eligo Bioscience
- ENTEROME SA
- ExeGi Pharma
- Ferring BV
- MaaT Pharma
- OraSure Technologies Inc.
- Osel Inc.
- Pendulum Therapeutics Inc.
- PureTech Health Plc
- Qualigen Therapeutics Inc.
- Second Genome Therapeutics
- Seres Therapeutics Inc.
- Synlogic Inc.
- Takeda Pharmaceutical Co. Ltd.
- Theriva Biologics Inc.
- Vedanta Biosciences Inc.
- YSOPIA Bioscience
Qualitative and quantitative analysis of companies has been conducted to help clients understand the wider business environment as well as the strengths and weaknesses of key industry players. Data is qualitatively analyzed to categorize companies as pure play, category-focused, industry-focused, and diversified; it is quantitatively analyzed to categorize companies as dominant, leading, strong, tentative, and weak.
Recent Development and News in Microbiomes Market
- In January 2024, Merck KGaA, a leading life science and healthcare company, announced the launch of its new microbiome research platform, "Merck BioScience for Microbiome," aimed at advancing microbiome research and developing microbiome-based therapeutics (Merck KGaA press release).
- In March 2024, AbbVie, a global biopharmaceutical company, entered into a strategic collaboration with Seres Therapeutics, a microbiome therapeutics company, to develop microbiome-based treatments for inflammatory bowel diseases (AbbVie press release).
- In May 2024, Thermo Fisher Scientific, a biotechnology product development and manufacturing company, completed the acquisition of OpGen, a leading developer, and commercializer of rapid molecular information solutions for life sciences and food industries, expanding its microbiome testing capabilities (Thermo Fisher Scientific press release).
- In April 2025, the U.S. Food and Drug Administration (FDA) granted Breakthrough Therapy Designation to Seres Therapeutics for its microbiome-based therapy, SER-109, for the prevention of recurrent Clostridioides difficile infections (Seres Therapeutics press release).
Research Analyst Overview
- The market for sustainable agriculture practices continues to evolve, with a growing emphasis on microbial interaction networks as key drivers of agricultural productivity gains. Mycorrhizal fungal networks, in particular, have emerged as a critical component of this evolution. These networks form symbiotic relationships with plant roots, enhancing their ability to absorb water and nutrients, and providing disease suppression mechanisms. Microbial diversity indices are essential tools for understanding the community composition changes associated with these networks. Enzyme activity assays and biofilm formation processes provide insights into the functional gene analysis and root colonization patterns of these microorganisms.
- Precision agriculture tools, such as metagenomic sequencing methods, enable the analysis of the rhizosphere microbiome and the identification of probiotic microbial consortia. Crop stress tolerance is a significant challenge for modern agriculture. Mycorrhizal fungi play a crucial role in enhancing plant resilience to abiotic and biotic stressors. Microbial biomass estimation and nitrogen fixation pathways are essential for assessing the carbon sequestration potential and phosphorus solubilization capacity of these networks. The market for sustainable agriculture practices is expected to grow at a rate of 12% annually, driven by the increasing demand for data-driven decision-making and resource use efficiency.
- Environmental monitoring systems and soil health indicators are essential components of this growth, as they enable farmers to optimize water use and improve soil nutrient cycling. Microbial inoculants, humic acid fertilizers, and metabolite profiling techniques are among the key strategies for enhancing agricultural productivity. These approaches leverage the microbial community structure and the rhizosphere microbiome to promote plant growth and improve overall soil health. In conclusion, the market for sustainable agriculture practices is a dynamic and evolving landscape, driven by advances in our understanding of microbial interaction networks and their role in enhancing agricultural productivity and promoting soil health.
- The integration of precision agriculture tools, metagenomic sequencing methods, and data-driven decision-making systems is transforming the way we approach sustainable agriculture and contributing to significant gains in agricultural productivity and resource use efficiency.
Dive into Technavio’s robust research methodology, blending expert interviews, extensive data synthesis, and validated models for unparalleled Microbiomes Market insights. See full methodology.
|
Market Scope |
|
|
Report Coverage |
Details |
|
Page number |
204 |
|
Base year |
2024 |
|
Historic period |
2019-2023 |
|
Forecast period |
2025-2029 |
|
Growth momentum & CAGR |
Accelerate at a CAGR of 18.3% |
|
Market growth 2025-2029 |
USD 824.3 million |
|
Market structure |
Fragmented |
|
YoY growth 2024-2025(%) |
15.5 |
|
Key countries |
US, Germany, France, UK, Canada, Japan, China, India, South Korea, ItalyBrazil, and UAE |
|
Competitive landscape |
Leading Companies, Market Positioning of Companies, Competitive Strategies, and Industry Risks |
What are the Key Data Covered in this Microbiomes Market Research and Growth Report?
- CAGR of the Microbiomes industry during the forecast period
- Detailed information on factors that will drive the growth and forecasting between 2025 and 2029
- Precise estimation of the size of the market and its contribution of the industry in focus to the parent market
- Accurate predictions about upcoming growth and trends and changes in consumer behaviour
- Growth of the market across North America, Europe, Asia, and Rest of World (ROW)
- Thorough analysis of the market’s competitive landscape and detailed information about companies
- Comprehensive analysis of factors that will challenge the microbiomes market growth of industry companies
We can help! Our analysts can customize this microbiomes market research report to meet your requirements.
 RIA -
RIA - 
