Milking Robot Market Analysis Europe, North America, APAC, South America, Middle East and Africa - US, Germany, China, UK, Canada - Size and Forecast 2024-2028

Milking Robot Market Analysis Europe, North America, APAC, South America, Middle East and Africa - US, Germany, China, UK, Canada - Size and Forecast 2024-2028

Published: May 2024 165 Pages SKU: IRTNTR44346

Market Overview at a Glance

$743.2 Mn
Market Opportunity
8.9%
CAGR
7.98
YoY growth 2023-2024(%)

Milking Robot Market Size 2024-2028 

The milking robot market size is forecast to increase by USD 743.2 million at a CAGR of 8.9% between 2023 and 2028.

  • Dairy owners continue to explore automation in milking operations, with milking robots gaining popularity due to their efficiency and ability to monitor milk quality in real-time through SCC sensors. The dairy industry's focus on producing high-quality dairy commodities, such as milk and dairy products, with optimal nutritional properties drives this trend. Milking robots are particularly beneficial for large-scale operations, including multi-stall units and rotary milking systems. However, their high initial investment and ongoing maintenance costs are primary challenges. The beverage industries' increasing demand for milk and milk products further fuels the market's growth. Milking robots' advanced sensors and automation capabilities contribute to improving milk quality and reducing labor requirements, making them an attractive investment for dairy farmers.

What will be the Size of the Milking Robot Market During the Forecast Period?

Milking Robot Market Size

 Request Free Sample

  • The market is witnessing significant growth due to the increasing demand for automation in livestock farming. Milking robots are becoming increasingly popular among dairy farmers as they offer numerous benefits, including improved milk quality, enhanced herd welfare, and increased farm efficiency. Hardware components and control devices are the essential elements of milking robots. These systems use advanced sensors and actuators to monitor cow behavior and milk production. The integration of cloud-based software solutions and on-premise software allows farmers to monitor and analyze milk production data in real-time, enabling them to make informed decisions and optimize their operations. Connectivity services play a crucial role in the effective functioning of milking robots. These services ensure seamless communication between the robots and the cloud or on-premise software, allowing farmers to access critical data from anywhere, at any time. System integration services and consulting services are also essential to ensure the successful implementation of milking robot systems. Milking robots are not limited to dairy cattle; they are also used in goat and sheep farming.
  • Furthermore, these systems can cater to large herds and free-stall systems, making them a versatile solution for various livestock farming operations. Milking robots offer several advantages, including improved milk quality due to better hygiene and cow comfort. They also help in monitoring herd movement, udder size, and milk yield, enabling farmers to optimize their milk production. Furthermore, these systems can detect behavioral differences in cows, allowing farmers to identify potential health issues early and take corrective measures. The installation costs of milking robots may be high initially, but the long-term benefits, including increased milk production, improved cow welfare, and enhanced farm efficiency, make them a worthwhile investment for dairy farmers. In conclusion, the market is witnessing steady growth due to the increasing demand for automation in livestock farming. These systems offer numerous benefits, including improved milk quality, enhanced herd welfare, and increased farm efficiency. With the integration of advanced sensors, software solutions, and connectivity services, milking robots are set to revolutionize the dairy industry.

How is this market segmented and which is the largest segment?

The market research report provides comprehensive data (region-wise segment analysis), with forecasts and estimates in "USD million" for the period 2024-2028, as well as historical data from 2018-2022 for the following segments.

  • Product
    • Standalone units
    • Multiple store units
    • Rotary units
  • Component
    • Hardware
    • Software
    • Services
  • Geography
    • Europe
      • Germany
      • UK
    • North America
      • Canada
      • US
    • APAC
      • China
    • South America
    • Middle East and Africa

By Product Insights

  • The standalone units segment is estimated to witness significant growth during the forecast period.

In the dairy farming industry, milking robots have gained significant traction for operational purposes, particularly in the form of standalone units or single-stall systems. These robots offer several advantages, including cost savings on labor and adaptability to various production schedules. The lower installation and maintenance costs, as well as the flexibility to be installed without extensive barn modifications, make standalone milking robots an attractive option for many North American and European dairy farmers. With the ability to milk approximately 65-70 individual dairy animals multiple times a day, these systems streamline the production process while maintaining the well-being of the cows and steers. The electrical conductivity technology employed in these robots ensures efficient milk collection and allows for the gathering of valuable cow rumination data, further enhancing the overall efficiency of the dairy operation. The adoption of milking robots contributes significantly to the market growth, as they offer a cost-effective and adaptable solution for dairy farmers.

Milking Robot Market Size

Get a glance at the market report of share of various segments Request Free Sample

The standalone units segment was valued at USD 456.90 million in 2018 and showed a gradual increase during the forecast period.

Regional Analysis

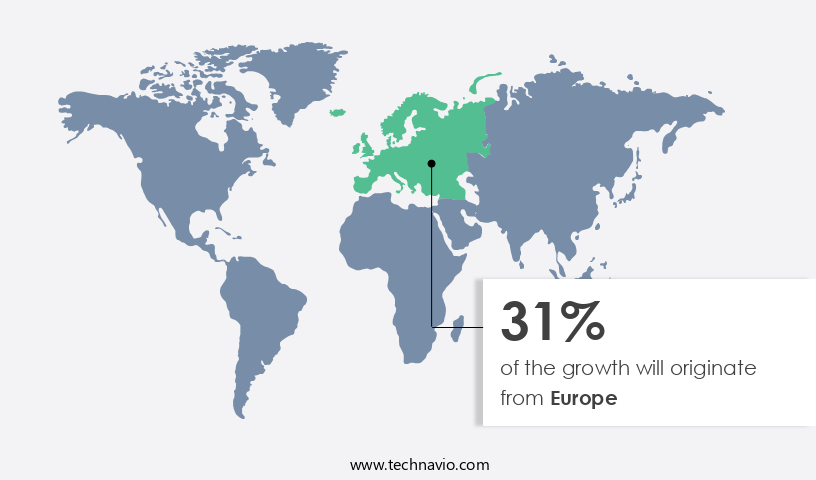
  • Europe is estimated to contribute 31% to the growth of the global market during the forecast period.

Technavio's analysts have elaborately explained the regional trends and drivers that shape the market during the forecast period.

Milking Robot Market Share by Geography

For more insights on the market share of various regions, Request Free Sample

The European dairy industry has witnessed significant growth, with key contributors being Denmark, the Netherlands, and the UK. This expansion can be attributed to the implementation of automation in various farming applications and supportive government initiatives. In the upcoming years, there is a projected demand for milking robots in countries like Switzerland, Germany, and France. These nations are anticipated to be significant contributors to the global dairy market. Germany, as a leading milk and dairy product producer in Europe, will likely see the adoption of milking robots to enhance production efficiency.

Furthermore, the northern and upland regions of Germany, including the Central Uplands and the Alps, are home to numerous dairy farms. These farms, situated in marshy lands and uplands, will benefit from the integration of milking robots to optimize their production processes. Hardware components and control devices are essential elements of milking robots. Cloud-based software solutions and on-premise software offerings, along with connectivity services, system integration, consulting, and managed services, are integral to the effective operation of these systems. The European market for milking robots is expected to experience steady growth due to the increasing focus on automation in livestock farming and the need for improved productivity.

Market Dynamics

Our milking robot market researchers analyzed the data with 2023 as the base year, along with the key drivers, trends, and challenges. A holistic analysis of drivers will help companies refine their marketing strategies to gain a competitive advantage.

What are the key market drivers leading to the rise in adoption of Milking Robot Market?

The adoption of technologies to combat skill shortages is the key driver of the market.

  • In the dairy industry, maximizing daily milk production is essential for increasing profits. Robotic milking systems, such as multiple stalls and rotary units, offer a productivity advantage of 5%-10% compared to traditional milking methods that rely on human labor. These robotic systems can process several animals at once, thereby improving efficiency and milk yield.
  • With lower labor requirements, dairy farms are increasingly adopting automated milking processes. Milk production and labor costs are significant expenses for dairy businesses, and optimizing these expenditures can lead to profitable outcomes. Dairy farms that invest in milking robots can enhance their productivity and output, ultimately reflecting greater profits.

What are the market trends shaping the Milking Robot Market?

Improvement in sensors used in milking robots is the upcoming trend in the market.

  • During the forecast period, dairy owners will incorporate advanced sensors into milking robots to maintain the quality of raw milk and prevent abnormal milk from entering the collection system. Abnormal milk, which originates from infected or sick animals and may contain harmful antigens, poses a significant risk to dairy commodities and the production of dairy products with desirable nutritional properties.
  • Traditionally, farmers have relied on manual inspections during udder and teat preparation to assess milk quality. However, the adoption of milking robots equipped with smart sensors is expected to increase. These sensors will analyze milk quality, specifically focusing on conductivity, composition, and cell counts, to identify any abnormalities. This innovation will contribute to the production of superior milk and milk products for the beverage industries.

What challenges does Milking Robot Market face during the growth?

The disadvantages of milking robots is a key challenge affecting the market growth.

  • Milking robots offer numerous benefits to the dairy industry, including increased productivity and improved herd health. However, there are certain challenges associated with their implementation. One such challenge is the potential impact on cow throughput due to the physical characteristics of the animal, such as an udder of unusual size. This issue can lead to reduced efficiency and increased time spent on milking. Moreover, activities such as manure scraping and hoof trimming, which are necessary for maintaining a healthy herd, can slow down the cow's movement through the milking robot. The training process for cows to become accustomed to the robot can also be time-consuming and labor-intensive.
  • Additionally, the cost of replacing parts, such as lasers and hydraulic arms, can be substantial. Milking robots are complex systems that require regular maintenance and support from manufacturers, leading to high operating costs. Despite these challenges, the dairy industry continues to invest in milking robots for large herds in free stall, loose housing systems, and pasture-based dairying.

Exclusive Customer Landscape

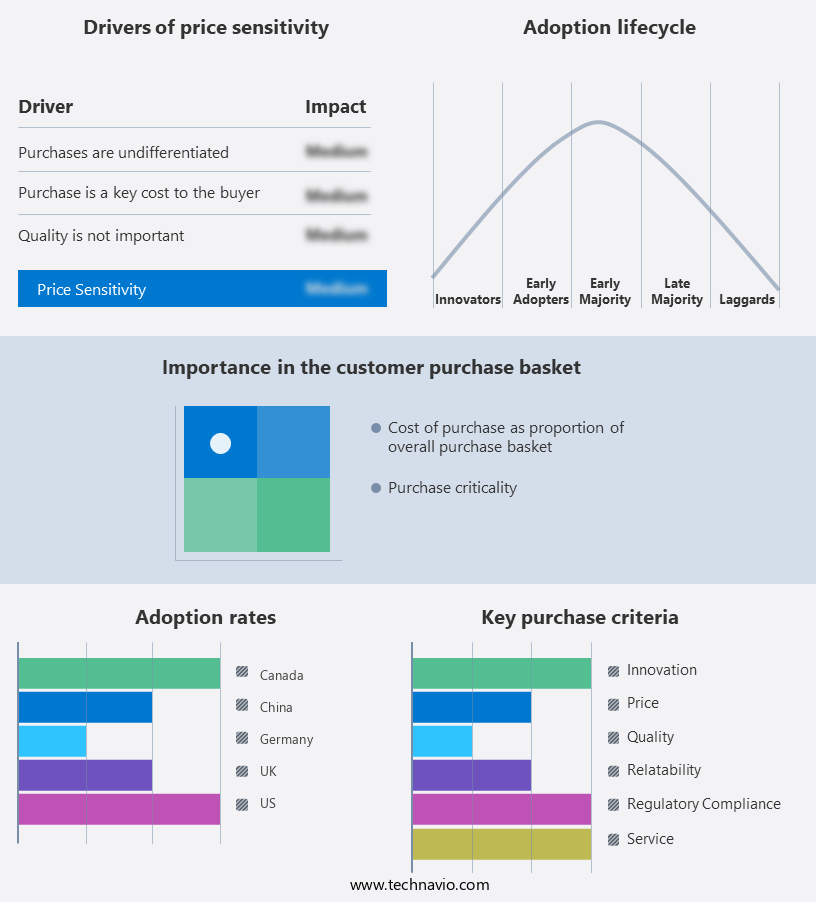
The milking robot market forecasting report includes the adoption lifecycle of the market, covering from the innovator's stage to the laggard's stage. It focuses on adoption rates in different regions based on penetration. Furthermore, the market report also includes key purchase criteria and drivers of price sensitivity to help companies evaluate and develop their market growth analysis strategies.

Milking Robot Market Share by Geography

 Customer Landscape

Key Companies & Market Insights

Companies are implementing various strategies, such as strategic alliances, market forecast, partnerships, mergers and acquisitions, geographical expansion, and product/service launches, to enhance their presence in the market. The milking robot market research and growth report includes detailed analyses of the competitive landscape of the market and information about key companies, including:

  • Afimilk Ltd.
  • Allflex Group
  • AMS Galaxy USA
  • Dairymaster
  • Fabdec Ltd.
  • Fullwood Ltd.
  • GEA Group AG
  • Hokofarm Group
  • Lely International NV
  • Livestock Improvement Corp. Ltd.
  • Madison One Holdings LLC
  • Milkplan SA
  • Milkwell Milking Systems
  • Read Industrial Ltd.
  • S.A. Christensen and Co.
  • System Happel GmbH
  • Tetra Laval SA
  • Waikato Milking Systems LP

Qualitative and quantitative analysis of companies has been conducted to help clients understand the wider business environment as well as the strengths and weaknesses of key market players. Data is qualitatively analyzed to categorize companies as pure play, category-focused, industry-focused, and diversified; it is quantitatively analyzed to categorize companies as dominant, leading, strong, tentative, and weak.

Research Analyst Overview

The market is witnessing significant growth due to the automation of livestock farms and the adoption of advanced technologies in dairy farming. Milking robot systems are becoming increasingly popular among farmers and dairy owners for their ability to improve milk production, milk quality, and herd welfare. These systems utilize hardware components such as control devices and sensors, including SCC monitor sensors, to ensure optimal milking operations. Cloud-based software solutions and on-premise software offerings provide real-time monitoring and analysis of milk production, herd management, and cow behavior.

Furthermore, connectivity services and system integration services enable seamless integration of these systems with other farm management tools. Consulting services, managed services, and assisted professional services offerings provide farmers with expert guidance on the installation and operation of milking robot systems. Milking robot systems are suitable for various dairy segments, including large herds in free stall and loose housing systems, as well as smaller herds in pasture-based dairying. Primary factors driving the market include labor cost reduction, time adaptability, and the need for high-level analysis to make important decisions in the dairy industry.

However, small herd sizes and training requirements can act as primary impediments to the adoption of milking robot systems. The market is expected to see strategic possibilities for growth in the form of automation technologies, herd management, and dairy farm management. Milking robot systems are also finding applications in goat and sheep farming, further expanding their market reach. The availability of products and economic downturns can impact market growth, while trade regulations and shipping delays may pose challenges. Intelligence services can help farmers make informed decisions and minimize loss expenditures.

Milking Robot Market Scope

Report Coverage

Details

Page number

165

Base year

2023

Historic period

2018-2022

Forecast period

2024-2028

Growth momentum & CAGR

Accelerate at a CAGR of 8.9%

Market growth 2024-2028

USD 743.2 million

Market structure

Fragmented

YoY growth 2023-2024(%)

7.98

Key countries

US, Germany, China, UK, and Canada

Competitive landscape

Leading Companies, Market Positioning of Companies, Competitive Strategies, and Industry Risks

Request Free Sample

What are the Key Data Covered in this Market Research and Growth Report?

  • CAGR of the market during the forecast period
  • Detailed information on factors that will drive the market growth and forecasting between 2024 and 2028
  • Precise estimation of the size of the market  and its contribution of the market in focus to the parent market
  • Accurate predictions about upcoming market growth and trends and changes in consumer behaviour
  • Growth of the market across Europe, North America, APAC, South America, and Middle East and Africa
  • Thorough analysis of the market's competitive landscape and detailed information about companies
  • Comprehensive analysis of factors that will challenge the growth of market companies

We can help! Our analysts can customize this market research report to meet your requirements. Get in touch

1 Executive Summary

  • 1.1 Market overview
    • Executive Summary - Chart on Market Overview
    • Executive Summary - Data Table on Market Overview
    • Executive Summary - Chart on Global Market Characteristics
    • Executive Summary - Chart on Market by Geography
    • Executive Summary - Chart on Market Segmentation by Product
    • Executive Summary - Chart on Market Segmentation by Component
    • Executive Summary - Chart on Incremental Growth
    • Executive Summary - Data Table on Incremental Growth
    • Executive Summary - Chart on Company Market Positioning

2 Market Landscape

  • 2.1 Market ecosystem
    • Parent Market
    • Data Table on - Parent Market
  • 2.2 Market characteristics
    • Market characteristics analysis
  • 2.3 Value chain analysis
    • Value Chain Analysis

3 Market Sizing

  • 3.1 Market definition
    • Offerings of companies included in the market definition
  • 3.2 Market segment analysis
    • Market segments
  • 3.3 Market size 2023
    • 3.4 Market outlook: Forecast for 2023-2028
      • Chart on Global - Market size and forecast 2023-2028 ($ million)
      • Data Table on Global - Market size and forecast 2023-2028 ($ million)
      • Chart on Global Market: Year-over-year growth 2023-2028 (%)
      • Data Table on Global Market: Year-over-year growth 2023-2028 (%)

    4 Historic Market Size

    • 4.1 Global Milking Robot Market 2018 - 2022
      • Historic Market Size - Data Table on Global Milking Robot Market 2018 - 2022 ($ million)
    • 4.2 Product segment analysis 2018 - 2022
      • Historic Market Size - Product Segment 2018 - 2022 ($ million)
    • 4.3 Component segment analysis 2018 - 2022
      • Historic Market Size - Component Segment 2018 - 2022 ($ million)
    • 4.4 Geography segment analysis 2018 - 2022
      • Historic Market Size - Geography Segment 2018 - 2022 ($ million)
    • 4.5 Country segment analysis 2018 - 2022
      • Historic Market Size - Country Segment 2018 - 2022 ($ million)

    5 Five Forces Analysis

    • 5.1 Five forces summary
      • Five forces analysis - Comparison between 2023 and 2028
    • 5.2 Bargaining power of buyers
      • Bargaining power of buyers - Impact of key factors 2023 and 2028
    • 5.3 Bargaining power of suppliers
      • Bargaining power of suppliers - Impact of key factors in 2023 and 2028
    • 5.4 Threat of new entrants
      • Threat of new entrants - Impact of key factors in 2023 and 2028
    • 5.5 Threat of substitutes
      • Threat of substitutes - Impact of key factors in 2023 and 2028
    • 5.6 Threat of rivalry
      • Threat of rivalry - Impact of key factors in 2023 and 2028
    • 5.7 Market condition
      • Chart on Market condition - Five forces 2023 and 2028

    6 Market Segmentation by Product

    • 6.1 Market segments
      • Chart on Product - Market share 2023-2028 (%)
      • Data Table on Product - Market share 2023-2028 (%)
    • 6.2 Comparison by Product
      • Chart on Comparison by Product
      • Data Table on Comparison by Product
    • 6.3 Standalone units - Market size and forecast 2023-2028
      • Chart on Standalone units - Market size and forecast 2023-2028 ($ million)
      • Data Table on Standalone units - Market size and forecast 2023-2028 ($ million)
      • Chart on Standalone units - Year-over-year growth 2023-2028 (%)
      • Data Table on Standalone units - Year-over-year growth 2023-2028 (%)
    • 6.4 Multiple store units - Market size and forecast 2023-2028
      • Chart on Multiple store units - Market size and forecast 2023-2028 ($ million)
      • Data Table on Multiple store units - Market size and forecast 2023-2028 ($ million)
      • Chart on Multiple store units - Year-over-year growth 2023-2028 (%)
      • Data Table on Multiple store units - Year-over-year growth 2023-2028 (%)
    • 6.5 Rotary units - Market size and forecast 2023-2028
      • Chart on Rotary units - Market size and forecast 2023-2028 ($ million)
      • Data Table on Rotary units - Market size and forecast 2023-2028 ($ million)
      • Chart on Rotary units - Year-over-year growth 2023-2028 (%)
      • Data Table on Rotary units - Year-over-year growth 2023-2028 (%)
    • 6.6 Market opportunity by Product
      • Market opportunity by Product ($ million)
      • Data Table on Market opportunity by Product ($ million)

    7 Market Segmentation by Component

    • 7.1 Market segments
      • Chart on Component - Market share 2023-2028 (%)
      • Data Table on Component - Market share 2023-2028 (%)
    • 7.2 Comparison by Component
      • Chart on Comparison by Component
      • Data Table on Comparison by Component
    • 7.3 Hardware - Market size and forecast 2023-2028
      • Chart on Hardware - Market size and forecast 2023-2028 ($ million)
      • Data Table on Hardware - Market size and forecast 2023-2028 ($ million)
      • Chart on Hardware - Year-over-year growth 2023-2028 (%)
      • Data Table on Hardware - Year-over-year growth 2023-2028 (%)
    • 7.4 Software - Market size and forecast 2023-2028
      • Chart on Software - Market size and forecast 2023-2028 ($ million)
      • Data Table on Software - Market size and forecast 2023-2028 ($ million)
      • Chart on Software - Year-over-year growth 2023-2028 (%)
      • Data Table on Software - Year-over-year growth 2023-2028 (%)
    • 7.5 Services - Market size and forecast 2023-2028
      • Chart on Services - Market size and forecast 2023-2028 ($ million)
      • Data Table on Services - Market size and forecast 2023-2028 ($ million)
      • Chart on Services - Year-over-year growth 2023-2028 (%)
      • Data Table on Services - Year-over-year growth 2023-2028 (%)
    • 7.6 Market opportunity by Component
      • Market opportunity by Component ($ million)
      • Data Table on Market opportunity by Component ($ million)

    8 Customer Landscape

    • 8.1 Customer landscape overview
      • Analysis of price sensitivity, lifecycle, customer purchase basket, adoption rates, and purchase criteria

    9 Geographic Landscape

    • 9.1 Geographic segmentation
      • Chart on Market share by geography 2023-2028 (%)
      • Data Table on Market share by geography 2023-2028 (%)
    • 9.2 Geographic comparison
      • Chart on Geographic comparison
      • Data Table on Geographic comparison
    • 9.3 Europe - Market size and forecast 2023-2028
      • Chart on Europe - Market size and forecast 2023-2028 ($ million)
      • Data Table on Europe - Market size and forecast 2023-2028 ($ million)
      • Chart on Europe - Year-over-year growth 2023-2028 (%)
      • Data Table on Europe - Year-over-year growth 2023-2028 (%)
    • 9.4 North America - Market size and forecast 2023-2028
      • Chart on North America - Market size and forecast 2023-2028 ($ million)
      • Data Table on North America - Market size and forecast 2023-2028 ($ million)
      • Chart on North America - Year-over-year growth 2023-2028 (%)
      • Data Table on North America - Year-over-year growth 2023-2028 (%)
    • 9.5 APAC - Market size and forecast 2023-2028
      • Chart on APAC - Market size and forecast 2023-2028 ($ million)
      • Data Table on APAC - Market size and forecast 2023-2028 ($ million)
      • Chart on APAC - Year-over-year growth 2023-2028 (%)
      • Data Table on APAC - Year-over-year growth 2023-2028 (%)
    • 9.6 South America - Market size and forecast 2023-2028
      • Chart on South America - Market size and forecast 2023-2028 ($ million)
      • Data Table on South America - Market size and forecast 2023-2028 ($ million)
      • Chart on South America - Year-over-year growth 2023-2028 (%)
      • Data Table on South America - Year-over-year growth 2023-2028 (%)
    • 9.7 Middle East and Africa - Market size and forecast 2023-2028
      • Chart on Middle East and Africa - Market size and forecast 2023-2028 ($ million)
      • Data Table on Middle East and Africa - Market size and forecast 2023-2028 ($ million)
      • Chart on Middle East and Africa - Year-over-year growth 2023-2028 (%)
      • Data Table on Middle East and Africa - Year-over-year growth 2023-2028 (%)
    • 9.8 US - Market size and forecast 2023-2028
      • Chart on US - Market size and forecast 2023-2028 ($ million)
      • Data Table on US - Market size and forecast 2023-2028 ($ million)
      • Chart on US - Year-over-year growth 2023-2028 (%)
      • Data Table on US - Year-over-year growth 2023-2028 (%)
    • 9.9 China - Market size and forecast 2023-2028
      • Chart on China - Market size and forecast 2023-2028 ($ million)
      • Data Table on China - Market size and forecast 2023-2028 ($ million)
      • Chart on China - Year-over-year growth 2023-2028 (%)
      • Data Table on China - Year-over-year growth 2023-2028 (%)
    • 9.10 Germany - Market size and forecast 2023-2028
      • Chart on Germany - Market size and forecast 2023-2028 ($ million)
      • Data Table on Germany - Market size and forecast 2023-2028 ($ million)
      • Chart on Germany - Year-over-year growth 2023-2028 (%)
      • Data Table on Germany - Year-over-year growth 2023-2028 (%)
    • 9.11 UK - Market size and forecast 2023-2028
      • Chart on UK - Market size and forecast 2023-2028 ($ million)
      • Data Table on UK - Market size and forecast 2023-2028 ($ million)
      • Chart on UK - Year-over-year growth 2023-2028 (%)
      • Data Table on UK - Year-over-year growth 2023-2028 (%)
    • 9.12 Canada - Market size and forecast 2023-2028
      • Chart on Canada - Market size and forecast 2023-2028 ($ million)
      • Data Table on Canada - Market size and forecast 2023-2028 ($ million)
      • Chart on Canada - Year-over-year growth 2023-2028 (%)
      • Data Table on Canada - Year-over-year growth 2023-2028 (%)
    • 9.13 Market opportunity by geography
      • Market opportunity by geography ($ million)
      • Data Tables on Market opportunity by geography ($ million)

    10 Drivers, Challenges, and Opportunity/Restraints

    • 10.1 Market drivers
      • 10.2 Market challenges
        • 10.3 Impact of drivers and challenges
          • Impact of drivers and challenges in 2023 and 2028
        • 10.4 Market opportunities/restraints

          11 Competitive Landscape

          • 11.1 Overview
            • 11.2 Competitive Landscape
              • Overview on criticality of inputs and factors of differentiation
            • 11.3 Landscape disruption
              • Overview on factors of disruption
            • 11.4 Industry risks
              • Impact of key risks on business

            12 Competitive Analysis

            • 12.1 Companies profiled
              • Companies covered
            • 12.2 Market positioning of companies
              • Matrix on companies position and classification
            • 12.3 Afimilk Ltd.
              • Afimilk Ltd. - Overview
              • Afimilk Ltd. - Product / Service
              • Afimilk Ltd. - Key offerings
            • 12.4 Allflex Group
              • Allflex Group - Overview
              • Allflex Group - Product / Service
              • Allflex Group - Key offerings
            • 12.5 AMS Galaxy USA
              • AMS Galaxy USA - Overview
              • AMS Galaxy USA - Product / Service
              • AMS Galaxy USA - Key offerings
            • 12.6 Dairymaster
              • Dairymaster - Overview
              • Dairymaster - Product / Service
              • Dairymaster - Key offerings
            • 12.7 Fabdec Ltd.
              • Fabdec Ltd. - Overview
              • Fabdec Ltd. - Product / Service
              • Fabdec Ltd. - Key offerings
            • 12.8 Fullwood Ltd.
              • Fullwood Ltd. - Overview
              • Fullwood Ltd. - Product / Service
              • Fullwood Ltd. - Key offerings
            • 12.9 GEA Group AG
              • GEA Group AG - Overview
              • GEA Group AG - Business segments
              • GEA Group AG - Key news
              • GEA Group AG - Key offerings
              • GEA Group AG - Segment focus
            • 12.10 Hokofarm Group
              • Hokofarm Group - Overview
              • Hokofarm Group - Product / Service
              • Hokofarm Group - Key offerings
            • 12.11 Lely International NV
              • Lely International NV - Overview
              • Lely International NV - Product / Service
              • Lely International NV - Key offerings
            • 12.12 Livestock Improvement Corp. Ltd.
              • Livestock Improvement Corp. Ltd. - Overview
              • Livestock Improvement Corp. Ltd. - Business segments
              • Livestock Improvement Corp. Ltd. - Key offerings
              • Livestock Improvement Corp. Ltd. - Segment focus
            • 12.13 Madison One Holdings LLC
              • Madison One Holdings LLC - Overview
              • Madison One Holdings LLC - Product / Service
              • Madison One Holdings LLC - Key offerings
            • 12.14 Milkplan SA
              • Milkplan SA - Overview
              • Milkplan SA - Product / Service
              • Milkplan SA - Key offerings
            • 12.15 Milkwell Milking Systems
              • Milkwell Milking Systems - Overview
              • Milkwell Milking Systems - Product / Service
              • Milkwell Milking Systems - Key offerings
            • 12.16 Read Industrial Ltd.
              • Read Industrial Ltd. - Overview
              • Read Industrial Ltd. - Product / Service
              • Read Industrial Ltd. - Key offerings
            • 12.17 S.A. Christensen and Co.
              • S.A. Christensen and Co. - Overview
              • S.A. Christensen and Co. - Product / Service
              • S.A. Christensen and Co. - Key offerings

            13 Appendix

            • 13.1 Scope of the report
              • 13.2 Inclusions and exclusions checklist
                • Inclusions checklist
                • Exclusions checklist
              • 13.3 Currency conversion rates for US$
                • Currency conversion rates for US$
              • 13.4 Research methodology
                • Research methodology
              • 13.5 Data procurement
                • Information sources
              • 13.6 Data validation
                • Data validation
              • 13.7 Validation techniques employed for market sizing
                • Validation techniques employed for market sizing
              • 13.8 Data synthesis
                • Data synthesis
              • 360 degree market analysis
                • 360 degree market analysis
              • 13.10 List of abbreviations
                • List of abbreviations

              Research Methodology

              Technavio presents a detailed picture of the market by way of study, synthesis, and summation of data from multiple sources. The analysts have presented the various facets of the market with a particular focus on identifying the key industry influencers. The data thus presented is comprehensive, reliable, and the result of extensive research, both primary and secondary.

              INFORMATION SOURCES

              Primary sources

              • Manufacturers and suppliers
              • Channel partners
              • Industry experts
              • Strategic decision makers

              Secondary sources

              • Industry journals and periodicals
              • Government data
              • Financial reports of key industry players
              • Historical data
              • Press releases

              DATA ANALYSIS

              Data Synthesis

              • Collation of data
              • Estimation of key figures
              • Analysis of derived insights

              Data Validation

              • Triangulation with data models
              • Reference against proprietary databases
              • Corroboration with industry experts

              REPORT WRITING

              Qualitative

              • Market drivers
              • Market challenges
              • Market trends
              • Five forces analysis

              Quantitative

              • Market size and forecast
              • Market segmentation
              • Geographical insights
              • Competitive landscape

              Interested in this report?

              Get your sample now to see our research methodology and insights!

              Download Now

              Frequently Asked Questions

              Milking Robot market growth will increase by $ 743.2 mn during 2024-2028.

              The Milking Robot market is expected to grow at a CAGR of 8.9% during 2024-2028.

              Milking Robot market is segmented by Product( Standalone units, Multiple store units, Rotary units) Component( Hardware, Software, Services, South America, MEA)

              Afimilk Ltd., Allflex Group, AMS Galaxy USA, Dairymaster, Fabdec Ltd., Fullwood Ltd., GEA Group AG, Hokofarm Group, Lely International NV, Livestock Improvement Corp. Ltd., Madison One Holdings LLC, Milkplan SA, Milkwell Milking Systems, Read Industrial Ltd., S.A. Christensen and Co., System Happel GmbH, Tetra Laval SA, Waikato Milking Systems LP are a few of the key vendors in the Milking Robot market.

              Europe will register the highest growth rate of 31% among the other regions. Therefore, the Milking Robot market in Europe is expected to garner significant business opportunities for the vendors during the forecast period.

              US, Germany, China, UK, Canada

              • Adoption of technologies to combat skill shortagesDaily milk production must be maximized to increase profits in the dairy industry. It has been observed that the milking of herds by robots has a 5%-10% higher productivity compared with the traditional milking process. In contrast to the traditional milking process involving human labor attending to one animal at a time is the driving factor this market.
              • robotic systems such as multiple stalls and rotary units can handle several animals is the driving factor this market.
              • thereby enhancing productivity and yield. As labor requirements are relatively lower in automated processes is the driving factor this market.
              • dairy farms are opting for robotic milking. This can increase their productivity and output to reflect greater profits in operations. Milk production and labor charges are the major cost drivers and controlling these can lead to a profitable business outcome for the dairy industry.The prospects and economic feasibility of implementing robotic systems seem to be bright. The rising labor costs and the growing demand for food are expected to drive the adoption of milking robot. With the current situation in the labor market is the driving factor this market.
              • there is an increase in demand for milking staff to meet the milking demand is the driving factor this market.
              • especially in industrialized countries. Thus is the driving factor this market.
              • it is expected that more dairy farms will adopt milking robot to meet hygiene conditions is the driving factor this market.
              • increase productivity is the driving factor this market.
              • and achieve cost efficiency. Thus is the driving factor this market.
              • the adoption of technologies to combat skill shortages propels the growth of the global milking robot market during the forecast period. is the driving factor this market.

              The Milking Robot market vendors should focus on grabbing business opportunities from the Standalone units segment as it accounted for the largest market share in the base year.