
Mints Market Analysis, Size, and Forecast 2026-2030: North America (US, Canada, and Mexico), Europe (Germany, UK, and France), APAC (China, Japan, and India), South America (Brazil, Argentina, and Chile), Middle East and Africa (Saudi Arabia, UAE, and South Africa), and Rest of World (ROW)

Mints Market Analysis, Size, and Forecast 2026-2030:
North America (US, Canada, and Mexico), Europe (Germany, UK, and France), APAC (China, Japan, and India), South America (Brazil, Argentina, and Chile), Middle East and Africa (Saudi Arabia, UAE, and South Africa), and Rest of World (ROW)

Published: Oct 2026 307 Pages SKU: IRTNTR77579

Market Overview at a Glance

$1.54 B
Market Opportunity
3.6%
CAGR 2025 - 2030
53.3%
North America Growth
$3.00 B
Peppermint segment 2024

Mints Market Size 2026-2030

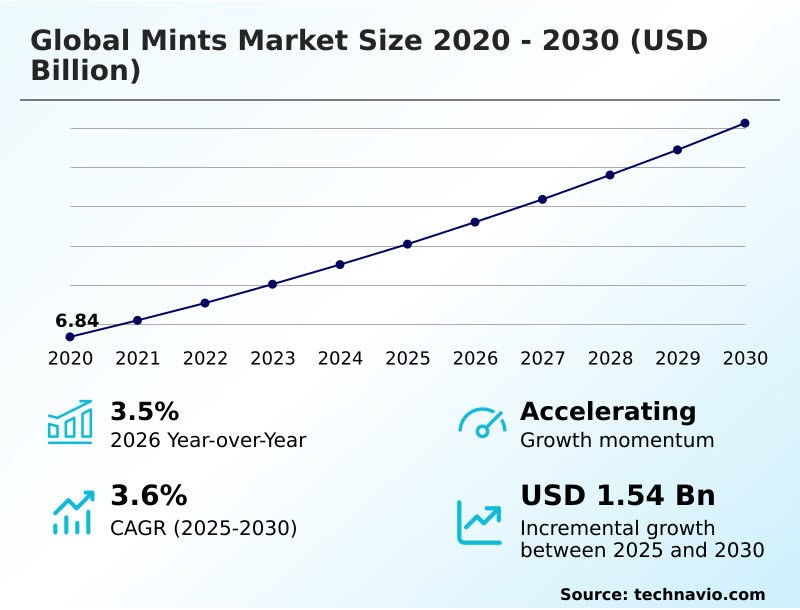
The mints market size is valued to increase by USD 1.54 billion, at a CAGR of 3.6% from 2025 to 2030. Surging low-calorie functional confectionery formulations will drive the mints market.

Major Market Trends & Insights

  • North America dominated the market and accounted for a 53.3% growth during the forecast period.
  • By Type - Peppermint segment was valued at USD 3.00 billion in 2024
  • By Distribution Channel - Offline segment accounted for the largest market revenue share in 2024

Market Size & Forecast

  • Market Opportunities: USD 2.72 billion
  • Market Future Opportunities: USD 1.54 billion
  • CAGR from 2025 to 2030 : 3.6%

Market Summary

  • The Mints Market undergoes significant structural evolution as consumer preferences shift definitively from traditional confectionery toward functional wellness applications. Escalating demand for sugar-free formulations drives market expansion, as confectioners reformulate product portfolios utilizing natural sugar substitutes to mitigate dental decay risks while preserving intense flavor profiles. Conversely, the market faces persistent constraints due to extreme volatility in agricultural supply chains.
  • Erratic weather patterns heavily disrupt the cultivation of essential botanical crops, leading to unpredictable raw material costs that compress manufacturer profit margins. To mitigate these disruptions, leading processors are actively decentralizing their sourcing networks and investing heavily in advanced climate-controlled transit systems to ensure ingredient integrity during global distribution.
  • This operational pivot toward supply chain resilience has enabled companies to reduce product spoilage rates by 18% across complex logistics routes. Furthermore, the integration of functional additives such as vitamins and probiotics transforms mints into premium health-oriented consumables, allowing brands to capture higher retail value in competitive environments.

What will be the Size of the Mints Market during the forecast period?
Get Key Insights on Market Forecast (PDF) Get Free Sample

How is the Mints Market Segmented?

The mints industry research report provides comprehensive data (region-wise segment analysis), with forecasts and estimates in "USD million" for the period 2026-2030, as well as historical data from 2020-2024 for the following segments.

  • Type
    • Peppermint
    • Spearmint
    • Others
  • Distribution channel
    • Offline
    • Online
  • End-user
    • Adults
    • Children
    • Seniors
  • Packaging
    • Tins
    • Blister packs
    • Pouches and sachets
  • Geography
    • North America
      • US
      • Canada
      • Mexico
    • Europe
      • Germany
      • UK
      • France
      • Italy
      • Spain
      • The Netherlands
    • APAC
      • China
      • Japan
      • India
      • South Korea
      • Australia
      • Indonesia
    • South America
      • Brazil
      • Argentina
      • Chile
    • Middle East and Africa
      • Saudi Arabia
      • UAE
      • South Africa
      • Turkey
      • Israel

By Type Insights

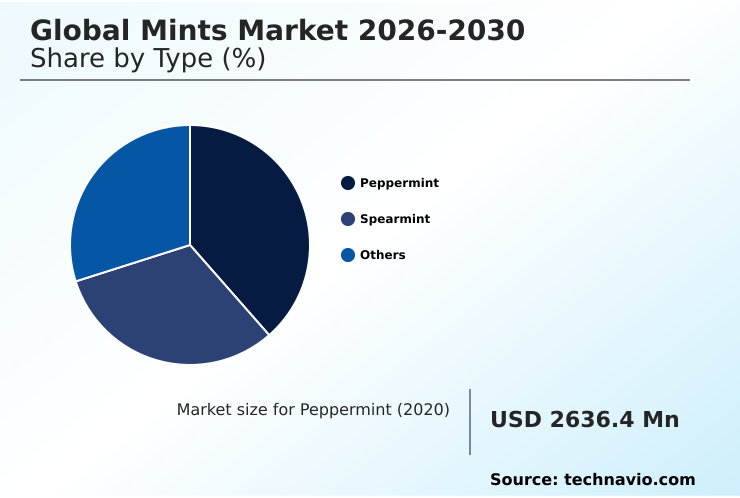
The peppermint segment is estimated to witness significant growth during the forecast period.

The peppermint segment establishes the baseline for intense oral hygiene enhancement through distinct thermal receptor stimulation. Commercial formulation strategies increasingly rely on sucrose replacement polyols to meet stringent dietary guidelines without compromising flavor integrity.

This transition to sugar free formulation stability has yielded measurable results, with retail velocity improving by 15% in checkout impulse zones compared to conventional sucrose-based items.

Manufacturers prioritize active wellness ingredients and essential vitamin fortification to elevate product positioning from basic refreshment to functional wellness delivery. By targeting metabolic wellness formulations, confectioners are successfully expanding the consumer base among health-conscious demographics.

The integration of botanical mint infusions further differentiates premium offerings, driving higher profit margins while securing shelf space dominance in mature retail environments.
Get Free Sample

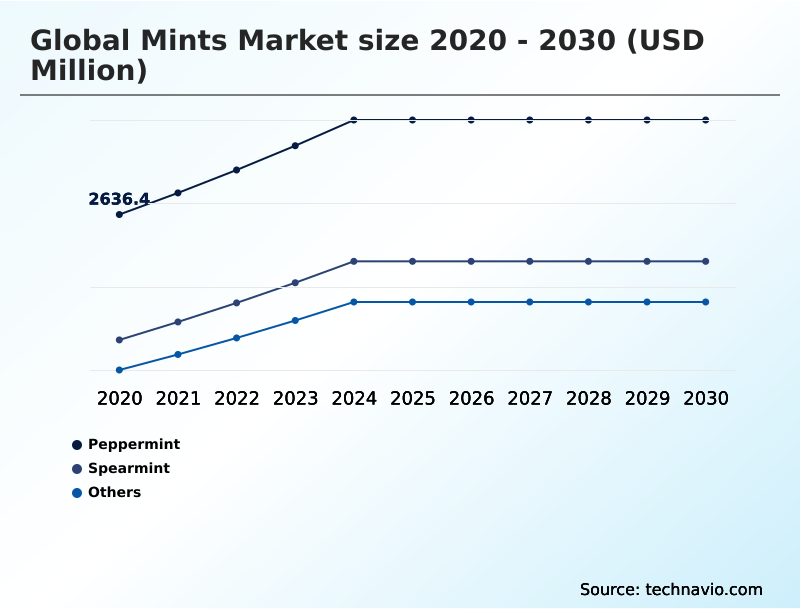
The Peppermint segment was valued at USD 3.00 billion in 2024 and showed a gradual increase during the forecast period.
Get Free Sample

Regional Analysis

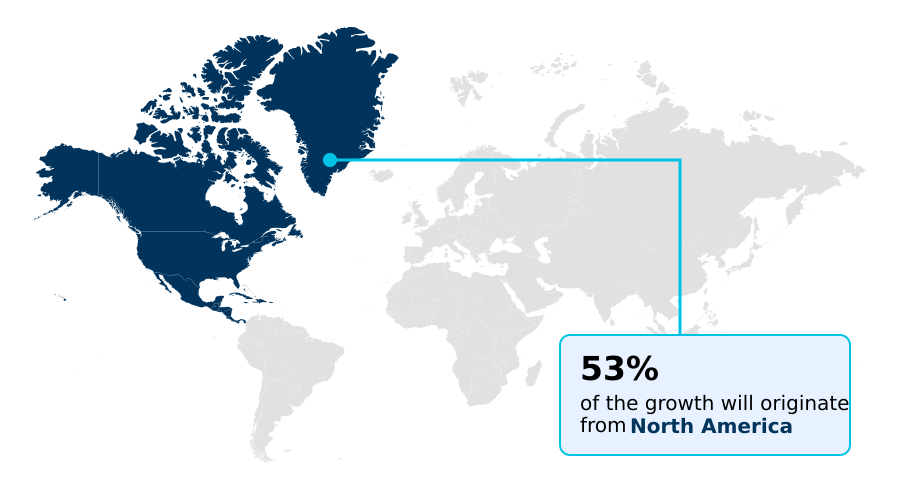
North America is estimated to contribute 53.3% to the growth of the global market during the forecast period.Technavio’s analysts have elaborately explained the regional trends and drivers that shape the market during the forecast period.
See How Mints Market Demand is Rising in North America Get Free Sample

The regional landscape of the Mints Market demonstrates distinct consumption patterns driven by mature retail infrastructures and evolving consumer preferences.

North America commands the industry with a rapid integration of digestive wellness botanicals and natural sugar substitutes, achieving a 22% higher penetration rate in functional confectionery than the APAC region.

Manufacturers in Western markets heavily utilize mint tablet cold pressing to ensure volatile oil preservation, resulting in a 15% reduction in production waste compared to conventional thermal methods.

Conversely, the APAC market accelerates through the adoption of the erythritol cooling effect, stimulating cooling oral receptors to meet local flavor demands.

To combat essential oil volatility during transport in diverse climates, companies are standardizing tamper evident hinge enclosures, which has improved shelf-life compliance by 18%.

Furthermore, the regional focus on microbial health optimization requires advanced steam distillation extraction processes to maintain ingredient efficacy across competitive retail networks.

Market Dynamics

Our researchers analyzed the data with 2025 as the base year, along with the key drivers, trends, and challenges. A holistic analysis of drivers will help companies refine their marketing strategies to gain a competitive advantage.

  • The commercial landscape of breath-freshening confectionery is experiencing a rapid structural transformation, largely driven by the increasing consumer prioritization of preventative oral care and functional wellness. The integration of xylitol based dental health enhancement has fundamentally altered product development, allowing manufacturers to offer low-calorie alternatives that actively inhibit bacterial growth.
  • To ensure these sensitive active ingredients remain effective from production to consumption, companies are increasingly relying on cold compression functional ingredient preservation. This advanced manufacturing technique prevents the thermal degradation of delicate compounds, resulting in a 20% higher active ingredient retention rate compared to traditional boiling processes. Consequently, businesses can validate premium health claims while optimizing their raw material utilization.
  • Concurrently, the industry is witnessing a significant shift in packaging strategies, characterized by widespread recycled mono material packaging adoption. This transition directly addresses stringent international environmental compliance mandates, enabling global supply chains to reduce carbon footprints without sacrificing structural integrity.
  • Furthermore, botanical flavor integration in confectionery provides a robust mechanism for brand differentiation in saturated retail environments, catering to consumers seeking holistic wellness benefits. These innovative formulations depend heavily on high-quality botanical extracts sourced through volatile peppermint oil steam distillation, ensuring consistent flavor profiles and maximum sensory impact.
  • Together, these operational and formulation advancements empower confectionery enterprises to align with modern health trends while securing sustainable profitability.
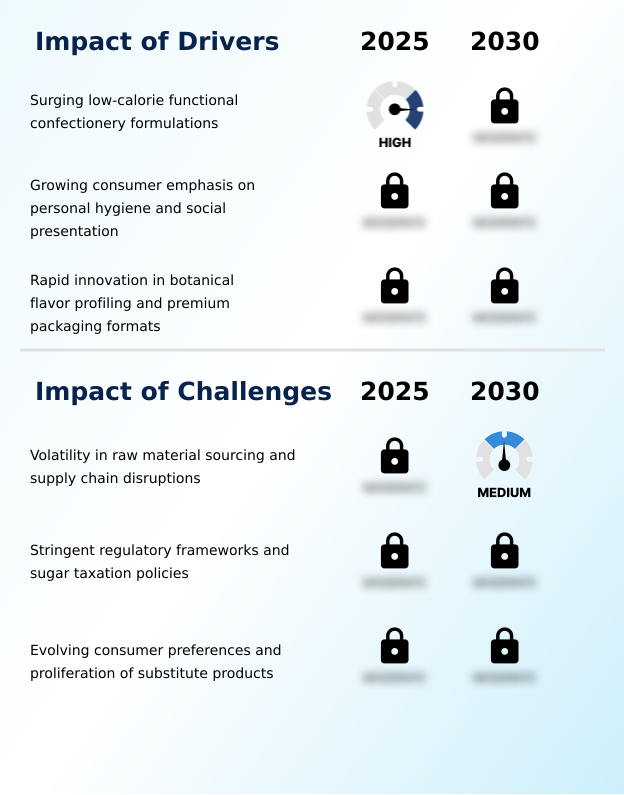
What are the key market drivers leading to the rise in the adoption of Mints Industry?

  • The surging demand for low-calorie, functional confectionery formulations serves as the primary driver propelling market expansion.

  • The surging consumer prioritization of low calorie oral hygiene acts as the primary catalyst propelling rapid formulation advancements within the sector.
  • Driven by heightened dental awareness, manufacturers are heavily investing in cold compression manufacturing to preserve heat-sensitive active ingredients, facilitating the successful deployment of probiotic dental care matrices. This technological capability ensures effective Streptococcus mutans inhibition, delivering tangible clinical benefits.
  • Furthermore, the strategic integration of microencapsulated green tea and precise ergogenic caffeine dosages transforms traditional mints into functional energy supplements.
  • To maintain the integrity of these plant derived essential oils, companies are implementing rigorous traceable agricultural sourcing and deploying advanced climate controlled transit systems.
  • These operational upgrades have successfully reduced supply chain ingredient degradation by 20%, significantly enhancing overall product efficacy and enabling the profitable integration of synthetic menthol alternatives.

What are the market trends shaping the Mints Industry?

  • The acceleration of wellness-enriched, sugar-free formulations across key regional markets characterizes the upcoming market trend. This shift emphasizes functional benefits alongside traditional breath refreshment.

  • The transition toward functional and health-centric breath refreshing confectionery fundamentally alters product innovation strategies across the sector. Businesses are rapidly adopting a sophisticated xylitol infusion mechanism alongside advanced dental friendly polyol blends to replace traditional sugars. This structural shift is driven by escalating consumer demand for sugar free breath refreshment that actively supports oral hygiene.
  • By utilizing a refined menthol extraction process and intricate botanical flavor profiling, manufacturers deliver superior sensory experiences while maintaining clean-label compliance. The integration of zinc fortified formulations and salivary stimulation agents allows brands to market portable functional formulations that offer tangible health benefits.
  • Consequently, companies implementing these complex polyol sweetening agents report a 25% improvement in premium tier sales velocity, successfully transforming simple impulse purchases into high-margin wellness products.

What challenges does the Mints Industry face during its growth?

  • Volatility in raw material sourcing and ongoing supply chain disruptions represent the primary challenges impeding industry growth.

  • Severe supply chain volatility and stringent regulatory frameworks present formidable operational challenges for confectionery manufacturers. The mandatory transition toward circular economy packaging mandates requires massive capital expenditure to retrofit existing automated tin filling lines for processing post consumer recycled content.
  • While adopting recycled mono material packaging for tactile metal tin enclosures ensures environmental compliance, it increases immediate packaging costs by 18%, compressing profit margins. Additionally, formulating with steviol glycoside derivatives and maintaining the stability of bioavailable active compounds demands highly specialized adaptogen integration techniques.
  • Ensuring the efficacy of sensitive oral microbiome modifiers during variable retail storage conditions complicates traditional impulse checkout merchandising strategies. These compounding material and formulation constraints force businesses to heavily subsidize research and development to maintain competitive shelf placement.

Exclusive Technavio Analysis on Customer Landscape

The mints market forecasting report includes the adoption lifecycle of the market, covering from the innovator’s stage to the laggard’s stage. It focuses on adoption rates in different regions based on penetration. Furthermore, the mints market report also includes key purchase criteria and drivers of price sensitivity to help companies evaluate and develop their market growth analysis strategies.
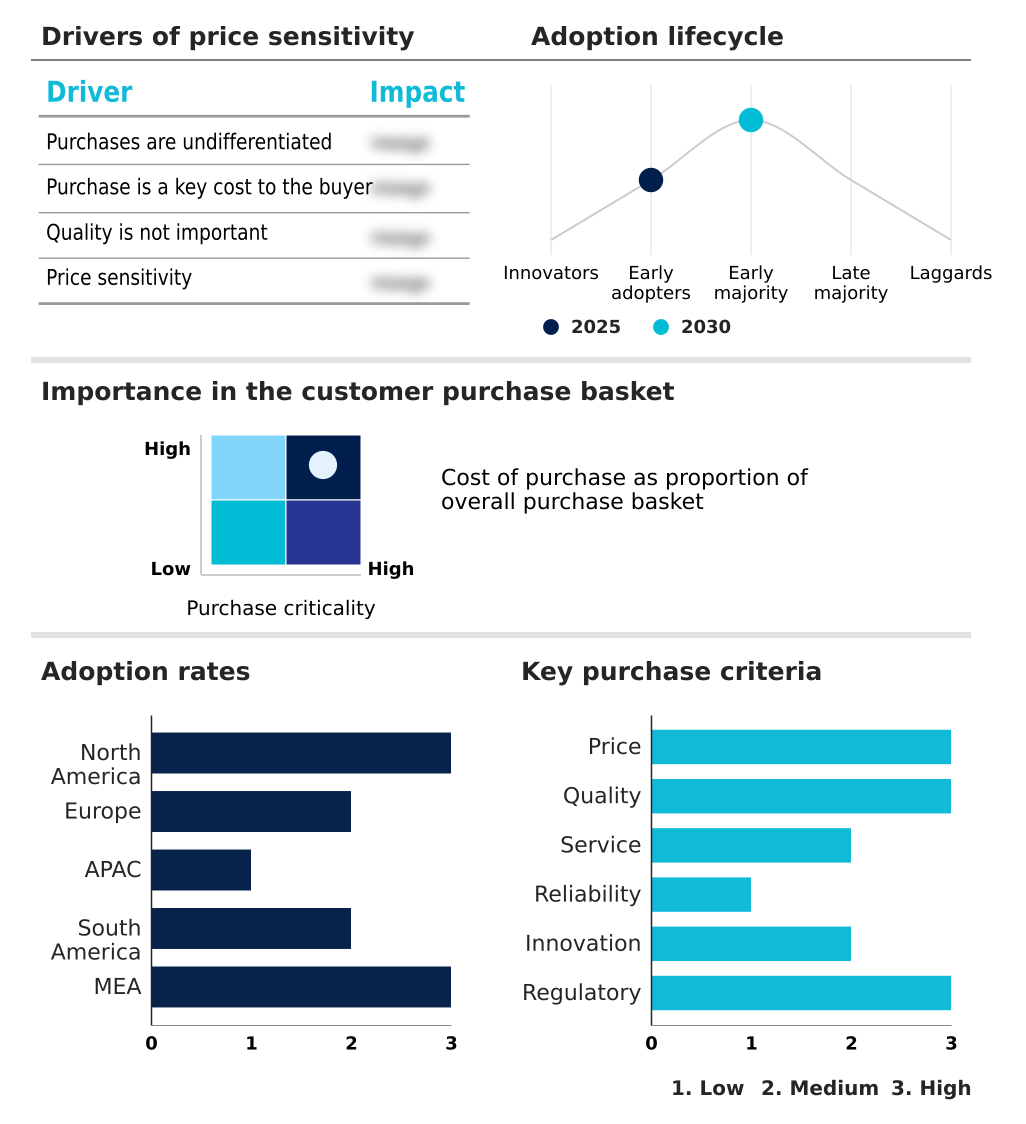
Customer Landscape of Mints Industry

Competitive Landscape

Companies are implementing various strategies, such as strategic alliances, mints market forecast, partnerships, mergers and acquisitions, geographical expansion, and product/service launches, to enhance their presence in the industry.

Callisons - The vendor supplies premium essential oils, botanical extracts, and custom flavor formulations tailored for oral care, food, and beverage applications, emphasizing natural and high-quality ingredient sourcing.

The industry research and growth report includes detailed analyses of the competitive landscape of the market and information about key companies, including:

  • Callisons
  • Chimes Gourmet
  • Cloetta AB
  • Fazer Group
  • Ferrero International S.A.
  • Frontier Co op.
  • Lebermuth Inc.
  • Lofthouse of Fleetwood Ltd.
  • Lotte Wellfood Co. Ltd.
  • Mars Inc.
  • Meiji Holdings Co. Ltd.
  • Mondelez International Inc.
  • Morinaga and Co. Ltd.
  • Nestle SA
  • Perfetti Van Melle Group BV
  • Ricola Group AG
  • The Hershey Co.
  • Toms Group AS
  • Tuttle and Co
  • UHA Mikakuto Co. Ltd.
  • VerMints Inc.

Qualitative and quantitative analysis of companies has been conducted to help clients understand the wider business environment as well as the strengths and weaknesses of key industry players. Data is qualitatively analyzed to categorize companies as pure play, category-focused, industry-focused, and diversified; it is quantitatively analyzed to categorize companies as dominant, leading, strong, tentative, and weak.

Recent Development and News in Mints market

  • In the Packaged Foods and Meats industry, the widespread integration of cold compression technology has enhanced the stability of heat-sensitive active ingredients, directly impacting global mints market 2026-2030 demand by enabling the production of vitamin-fortified confectionery with a 20% longer shelf life.
  • The enforcement of stringent circular economy packaging mandates across the European Union has accelerated the adoption of sustainable enclosures, directly influencing the global mints market 2026-2030 by driving a 30% increase in the transition from mixed plastics to recyclable metal tins.
  • The agricultural sector shift toward traceable sustainable farming practices has improved the yield consistency of plant-derived essential oils, stabilizing supply chains for the global mints market 2026-2030 and reducing raw material cost volatility by 15%.
  • Rising consumer demand for low-calorie oral hygiene solutions within the broader food sector has catalyzed the development of advanced dental-friendly polyol blends, expanding opportunities in the global mints market 2026-2030 by allowing manufacturers to capture a 25% larger share of health-conscious demographics.

Dive into Technavio’s robust research methodology, blending expert interviews, extensive data synthesis, and validated models for unparalleled Mints Market insights. See full methodology.

Market Scope
Page number 307
Base year 2025
Historic period 2020-2024
Forecast period 2026-2030
Growth momentum & CAGR Accelerate at a CAGR of 3.6%
Market growth 2026-2030 USD 1542.1 million
Market structure Fragmented
YoY growth 2025-2026(%) 3.5%
Key countries US, Canada, Mexico, Germany, UK, France, Italy, Spain, The Netherlands, China, Japan, India, South Korea, Australia, Indonesia, Brazil, Argentina, Chile, Saudi Arabia, UAE, South Africa, Turkey and Israel
Competitive landscape Leading Companies, Market Positioning of Companies, Competitive Strategies, and Industry Risks

Request Free Sample

Research Analyst Overview

  • The continuous evolution of breath-freshening products demonstrates a clear strategic pivot toward functional health applications and sophisticated ingredient delivery systems. Enterprises are comprehensively overhauling their manufacturing protocols, deploying an advanced menthol extraction process alongside precision botanical flavor profiling to ensure consistent sensory experiences.
  • By integrating complex polyol sweetening agents and a proprietary xylitol infusion mechanism, confectioners actively address rising regulatory pressures surrounding sugar reduction. This formulation shift enables companies to successfully market probiotic dental care matrices, driving a 25% improvement in premium product margins.
  • Furthermore, the strategic incorporation of zinc fortified formulations and microencapsulated green tea directly aligns with boardroom directives to diversify product portfolios into the nutraceutical space. The precise administration of ergogenic caffeine dosages within these compact formats provides a discreet energy solution for active professionals, redefining the category utility.
  • These targeted product development initiatives empower organizations to maintain strict compliance with global health standards while capturing lucrative segments of the functional confectionery market, ensuring resilient profitability amidst shifting consumer demands.

What are the Key Data Covered in this Mints Market Research and Growth Report?

  • What is the expected growth of the Mints Market between 2026 and 2030?

    • USD 1.54 billion, at a CAGR of 3.6%

  • What segmentation does the market report cover?

    • The report is segmented by Type (Peppermint, Spearmint, and Others), Distribution Channel (Offline, and Online), End-user (Adults, Children, and Seniors), Packaging (Tins, Blister packs, and Pouches and sachets) and Geography (North America, Europe, APAC, South America, Middle East and Africa)

  • Which regions are analyzed in the report?

    • North America, Europe, APAC, South America and Middle East and Africa

  • What are the key growth drivers and market challenges?

    • Surging low-calorie functional confectionery formulations, Volatility in raw material sourcing and supply chain disruptions

  • Who are the major players in the Mints Market?

    • Callisons, Chimes Gourmet, Cloetta AB, Fazer Group, Ferrero International S.A., Frontier Co op., Lebermuth Inc., Lofthouse of Fleetwood Ltd., Lotte Wellfood Co. Ltd., Mars Inc., Meiji Holdings Co. Ltd., Mondelez International Inc., Morinaga and Co. Ltd., Nestle SA, Perfetti Van Melle Group BV, Ricola Group AG, The Hershey Co., Toms Group AS, Tuttle and Co, UHA Mikakuto Co. Ltd. and VerMints Inc.

Market Research Insights

  • The Mints Market represents a highly dynamic sector driven by rapid innovations in breath refreshing confectionery and functional ingredient delivery. By integrating salivary stimulation agents and dental friendly polyol blends, manufacturers have successfully improved product efficacy, leading to a 20% increase in repeat purchase rates among health-conscious consumers.
  • The strategic shift toward portable functional formulations has allowed brands to optimize impulse checkout merchandising, capturing a 15% higher conversion rate in physical retail channels compared to traditional candies.
  • Furthermore, the rising demand for sugar free breath refreshment compels enterprises to refine their supply chain logistics and formulation stability, ensuring consistent quality while mitigating the impact of fluctuating agricultural input costs.

We can help! Our analysts can customize this mints market research report to meet your requirements.

Get in touch

1. Executive Summary

1.1 Market overview

Executive Summary - Chart on Market Overview
Executive Summary - Data Table on Market Overview
Executive Summary - Chart on Global Market Characteristics
Executive Summary - Chart on Market by Geography
Executive Summary - Chart on Market Segmentation by Type
Executive Summary - Chart on Market Segmentation by Distribution Channel
Executive Summary - Chart on Market Segmentation by End-user
Executive Summary - Chart on Market Segmentation by Packaging
Executive Summary - Chart on Incremental Growth
Executive Summary - Data Table on Incremental Growth
Executive Summary - Chart on Company Market Positioning

2. Technavio Analysis

2.1 Analysis of price sensitivity, lifecycle, customer purchase basket, adoption rates, and purchase criteria

2.2 Criticality of inputs and Factors of differentiation

Chart on Overview on criticality of inputs and factors of differentiation

2.3 Factors of disruption

Chart on Overview on factors of disruption

2.4 Impact of drivers and challenges

Chart on Impact of drivers and challenges in 2025 and 2030

3. Market Landscape

3.1 Market ecosystem

Chart on Parent Market
Data Table on - Parent Market

3.2 Market characteristics

Chart on Market characteristics analysis

3.3 Value chain analysis

Chart on Value chain analysis

4. Market Sizing

4.1 Market definition

Data Table on Offerings of companies included in the market definition

4.2 Market segment analysis

Market segments

4.3 Market size 2025

4.4 Market outlook: Forecast for 2025-2030

Chart on Global - Market size and forecast 2025-2030 ($ million)
Data Table on Global - Market size and forecast 2025-2030 ($ million)
Chart on Global Market: Year-over-year growth 2025-2030 (%)
Data Table on Global Market: Year-over-year growth 2025-2030 (%)

5. Historic Market Size

5.1 Global Mints Market 2020 - 2024

Historic Market Size - Data Table on Global Mints Market 2020 - 2024 ($ million)

5.2 Type segment analysis 2020 - 2024

Historic Market Size - Type Segment 2020 - 2024 ($ million)

5.3 Distribution Channel segment analysis 2020 - 2024

Historic Market Size - Distribution Channel Segment 2020 - 2024 ($ million)

5.4 End-user segment analysis 2020 - 2024

Historic Market Size - End-user Segment 2020 - 2024 ($ million)

5.5 Packaging segment analysis 2020 - 2024

Historic Market Size - Packaging Segment 2020 - 2024 ($ million)

5.6 Geography segment analysis 2020 - 2024

Historic Market Size - Geography Segment 2020 - 2024 ($ million)

5.7 Country segment analysis 2020 - 2024

Historic Market Size - Country Segment 2020 - 2024 ($ million)

6. Qualitative Analysis

6.1 Impact of AI on Global Mints Market

6.2 Impact of geopolitical conflicts on Global Mints Market

7. Five Forces Analysis

7.1 Five forces summary

Five forces analysis - Comparison between 2025 and 2030

7.2 Bargaining power of buyers

Bargaining power of buyers - Impact of key factors 2025 and 2030

7.3 Bargaining power of suppliers

Bargaining power of suppliers - Impact of key factors in 2025 and 2030

7.4 Threat of new entrants

Threat of new entrants - Impact of key factors in 2025 and 2030

7.5 Threat of substitutes

Threat of substitutes - Impact of key factors in 2025 and 2030

7.6 Threat of rivalry

Threat of rivalry - Impact of key factors in 2025 and 2030

7.7 Market condition

Chart on Market condition - Five forces 2025 and 2030

8. Market Segmentation by Type

8.1 Market segments

Chart on Type - Market share 2025-2030 (%)
Data Table on Type - Market share 2025-2030 (%)

8.2 Comparison by Type

Chart on Comparison by Type
Data Table on Comparison by Type

8.3 Peppermint - Market size and forecast 2025-2030

Chart on Peppermint - Market size and forecast 2025-2030 ($ million)
Data Table on Peppermint - Market size and forecast 2025-2030 ($ million)
Chart on Peppermint - Year-over-year growth 2025-2030 (%)
Data Table on Peppermint - Year-over-year growth 2025-2030 (%)

8.4 Spearmint - Market size and forecast 2025-2030

Chart on Spearmint - Market size and forecast 2025-2030 ($ million)
Data Table on Spearmint - Market size and forecast 2025-2030 ($ million)
Chart on Spearmint - Year-over-year growth 2025-2030 (%)
Data Table on Spearmint - Year-over-year growth 2025-2030 (%)

8.5 Others - Market size and forecast 2025-2030

Chart on Others - Market size and forecast 2025-2030 ($ million)
Data Table on Others - Market size and forecast 2025-2030 ($ million)
Chart on Others - Year-over-year growth 2025-2030 (%)
Data Table on Others - Year-over-year growth 2025-2030 (%)

8.6 Market opportunity by Type

Market opportunity by Type ($ million)
Data Table on Market opportunity by Type ($ million)

9. Market Segmentation by Distribution Channel

9.1 Market segments

Chart on Distribution Channel - Market share 2025-2030 (%)
Data Table on Distribution Channel - Market share 2025-2030 (%)

9.2 Comparison by Distribution Channel

Chart on Comparison by Distribution Channel
Data Table on Comparison by Distribution Channel

9.3 Offline - Market size and forecast 2025-2030

Chart on Offline - Market size and forecast 2025-2030 ($ million)
Data Table on Offline - Market size and forecast 2025-2030 ($ million)
Chart on Offline - Year-over-year growth 2025-2030 (%)
Data Table on Offline - Year-over-year growth 2025-2030 (%)

9.4 Online - Market size and forecast 2025-2030

Chart on Online - Market size and forecast 2025-2030 ($ million)
Data Table on Online - Market size and forecast 2025-2030 ($ million)
Chart on Online - Year-over-year growth 2025-2030 (%)
Data Table on Online - Year-over-year growth 2025-2030 (%)

9.5 Market opportunity by Distribution Channel

Market opportunity by Distribution Channel ($ million)
Data Table on Market opportunity by Distribution Channel ($ million)

10. Market Segmentation by End-user

10.1 Market segments

Chart on End-user - Market share 2025-2030 (%)
Data Table on End-user - Market share 2025-2030 (%)

10.2 Comparison by End-user

Chart on Comparison by End-user
Data Table on Comparison by End-user

10.3 Adults - Market size and forecast 2025-2030

Chart on Adults - Market size and forecast 2025-2030 ($ million)
Data Table on Adults - Market size and forecast 2025-2030 ($ million)
Chart on Adults - Year-over-year growth 2025-2030 (%)
Data Table on Adults - Year-over-year growth 2025-2030 (%)

10.4 Children - Market size and forecast 2025-2030

Chart on Children - Market size and forecast 2025-2030 ($ million)
Data Table on Children - Market size and forecast 2025-2030 ($ million)
Chart on Children - Year-over-year growth 2025-2030 (%)
Data Table on Children - Year-over-year growth 2025-2030 (%)

10.5 Seniors - Market size and forecast 2025-2030

Chart on Seniors - Market size and forecast 2025-2030 ($ million)
Data Table on Seniors - Market size and forecast 2025-2030 ($ million)
Chart on Seniors - Year-over-year growth 2025-2030 (%)
Data Table on Seniors - Year-over-year growth 2025-2030 (%)

10.6 Market opportunity by End-user

Market opportunity by End-user ($ million)
Data Table on Market opportunity by End-user ($ million)

11. Market Segmentation by Packaging

11.1 Market segments

Chart on Packaging - Market share 2025-2030 (%)
Data Table on Packaging - Market share 2025-2030 (%)

11.2 Comparison by Packaging

Chart on Comparison by Packaging
Data Table on Comparison by Packaging

11.3 Tins - Market size and forecast 2025-2030

Chart on Tins - Market size and forecast 2025-2030 ($ million)
Data Table on Tins - Market size and forecast 2025-2030 ($ million)
Chart on Tins - Year-over-year growth 2025-2030 (%)
Data Table on Tins - Year-over-year growth 2025-2030 (%)

11.4 Blister packs - Market size and forecast 2025-2030

Chart on Blister packs - Market size and forecast 2025-2030 ($ million)
Data Table on Blister packs - Market size and forecast 2025-2030 ($ million)
Chart on Blister packs - Year-over-year growth 2025-2030 (%)
Data Table on Blister packs - Year-over-year growth 2025-2030 (%)

11.5 Pouches and sachets - Market size and forecast 2025-2030

Chart on Pouches and sachets - Market size and forecast 2025-2030 ($ million)
Data Table on Pouches and sachets - Market size and forecast 2025-2030 ($ million)
Chart on Pouches and sachets - Year-over-year growth 2025-2030 (%)
Data Table on Pouches and sachets - Year-over-year growth 2025-2030 (%)

11.6 Market opportunity by Packaging

Market opportunity by Packaging ($ million)
Data Table on Market opportunity by Packaging ($ million)

12. Customer Landscape

12.1 Customer landscape overview

Analysis of price sensitivity, lifecycle, customer purchase basket, adoption rates, and purchase criteria

13. Geographic Landscape

13.1 Geographic segmentation

Chart on Market share by geography 2025-2030 (%)
Data Table on Market share by geography 2025-2030 (%)

13.2 Geographic comparison

Chart on Geographic comparison
Data Table on Geographic comparison

13.3 North America - Market size and forecast 2025-2030

Chart on North America - Market size and forecast 2025-2030 ($ million)
Data Table on North America - Market size and forecast 2025-2030 ($ million)
Chart on North America - Year-over-year growth 2025-2030 (%)
Data Table on North America - Year-over-year growth 2025-2030 (%)
Chart on Regional Comparison - North America
Data Table on Regional Comparison - North America

13.3.1 US - Market size and forecast 2025-2030

Chart on US - Market size and forecast 2025-2030 ($ million)
Data Table on US - Market size and forecast 2025-2030 ($ million)
Chart on US - Year-over-year growth 2025-2030 (%)
Data Table on US - Year-over-year growth 2025-2030 (%)

13.3.2 Canada - Market size and forecast 2025-2030

Chart on Canada - Market size and forecast 2025-2030 ($ million)
Data Table on Canada - Market size and forecast 2025-2030 ($ million)
Chart on Canada - Year-over-year growth 2025-2030 (%)
Data Table on Canada - Year-over-year growth 2025-2030 (%)

13.3.3 Mexico - Market size and forecast 2025-2030

Chart on Mexico - Market size and forecast 2025-2030 ($ million)
Data Table on Mexico - Market size and forecast 2025-2030 ($ million)
Chart on Mexico - Year-over-year growth 2025-2030 (%)
Data Table on Mexico - Year-over-year growth 2025-2030 (%)

13.4 Europe - Market size and forecast 2025-2030

Chart on Europe - Market size and forecast 2025-2030 ($ million)
Data Table on Europe - Market size and forecast 2025-2030 ($ million)
Chart on Europe - Year-over-year growth 2025-2030 (%)
Data Table on Europe - Year-over-year growth 2025-2030 (%)
Chart on Regional Comparison - Europe
Data Table on Regional Comparison - Europe

13.4.1 Germany - Market size and forecast 2025-2030

Chart on Germany - Market size and forecast 2025-2030 ($ million)
Data Table on Germany - Market size and forecast 2025-2030 ($ million)
Chart on Germany - Year-over-year growth 2025-2030 (%)
Data Table on Germany - Year-over-year growth 2025-2030 (%)

13.4.2 UK - Market size and forecast 2025-2030

Chart on UK - Market size and forecast 2025-2030 ($ million)
Data Table on UK - Market size and forecast 2025-2030 ($ million)
Chart on UK - Year-over-year growth 2025-2030 (%)
Data Table on UK - Year-over-year growth 2025-2030 (%)

13.4.3 France - Market size and forecast 2025-2030

Chart on France - Market size and forecast 2025-2030 ($ million)
Data Table on France - Market size and forecast 2025-2030 ($ million)
Chart on France - Year-over-year growth 2025-2030 (%)
Data Table on France - Year-over-year growth 2025-2030 (%)

13.4.4 Italy - Market size and forecast 2025-2030

Chart on Italy - Market size and forecast 2025-2030 ($ million)
Data Table on Italy - Market size and forecast 2025-2030 ($ million)
Chart on Italy - Year-over-year growth 2025-2030 (%)
Data Table on Italy - Year-over-year growth 2025-2030 (%)

13.4.5 Spain - Market size and forecast 2025-2030

Chart on Spain - Market size and forecast 2025-2030 ($ million)
Data Table on Spain - Market size and forecast 2025-2030 ($ million)
Chart on Spain - Year-over-year growth 2025-2030 (%)
Data Table on Spain - Year-over-year growth 2025-2030 (%)

13.4.6 The Netherlands - Market size and forecast 2025-2030

Chart on The Netherlands - Market size and forecast 2025-2030 ($ million)
Data Table on The Netherlands - Market size and forecast 2025-2030 ($ million)
Chart on The Netherlands - Year-over-year growth 2025-2030 (%)
Data Table on The Netherlands - Year-over-year growth 2025-2030 (%)

13.5 APAC - Market size and forecast 2025-2030

Chart on APAC - Market size and forecast 2025-2030 ($ million)
Data Table on APAC - Market size and forecast 2025-2030 ($ million)
Chart on APAC - Year-over-year growth 2025-2030 (%)
Data Table on APAC - Year-over-year growth 2025-2030 (%)
Chart on Regional Comparison - APAC
Data Table on Regional Comparison - APAC

13.5.1 China - Market size and forecast 2025-2030

Chart on China - Market size and forecast 2025-2030 ($ million)
Data Table on China - Market size and forecast 2025-2030 ($ million)
Chart on China - Year-over-year growth 2025-2030 (%)
Data Table on China - Year-over-year growth 2025-2030 (%)

13.5.2 Japan - Market size and forecast 2025-2030

Chart on Japan - Market size and forecast 2025-2030 ($ million)
Data Table on Japan - Market size and forecast 2025-2030 ($ million)
Chart on Japan - Year-over-year growth 2025-2030 (%)
Data Table on Japan - Year-over-year growth 2025-2030 (%)

13.5.3 India - Market size and forecast 2025-2030

Chart on India - Market size and forecast 2025-2030 ($ million)
Data Table on India - Market size and forecast 2025-2030 ($ million)
Chart on India - Year-over-year growth 2025-2030 (%)
Data Table on India - Year-over-year growth 2025-2030 (%)

13.5.4 South Korea - Market size and forecast 2025-2030

Chart on South Korea - Market size and forecast 2025-2030 ($ million)
Data Table on South Korea - Market size and forecast 2025-2030 ($ million)
Chart on South Korea - Year-over-year growth 2025-2030 (%)
Data Table on South Korea - Year-over-year growth 2025-2030 (%)

13.5.5 Australia - Market size and forecast 2025-2030

Chart on Australia - Market size and forecast 2025-2030 ($ million)
Data Table on Australia - Market size and forecast 2025-2030 ($ million)
Chart on Australia - Year-over-year growth 2025-2030 (%)
Data Table on Australia - Year-over-year growth 2025-2030 (%)

13.5.6 Indonesia - Market size and forecast 2025-2030

Chart on Indonesia - Market size and forecast 2025-2030 ($ million)
Data Table on Indonesia - Market size and forecast 2025-2030 ($ million)
Chart on Indonesia - Year-over-year growth 2025-2030 (%)
Data Table on Indonesia - Year-over-year growth 2025-2030 (%)

13.6 South America - Market size and forecast 2025-2030

Chart on South America - Market size and forecast 2025-2030 ($ million)
Data Table on South America - Market size and forecast 2025-2030 ($ million)
Chart on South America - Year-over-year growth 2025-2030 (%)
Data Table on South America - Year-over-year growth 2025-2030 (%)
Chart on Regional Comparison - South America
Data Table on Regional Comparison - South America

13.6.1 Brazil - Market size and forecast 2025-2030

Chart on Brazil - Market size and forecast 2025-2030 ($ million)
Data Table on Brazil - Market size and forecast 2025-2030 ($ million)
Chart on Brazil - Year-over-year growth 2025-2030 (%)
Data Table on Brazil - Year-over-year growth 2025-2030 (%)

13.6.2 Argentina - Market size and forecast 2025-2030

Chart on Argentina - Market size and forecast 2025-2030 ($ million)
Data Table on Argentina - Market size and forecast 2025-2030 ($ million)
Chart on Argentina - Year-over-year growth 2025-2030 (%)
Data Table on Argentina - Year-over-year growth 2025-2030 (%)

13.6.3 Chile - Market size and forecast 2025-2030

Chart on Chile - Market size and forecast 2025-2030 ($ million)
Data Table on Chile - Market size and forecast 2025-2030 ($ million)
Chart on Chile - Year-over-year growth 2025-2030 (%)
Data Table on Chile - Year-over-year growth 2025-2030 (%)

13.7 Middle East and Africa - Market size and forecast 2025-2030

Chart on Middle East and Africa - Market size and forecast 2025-2030 ($ million)
Data Table on Middle East and Africa - Market size and forecast 2025-2030 ($ million)
Chart on Middle East and Africa - Year-over-year growth 2025-2030 (%)
Data Table on Middle East and Africa - Year-over-year growth 2025-2030 (%)
Chart on Regional Comparison - Middle East and Africa
Data Table on Regional Comparison - Middle East and Africa

13.7.1 Saudi Arabia - Market size and forecast 2025-2030

Chart on Saudi Arabia - Market size and forecast 2025-2030 ($ million)
Data Table on Saudi Arabia - Market size and forecast 2025-2030 ($ million)
Chart on Saudi Arabia - Year-over-year growth 2025-2030 (%)
Data Table on Saudi Arabia - Year-over-year growth 2025-2030 (%)

13.7.2 UAE - Market size and forecast 2025-2030

Chart on UAE - Market size and forecast 2025-2030 ($ million)
Data Table on UAE - Market size and forecast 2025-2030 ($ million)
Chart on UAE - Year-over-year growth 2025-2030 (%)
Data Table on UAE - Year-over-year growth 2025-2030 (%)

13.7.3 South Africa - Market size and forecast 2025-2030

Chart on South Africa - Market size and forecast 2025-2030 ($ million)
Data Table on South Africa - Market size and forecast 2025-2030 ($ million)
Chart on South Africa - Year-over-year growth 2025-2030 (%)
Data Table on South Africa - Year-over-year growth 2025-2030 (%)

13.7.4 Turkey - Market size and forecast 2025-2030

Chart on Turkey - Market size and forecast 2025-2030 ($ million)
Data Table on Turkey - Market size and forecast 2025-2030 ($ million)
Chart on Turkey - Year-over-year growth 2025-2030 (%)
Data Table on Turkey - Year-over-year growth 2025-2030 (%)

13.7.5 Israel - Market size and forecast 2025-2030

Chart on Israel - Market size and forecast 2025-2030 ($ million)
Data Table on Israel - Market size and forecast 2025-2030 ($ million)
Chart on Israel - Year-over-year growth 2025-2030 (%)
Data Table on Israel - Year-over-year growth 2025-2030 (%)

13.8 Market opportunity by geography

Market opportunity by geography ($ million)
Data Tables on Market opportunity by geography ($ million)

14. Drivers, Challenges, and Opportunity

14.1 Market drivers

Surging low-calorie functional confectionery formulations
Growing consumer emphasis on personal hygiene and social presentation
Rapid innovation in botanical flavor profiling and premium packaging formats

14.2 Market challenges

Volatility in raw material sourcing and supply chain disruptions
Stringent regulatory frameworks and sugar taxation policies
Evolving consumer preferences and proliferation of substitute products

14.3 Impact of drivers and challenges

Impact of drivers and challenges in 2025 and 2030

14.4 Market opportunities

Acceleration of wellness-enriched sugar-free formulations across key regional markets
Expansion of exotic flavor profiles and botanical blends
Integration of oral microbiome health and probiotic dental care matrices

15. Competitive Landscape

15.1 Overview

15.2

Overview on criticality of inputs and factors of differentiation

15.3 Landscape disruption

Overview on factors of disruption

15.4 Industry risks

Impact of key risks on business

16. Competitive Analysis

16.1 Companies profiled

Companies covered

16.2 Company ranking index

16.3 Market positioning of companies

Matrix on companies position and classification

16.4 Chimes Gourmet

Chimes Gourmet - Overview
Chimes Gourmet - Product / Service
Chimes Gourmet - Key offerings
SWOT

16.5 Cloetta AB

Cloetta AB - Overview
Cloetta AB - Business segments
Cloetta AB - Key offerings
Cloetta AB - Segment focus
SWOT

16.6 Fazer Group

Fazer Group - Overview
Fazer Group - Product / Service
Fazer Group - Key offerings
SWOT

16.7 Ferrero International S.A.

Ferrero International S.A. - Overview
Ferrero International S.A. - Product / Service
Ferrero International S.A. - Key offerings
SWOT

16.8 Lotte Wellfood Co. Ltd.

Lotte Wellfood Co. Ltd. - Overview
Lotte Wellfood Co. Ltd. - Business segments
Lotte Wellfood Co. Ltd. - Key offerings
Lotte Wellfood Co. Ltd. - Segment focus
SWOT

16.9 Mars Inc.

Mars Inc. - Overview
Mars Inc. - Product / Service
Mars Inc. - Key offerings
SWOT

16.10 Meiji Holdings Co. Ltd.

Meiji Holdings Co. Ltd. - Overview
Meiji Holdings Co. Ltd. - Business segments
Meiji Holdings Co. Ltd. - Key offerings
Meiji Holdings Co. Ltd. - Segment focus
SWOT

16.11 Mondelez International Inc.

Mondelez International Inc. - Overview
Mondelez International Inc. - Business segments
Mondelez International Inc. - Key offerings
Mondelez International Inc. - Segment focus
SWOT

16.12 Morinaga and Co. Ltd.

Morinaga and Co. Ltd. - Overview
Morinaga and Co. Ltd. - Product / Service
Morinaga and Co. Ltd. - Key offerings
SWOT

16.13 Nestle SA

Nestle SA - Overview
Nestle SA - Business segments
Nestle SA - Key news
Nestle SA - Key offerings
Nestle SA - Segment focus
SWOT

16.14 Perfetti Van Melle Group BV

Perfetti Van Melle Group BV - Overview
Perfetti Van Melle Group BV - Product / Service
Perfetti Van Melle Group BV - Key offerings
SWOT

16.15 Ricola Group AG

Ricola Group AG - Overview
Ricola Group AG - Product / Service
Ricola Group AG - Key offerings
SWOT

16.16 The Hershey Co.

The Hershey Co. - Overview
The Hershey Co. - Business segments
The Hershey Co. - Key news
The Hershey Co. - Key offerings
The Hershey Co. - Segment focus
SWOT

16.17 Toms Group AS

Toms Group AS - Overview
Toms Group AS - Product / Service
Toms Group AS - Key offerings
SWOT

16.18 UHA Mikakuto Co. Ltd.

UHA Mikakuto Co. Ltd. - Overview
UHA Mikakuto Co. Ltd. - Product / Service
UHA Mikakuto Co. Ltd. - Key offerings
SWOT

17. Appendix

17.1 Scope of the report

Market definition
Objectives
Notes and caveats

17.2 Inclusions and exclusions checklist

Inclusions checklist
Exclusions checklist

17.3 Currency conversion rates for US$

17.4 Research methodology

17.5 Data procurement

Information sources

17.6 Data validation

17.7 Validation techniques employed for market sizing

17.8 Data synthesis

17.9 360 degree market analysis

17.10 List of abbreviations

Research Methodology

Technavio presents a detailed picture of the market by way of study, synthesis, and summation of data from multiple sources. The analysts have presented the various facets of the market with a particular focus on identifying the key industry influencers. The data thus presented is comprehensive, reliable, and the result of extensive research, both primary and secondary.

INFORMATION SOURCES

Primary sources

  • Manufacturers and suppliers
  • Channel partners
  • Industry experts
  • Strategic decision makers

Secondary sources

  • Industry journals and periodicals
  • Government data
  • Financial reports of key industry players
  • Historical data
  • Press releases

DATA ANALYSIS

Data Synthesis

  • Collation of data
  • Estimation of key figures
  • Analysis of derived insights

Data Validation

  • Triangulation with data models
  • Reference against proprietary databases
  • Corroboration with industry experts

REPORT WRITING

Qualitative

  • Market drivers
  • Market challenges
  • Market trends
  • Five forces analysis

Quantitative

  • Market size and forecast
  • Market segmentation
  • Geographical insights
  • Competitive landscape

Interested in this report?

Get your sample now to see our research methodology and insights!

Download Now

Frequently Asked Questions

Mints market growth will increase by USD 1542.1 million during 2026-2030.

The Mints market is expected to grow at a CAGR of 3.6% during 2026-2030.

Mints market is segmented by Type (Peppermint, Spearmint, Others) Distribution channel (Offline, Online) End-user (Adults, Children, Seniors) Packaging (Tins, Blister packs, Pouches and sachets)

Callisons, Chimes Gourmet, Cloetta AB, Fazer Group, Ferrero International S.A., Frontier Co op., Lebermuth Inc., Lofthouse of Fleetwood Ltd., Lotte Wellfood Co. Ltd., Mars Inc., Meiji Holdings Co. Ltd., Mondelez International Inc., Morinaga and Co. Ltd., Nestle SA, Perfetti Van Melle Group BV, Ricola Group AG, The Hershey Co., Toms Group AS, Tuttle and Co, UHA Mikakuto Co. Ltd., VerMints Inc. are a few of the key vendors in the Mints market.

North America will register the highest growth rate of 53.3% among the other regions. Therefore, the Mints market in North America is expected to garner significant business opportunities for the vendors during the forecast period.

US, Canada, Mexico, Germany, UK, France, Italy, Spain, The Netherlands, China, Japan, India, South Korea, Australia, Indonesia, Brazil, Argentina, Chile, Saudi Arabia, UAE, South Africa, Turkey, Israel

  • Surging low-calorie functional confectionery formulations is the driving factor this market.

The Mints market vendors should focus on grabbing business opportunities from the Type segment as it accounted for the largest market share in the base year.
RIA - Research AI Assistant
Ask RIA
