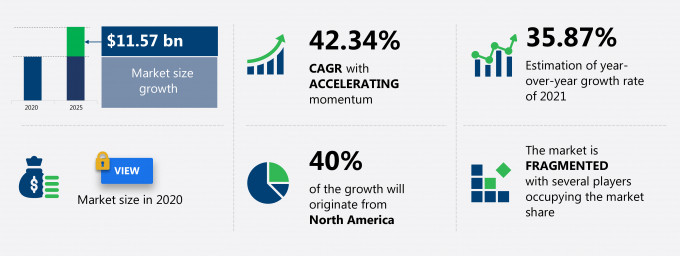
The mobile backend service market share is expected to increase by USD 11.57 billion from 2020 to 2025, and the market’s growth momentum will accelerate at a CAGR of 42.34%.
This mobile backend service market research report provides valuable insights on the post COVID-19 impact on the market, which will help companies evaluate their business approaches. Furthermore, this report extensively covers mobile backend service market segmentation by end-user (SMEs and large enterprises) and geography (North America, APAC, Europe, MEA, and South America). The mobile backend service market report also offers information on several market vendors, including Alphabet Inc., Apple Inc., Axway Software SA, Convertigo SA, International Business Machines Corp., Kii Corp., Kumulos Ltd, Microsoft Corp., Oracle Corp., and Temenos AG among others.
What will the Mobile Backend Service Market Size be During the Forecast Period?
Download the Free Report Sample to Unlock the Mobile Backend Service Market Size for the Forecast Period and Other Important Statistics
Mobile Backend Service Market: Key Drivers, Trends, and Challenges
The rising need to reduce complexities in application development is notably driving the mobile backend service market growth, although factors such as enterprise application integration issues may impede the market growth. Our research analysts have studied the historical data and deduced the key market drivers and the COVID-19 pandemic impact on the mobile backend service industry. The holistic analysis of the drivers will help in deducing end goals and refining marketing strategies to gain a competitive edge.
Key Mobile Backend Service Market Driver
The significant increase in the needs to minimize the complexities in application development is one of the key factors fueling the mobile backend service market share growth. It also makes the tasks easy for application developers by eliminating the need of creating their own backend framework for the integration of every component of the applications. This ultimately reduces the development time of applications. Moreover, most of the business applications are on the verge of transforming into mobile solutions to provide better mobility and scalability for client satisfaction. Thus, the rise in demand is simplified application development is expected to elevate the mobile backend service market growth during the forecast period.
Key Mobile Backend Service Market Trend
The increased adoption of cloud computing and IoT is another factor supporting the mobile backend service market share growth. The adoption of the cloud-based solution in organizations is changing the IT infrastructure as it is cost-effective, flexible, and agile. Firms tend to choose end-to-end managed cloud services that will help them supervise their business applications portfolio, database, and middleware. Also, the growing adoption of IoT among the organization to ensure better connectivity and storage requires strong backend support services. These services manage the backend tasks such as upgrading firmware, storage capacity, and event processing. The use of IoT devices is growing at a fast pace worldwide. Technavio expects approximately 40 billion Internet-connected smart devices to be in use by 2020.
Key Mobile Backend Service Market Challenge
The enterprise application integration issues is one of the key challenges for the mobile backend service market growth. Organizations adopting these services have reported to face challenges related to assimilation itself and customization requirements in the application development process for running multiple operating systems in the backend systems. Hence, it is mandatory for providers to ensure there is seamless customization to meet the maximum requirements without having the need to replicate the data. Moreover, many of the mobile backend service user firms have to be dependent on their service providers for longer time. Thus, the complications in the integration of enterprise applications is estimated to impact the growth of mobile backend service market during the forecast period.
This mobile backend service market analysis report also provides detailed information on other upcoming trends and challenges that will have a far-reaching effect on the market growth. The actionable insights on the trends and challenges will help companies evaluate and develop growth strategies for 2021-2025.
Parent Market Analysis
Technavio categorizes the global mobile backend service market as a part of the global data processing and outsourced services market. Our research report has extensively covered external factors influencing the parent market growth potential in the coming years, which will determine the levels of growth of the mobile backend service market during the forecast period.
Who are the Major Mobile Backend Service Market Vendors?
The report analyzes the market’s competitive landscape and offers information on several market vendors, including:
- Alphabet Inc.
- Apple Inc.
- Axway Software SA
- Convertigo SA
- International Business Machines Corp.
- Kii Corp.
- Kumulos Ltd
- Microsoft Corp.
- Oracle Corp.
- Temenos AG
This statistical study of the mobile backend service market encompasses successful business strategies deployed by the key vendors. The mobile backend service market is fragmented and the vendors are deploying growth strategies such as increasing spending on advertisements and marketing to compete in the market.
Product Insights and News
-
Alphabet Inc. - The company offers mobile backend services that provides a GUI-based option for creating notification requests and for full automation and support for all message types, under the brand name of Firebase.
To make the most of the opportunities and recover from post COVID-19 impact, market vendors should focus more on the growth prospects in the fast-growing segments, while maintaining their positions in the slow-growing segments.
The mobile backend service market forecast report offers in-depth insights into key vendor profiles. The profiles include information on the production, sustainability, and prospects of the leading companies.
Mobile Backend Service Market Value Chain Analysis
Our report provides extensive information on the value chain analysis for the mobile backend service market, which vendors can leverage to gain a competitive advantage during the forecast period. The end-to-end understanding of the value chain is essential in profit margin optimization and evaluation of business strategies. The data available in our value chain analysis segment can help vendors drive costs and enhance customer services during the forecast period.
The value chain of the data processing and outsourced services market includes the following core components:
- Inputs
- Operations
- Marketing and sales
- Support activities
- Innovation
The report has further elucidated on other innovative approaches being followed by service providers to ensure a sustainable market presence.
Which are the Key Regions for Mobile Backend Service Market?
For more insights on the market share of various regions Request for a FREE sample now!
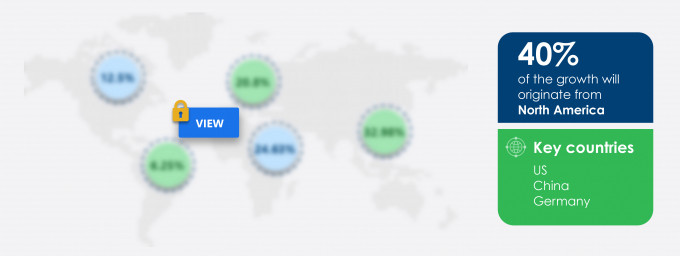
40% of the market’s growth will originate from North America during the forecast period. US and Canada are the key markets for mobile backend service in North America. Market growth in this region will be slower than the growth of the market in the European, APAC and South American regions.
The rise in the number of connected devices and internet penetration will facilitate the mobile backend service market growth in North America over the forecast period. This market research report entails detailed information on the competitive intelligence, marketing gaps, and regional opportunities in store for vendors, which will assist in creating efficient business plans.
COVID Impact and Recovery Analysis
The countries of North America are facing the adverse impact of the COVID-19. Due to the imposing of lockdown, companies were forced to shut down their offices, and employees were asked to work remotely. This further started a new era of work-from-home (WFH), which further resulted in some of the companies announcing the closure of their offices and adopting permanent WFH. In response to this, some tech giants had taken action, such as announcing the policy for remote working.
What are the Revenue-generating End-user Segments in the Mobile Backend Service Market?
To gain further insights on the market contribution of various segments Request for a FREE sample
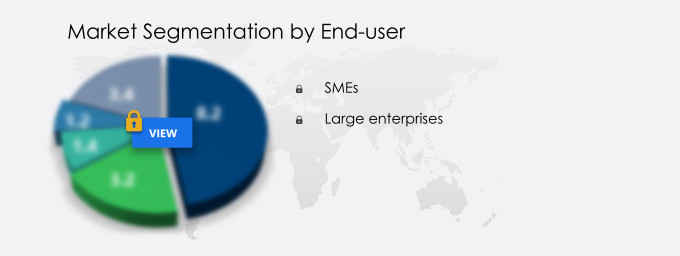
The mobile backend service market share growth by the SMEs segment will be significant during the forecast period. There has been a growth in the number of SMEs in the healthcare, manufacturing and BFSI industries since they have realized the significance of mobile backend services. Moreover, these services are offered by vendors as a bundled service for the SMEs. Furthermore, the developed, as well as developing countries, have witnessed the growth of SMEs over the past few years, hence, it is expected that the SMEs segment will fuel up the mobile backend service market growth during the forecast period.
This report provides an accurate prediction of the contribution of all the segments to the growth of the mobile backend service market size and actionable market insights on post COVID-19 impact on each segment.
|
Mobile Backend Service Market Scope |
|
|
Report Coverage |
Details |
|
Page number |
120 |
|
Base year |
2020 |
|
Forecast period |
2021-2025 |
|
Growth momentum & CAGR |
Accelerate at a CAGR of 42.34% |
|
Market growth 2021-2025 |
$ 11.57 billion |
|
Market structure |
Fragmented |
|
YoY growth (%) |
35.87 |
|
Regional analysis |
North America, APAC, Europe, MEA, and South America |
|
Performing market contribution |
North America at 40% |
|
Key consumer countries |
US, China, Germany, Japan, and Canada |
|
Competitive landscape |
Leading companies, Competitive strategies, Consumer engagement scope |
|
Key companies profiled |
Alphabet Inc., Apple Inc., Axway Software SA, Convertigo SA, International Business Machines Corp., Kii Corp., Kumulos Ltd, Microsoft Corp., Oracle Corp., and Temenos AG |
|
Market dynamics |
Parent market analysis, Market growth inducers and obstacles, Fast-growing and slow-growing segment analysis, COVID-19 impact and recovery analysis and future consumer dynamics, Market condition analysis for the forecast period |
|
Customization purview |
If our report has not included the data that you are looking for, you can reach out to our analysts and get segments customized. |
What are the Key Data Covered in this Mobile Backend Service Market Report?
- CAGR of the market during the forecast period 2021-2025
- Detailed information on factors that will drive mobile backend service market growth during the next five years
- Precise estimation of the mobile backend service market size and its contribution to the parent market
- Accurate predictions on upcoming trends and changes in consumer behavior
- The growth of the mobile backend service industry across North America, APAC, Europe, MEA, and South America
- A thorough analysis of the market’s competitive landscape and detailed information on vendors
- Comprehensive details of factors that will challenge the growth of mobile backend service market vendors
We can help! Our analysts can customize this report to meet your requirements. Get in touch


