
Mobile Communication Antenna Market Size 2025-2029
The mobile communication antenna market size is forecast to increase by USD 1.96 billion at a CAGR of 4.4% between 2024 and 2029.
- The market is witnessing significant growth due to the increasing demand for advanced wireless connectivity in various industries, including industrial automation, satellite communication, and aviation. The proliferation of smartphones and the Internet of Things (IoT) is driving the market, as these devices rely on wireless antennas for radio frequency communication and GPS connectivity. Additionally, the development of 5G technology and the integration of power semiconductors in antenna designs are expected to further boost market growth. Furthermore, the integration of artificial intelligence, machine learning, and data analytics in wireless communication systems is creating new opportunities for mobile communication antennas in applications such as electronic warfare and big data analytics. Overall, the market is poised for strong growth in the coming years, as wireless connectivity becomes increasingly essential in various industries and applications.
What will be the Size of the Mobile Communication Antenna Market During the Forecast Period?

- The market encompasses a diverse range of wireless antenna solutions employed in various industries, including the smartphone industry and telecom infrastructure. Market dynamics are driven by the increasing demand for high-speed internet services and the deployment of advanced network technologies, such as 5G networks. Consumers' growing income and the proliferation of connected devices fuel market expansion. Beyond the wireless communications sector, mobile communication antennas find applications in industrial automation, commercial wide-body aircraft, and geosynchronous and non-geosynchronous satellite systems.
- Market participants include US-based electronics businesses, focusing on the electronic systems segment, which encompasses industrial, defense, and aerospace applications. Additionally, the market caters to the needs of industry participants in the areas of electro-optical sensors, flight controls, data links, and persistent surveillance capabilities. Overall, the market is poised for continued growth, underpinned by the increasing reliance on wireless connectivity across various industries.
How is this Mobile Communication Antenna Industry segmented and which is the largest segment?
The mobile communication antenna industry research report provides comprehensive data (region-wise segment analysis), with forecasts and estimates in "USD billion" for the period 2025-2029, as well as historical data from 2019-2023 for the following segments.
- Product
- Macrocells
- Smallcells
- Type
- Directional antennas
- Omnidirectional antennas
- Application
- Base stations
- Mobile devices
- IoT devices
- Satellite communication
- Geography
- APAC
- China
- India
- Japan
- South Korea
- North America
- Canada
- US
- Europe
- Germany
- UK
- France
- South America
- Middle East and Africa
- APAC
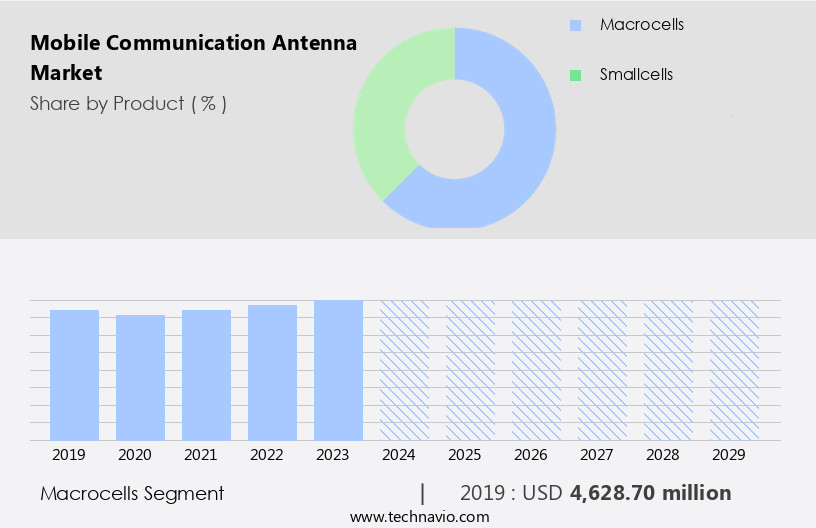
By Product Insights
- The macrocells segment is estimated to witness significant growth during the forecast period.
Macrocells, a crucial component of mobile communication networks, provide radio coverage to larger areas and larger user bases than small cells. These high-power cell sites utilize large antennas mounted on masts or rooftops for optimal signal transmission. Transmitting signals 5-10 times more intense than small cells, macrocells are integrating power semiconductor-based components, such as high-power Gallium Nitride (GaN) RF amplifiers, to enhance their capabilities. With the expansion of high-speed internet services and the increasing demand for mobile connectivity, the market for wireless antennas, including those used in macrocells, is experiencing significant growth. Key market participants include USA-based electronics businesses and international competitors.
The electronic systems segment, which includes wireless antennas, is a significant contributor to this market's growth. Macrocells are deployed in various industries, including telecom infrastructure, smartphone industry, industrial automation, commercial wide-body aircraft, and railroads. The integration of 5G networks, IoT, automotive industries, and technological advancements in industries like aviation, vehicles, and IT is further fueling market expansion. Moderately priced antennas catering to the increasing demand for cost-efficiency are also gaining popularity. The global market for wireless antennas is expected to continue its growth trajectory due to the increasing need for mobile communication, safety, and network infrastructure improvements.
Get a glance at the market report of share of various segments Request Free Sample
The macrocells segment was valued at USD 4.63 billion in 2019 and showed a gradual increase during the forecast period.
Regional Analysis
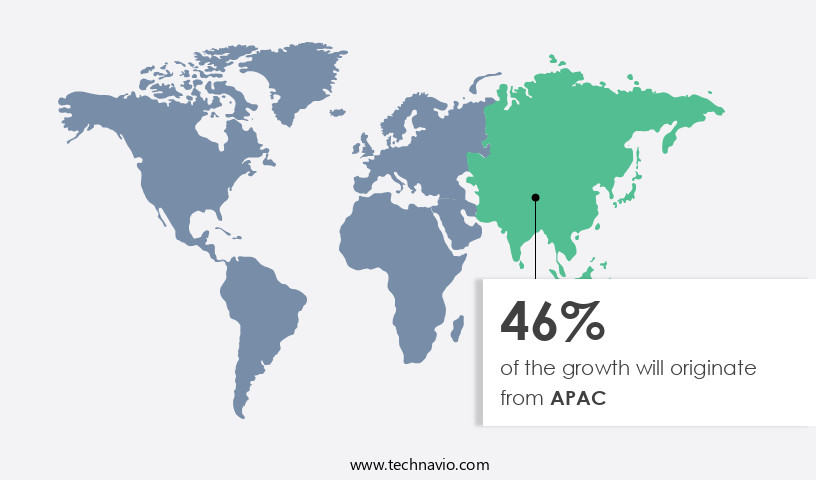
- APAC is estimated to contribute 46% to the growth of the global market during the forecast period.
Technavio's analysts have elaborately explained the regional trends and drivers that shape the market during the forecast period.
For more insights on the market size of various regions, Request Free Sample
The Asia Pacific (APAC) region leads The market due to the substantial penetration of smartphones and the rising number of unique mobile subscribers. Notably, China Mobile, headquartered in APAC, reported over 985 million mobile customers in June 2023, reflecting the extensive adoption of mobile phones, including smartphones, in the region. The increasing use of Internet of Things (IoT) devices in APAC is anticipated to escalate during the forecast period, resulting in significant mobile data traffic. Moreover, the expansion of high-speed internet services and the deployment of 5G networks will further fuel the demand for mobile communication antennas. Key market participants include USA-based electronics businesses specializing in the electronic systems segment, focusing on the production of wireless antennas for various applications, such as base station antennas, FDD-LTE, TDD-LTE, variable tilt antennas, and 4G antennas.
Additionally, industrial automation, commercial wide-body aircraft, geosynchronous satellite systems, and non-geosynchronous satellite systems are other significant end-users of mobile communication antennas. The market is expected to grow due to the increasing need for cost-efficient telecom and network infrastructure, as well as technological advancements in wireless antennas, including iCDL, WiMAX, RADAR systems, cellular vehicle connectivity innovations, and safety features. The use of wireless antennas in land mobile radio systems, laptops, and wireless sensors is also increasing, as these devices require reliable and high-performance antennas for seamless connectivity.
Market Dynamics
Our researchers analyzed the data with 2024 as the base year, along with the key drivers, trends, and challenges. A holistic analysis of drivers will help companies refine their marketing strategies to gain a competitive advantage.
What are the key market drivers leading to the rise in the adoption of Mobile Communication Antenna Industry?
Increasing demand for smart devices is the key driver of the market.
- The market is experiencing significant growth due to the increasing adoption of smart devices, particularly in the smartphone industry. To cater to the communication needs of these devices, smartphone OEMs are integrating advanced technologies for M2M communication and launching supporting services. High-speed internet services have become essential for smart devices to function efficiently, leading to the deployment of telecom infrastructure, including small cells and macrocells, to meet the increasing bandwidth demand. Additionally, the expansion of 5G networks, industrial automation, and commercial wide-body aircraft are driving the demand for wireless antennas. Market participants are focusing on producing modestly priced antennas to cater to the mass market, while also investing in technological advancements such as artificial intelligence (AI) and variable tilt antennas to enhance network performance.
- Furthermore, the growth of the market is fueled by the increasing adoption of wireless LAN systems, WiMAX, RADAR systems, cellular vehicle connectivity innovations, and the IoT in various industries, including the automotive, IT, and telecom sectors. The market is expected to continue growing due to the cost-efficiency and technological advancements in wireless communication systems, as well as potential trade agreements that may facilitate global market expansion.
What are the market trends shaping the Mobile Communication Antenna Industry?
Focus on development of smart cities is the upcoming market trend.
- The wireless antenna market plays a pivotal role in enabling high-speed internet services for various industries, including the smartphone industry, smart cities, industrial automation, commercial wide-body aircraft, and railroads. Market participants are focusing on deploying advanced wireless antenna technologies to cater to the increasing demand for mobile communication and connectivity. These antennas support various wireless communication standards such as FDD-LTE, TDD-LTE, 4G, LTE, and 5G networks. The market is witnessing significant growth due to the increasing adoption of smart devices, IoT, and vehicle connectivity innovations. The demand for modestly priced antennas is also increasing in the IT industry, data centers, and telecom networks, where cost-efficiency is a key consideration.
- Market participants are investing in research and development to introduce technological advancements, such as variable tilt antennas, omnidirectional antennas, directional antennas, and indoor antennas. Moreover, the deployment of geosynchronous and non-geosynchronous satellite systems is driving the demand for wireless antennas in aviation, vehicles, radar systems, tablets, laptops, and WiMAX. The market is also witnessing growth in the production capacity of wireless antennas to cater to the increasing demand from various industries. The market dynamics are influenced by factors such as cost-efficiency, trade agreements, and technological advancements.
What challenges does the Mobile Communication Antenna Industry face during its growth?
Increasing investments in wired communication technologies is a key challenge affecting the industry growth.
- The wireless antenna market is experiencing significant growth due to the expanding smartphone industry and increasing demand for high-speed internet services among consumers. Market participants are focusing on deploying advanced antenna technologies to enhance network infrastructure and support the rollout of 5G networks. Industrial automation, commercial wide-body aircraft, and the telecom industry are key sectors driving the market's growth. Geosynchronous and non-geosynchronous satellite systems, as well as wireless antennas for iCDL systems, are essential components of this market. Wireless antennas are used in various applications, including base station antennas, FDD-LTE and TDD-LTE, variable tilt antennas, 4G antennas, LTE antennas, and 20, 40, and 80 MHz channels for wireless LAN systems.
- Smart devices, such as tablets and laptops, also require antennas for WiMAX, RADAR systems, and cellular vehicle connectivity innovations. Omnidirectional and directional antennas, as well as indoor antennas, are crucial for providing optimal coverage and signal strength. International competitors are intensifying competition in the market, leading to advancements in technology, such as artificial intelligence (AI) and machine learning, to improve antenna performance and cost-efficiency. Antennas are also used in various industries, including aviation, vehicles, radar systems, and the IT industry for data centers, big data analytics, and cloud-based services. Tower occupancy and production capacity are essential factors influencing the market's growth. Transducers, radio signals, and radiofrequency (RF) electromagnetic waves are the fundamental technologies driving the wireless antenna market.
Exclusive Customer Landscape
The mobile communication antenna market forecasting report includes the adoption lifecycle of the market, market growth and forecasting, covering from the innovator's stage to the laggard's stage. It focuses on adoption rates in different regions based on penetration. Furthermore, the mobile communication antenna market report also includes key purchase criteria and drivers of price sensitivity to help companies evaluate and develop their market growth analysis strategies.

Customer Landscape
Key Companies & Market Insights
Companies are implementing various strategies, such as strategic alliances, mobile communication antenna market forecast, partnerships, mergers and acquisitions, geographical expansion, and product/service launches, to enhance their presence in the industry.
Alpha Wireless Ltd.: The company offers mobile communication antenna such as AW3913 E F dualband small cell tri sector antenna, AWL3964 T0 C multiband omnidirectional canister antenna, AW3941 T0 F omnidirectional antenna and more.
The industry research and growth report includes detailed analyses of the competitive landscape of the market and information about key companies, including:
- Abracon LLC
- Alpha Wireless Ltd.
- Amphenol Corp.
- Antenova Ltd.
- AT and T Inc.
- Cisco Systems Inc.
- Comba Telecom Systems Holdings Ltd.
- CommScope Holding Co. Inc.
- DuPont de Nemours Inc.
- Huawei Technologies Co. Ltd.
- Johanson Technology Inc.
- Koch Industries Inc.
- Mobile Mark Inc.
- Qualcomm Inc.
- Siretta Ltd.
- Taoglas Group Holdings Ltd.
- TE Connectivity Ltd.
- Telefonaktiebolaget LM Ericsson
- Wistron NeWeb Corp
- Yageo Corp.
Qualitative and quantitative analysis of companies has been conducted to help clients understand the wider business environment as well as the strengths and weaknesses of key industry players. Data is qualitatively analyzed to categorize companies as pure play, category-focused, industry-focused, and diversified; it is quantitatively analyzed to categorize companies as dominant, leading, strong, tentative, and weak.
Research Analyst Overview
The market is a dynamic and evolving industry, driven by the increasing demand for high-speed internet services and the proliferation of smart devices. The market is characterized by continuous advancements in technology and the expansion of network infrastructure to support the growing needs of consumers and various industries. The smartphone industry plays a significant role in the market's growth, as the increasing penetration of smartphones drives the demand for better wireless connectivity. Consumers' income levels and the availability of affordable antenna options are also crucial factors influencing market dynamics. Network infrastructure and telecom infrastructure are two essential segments of the market. The deployment of 5G networks is a significant trend in the telecom infrastructure segment, as it offers faster data transfer rates and lower latency. In the network infrastructure segment, industrial automation and the use of wireless antennas in commercial wide-body aircraft are emerging applications. The market participants include US-based electronics businesses and international competitors, with the electronic systems segment being a significant contributor to the market's growth. The segment includes applications in various industries such as defense, aerospace, and transportation. Geosynchronous satellite systems and non-geosynchronous satellite systems are two essential types of satellite communication systems that utilize wireless antennas.
These systems are used in various applications, including aviation, vehicles, radar systems, and data links. The production capacity of wireless antennas is a critical factor influencing market dynamics. The development of moderately priced antennas and the integration of artificial intelligence (AI) in antenna systems are trends that are expected to drive market growth. Mobile communication antennas find applications in various industries, including railroads, and are essential components of wireless lan systems, smart devices, and IoT applications. Omnidirectional antennas and directional antennas are two common types of wireless antennas, with the former providing coverage in all directions and the latter focusing on specific directions. Indoor antennas are another type of wireless antenna that is gaining popularity due to the increasing use of wireless communication systems in buildings and homes. The market for wireless antennas is expected to continue growing due to technological advancements in the IT industry, data centers, big data analytics, and cloud-based services. Cost-efficiency and trade agreements are two essential factors influencing the market's competitiveness. The market is expected to face challenges due to the increasing competition and the need for cost-effective solutions.
Thus, the market is a dynamic and evolving industry driven by the increasing demand for high-speed internet services and the proliferation of smart devices. The market is characterized by continuous technological advancements and the expansion of network infrastructure to support the growing needs of various industries. The market participants include US-based electronics businesses and international competitors, with the electronic systems segment being a significant contributor to the market's growth. The market is expected to continue growing due to the increasing use of wireless communication systems in various industries and the development of cost-effective solutions.
|
Market Scope |
|
|
Report Coverage |
Details |
|
Page number |
223 |
|
Base year |
2024 |
|
Historic period |
2019-2023 |
|
Forecast period |
2025-2029 |
|
Growth momentum & CAGR |
Accelerate at a CAGR of 4.4% |
|
Market growth 2025-2029 |
USD 1.96 billion |
|
Market structure |
Fragmented |
|
YoY growth 2024-2025(%) |
4.2 |
|
Key countries |
US, China, Japan, India, South Korea, Canada, UK, Germany, Australia, and France |
|
Competitive landscape |
Leading Companies, Market Positioning of Companies, Competitive Strategies, and Industry Risks |
What are the Key Data Covered in this Mobile Communication Antenna Market Research and Growth Report?
- CAGR of the Mobile Communication Antenna industry during the forecast period
- Detailed information on factors that will drive the growth and forecasting between 2025 and 2029
- Precise estimation of the size of the market and its contribution of the industry in focus to the parent market
- Accurate predictions about upcoming growth and trends and changes in consumer behaviour
- Growth of the market across APAC, North America, Europe, South America, and Middle East and Africa
- Thorough analysis of the market's competitive landscape and detailed information about companies
- Comprehensive analysis of factors that will challenge the mobile communication antenna market growth of industry companies
We can help! Our analysts can customize this mobile communication antenna market research report to meet your requirements.