
Mobile Crane Market Analysis, Size, and Forecast 2026-2030: APAC (China, Japan, and India), Europe (Germany, UK, and France), North America (US, Canada, and Mexico), South America (Brazil, Argentina, and Chile), Middle East and Africa (Saudi Arabia, UAE, and South Africa), and Rest of World (ROW)

Mobile Crane Market Analysis, Size, and Forecast 2026-2030:
APAC (China, Japan, and India), Europe (Germany, UK, and France), North America (US, Canada, and Mexico), South America (Brazil, Argentina, and Chile), Middle East and Africa (Saudi Arabia, UAE, and South Africa), and Rest of World (ROW)

Published: Oct 2026 318 Pages SKU: IRTNTR44876

Market Overview at a Glance

$11.61 B
Market Opportunity
7.3%
CAGR 2025 - 2030
58.7%
APAC Growth
$10.74 B
Truck mounted crane segment 2024

Mobile Crane Market Size 2026-2030

The mobile crane market size is valued to increase by USD 11.61 billion, at a CAGR of 7.3% from 2025 to 2030. Rapid infrastructure development and public spending on civil works will drive the mobile crane market.

Major Market Trends & Insights

  • APAC dominated the market and accounted for a 58.7% growth during the forecast period.
  • By Type - Truck mounted crane segment was valued at USD 10.74 billion in 2024
  • By Application - Construction segment accounted for the largest market revenue share in 2024

Market Size & Forecast

  • Market Opportunities: USD 18.54 billion
  • Market Future Opportunities: USD 11.61 billion
  • CAGR from 2025 to 2030 : 7.3%

Market Summary

  • The Mobile Crane Market operates as a highly dynamic segment essential to infrastructure development and industrial material handling. The market experiences continuous structural expansion driven by massive public investments in civil engineering projects and the transition toward utility-scale renewable energy networks.
  • A primary driver of this demand is the widespread adoption of modular construction assembly, which forces contractors to lift prefabricated components weighing over 50 tons, directly accelerating the procurement of high-capacity models featuring telescopic boom extension capabilities.
  • Conversely, stringent environmental mandates present a critical challenge, as compliance with rigid emission standards requires substantial capital expenditure to retrofit legacy fleets with zero-emission drivetrains. In response to occupational safety mandates, fleet operators increasingly deploy hybrid propulsion systems and automated outrigger leveling technologies to execute complex lifts safely.
  • For example, integrating remote telemetry systems allows logistics managers to track operational metrics across scattered jobsites, reducing unplanned equipment downtime by up to 25% compared to reactive maintenance models. This transition toward intelligent, data-driven lifting platforms fundamentally optimizes project timelines and stabilizes operational overhead across demanding industrial environments.

What will be the Size of the Mobile Crane Market during the forecast period?
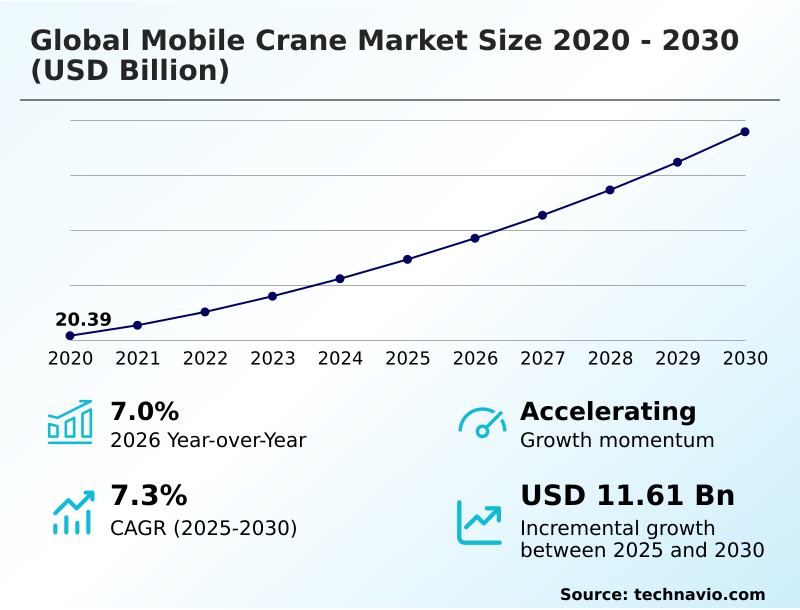
Get Key Insights on Market Forecast (PDF) Get Free Sample

How is the Mobile Crane Market Segmented?

The mobile crane industry research report provides comprehensive data (region-wise segment analysis), with forecasts and estimates in "USD million" for the period 2026-2030, as well as historical data from 2020-2024 for the following segments.

  • Type
    • Truck mounted crane
    • Trailer mounted crane
    • Crawler crane
  • Application
    • Construction
    • Industrial
    • Utilities
  • Capacity
    • Upto 50 ton
    • Above 200 ton
    • More than 51 to 100 ton
    • More than 101 to 200 ton
  • Product type
    • Telescopic boom
    • Lattice boom
  • Geography
    • APAC
      • China
      • Japan
      • India
      • South Korea
      • Australia
      • Indonesia
    • Europe
      • Germany
      • UK
      • France
      • Italy
      • Spain
      • The Netherlands
    • North America
      • US
      • Canada
      • Mexico
    • South America
      • Brazil
      • Argentina
      • Chile
    • Middle East and Africa
      • Saudi Arabia
      • UAE
      • South Africa
      • Israel
      • Turkey

By Type Insights

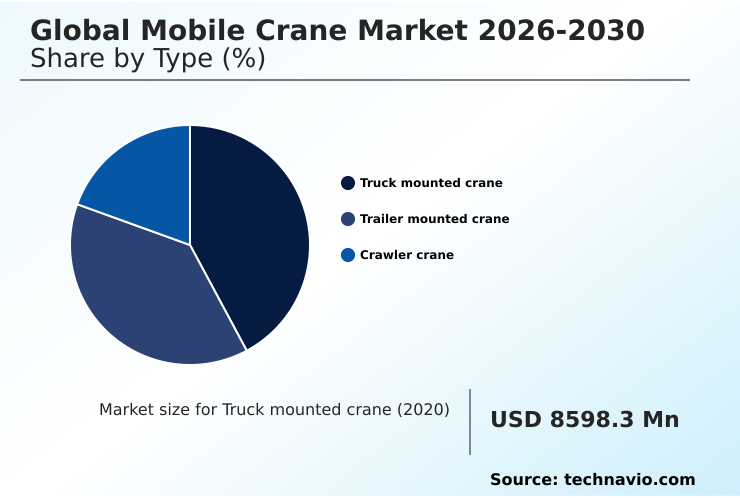
The truck mounted crane segment is estimated to witness significant growth during the forecast period.

Truck-mounted mobile cranes dominate regional logistics and civil engineering due to their high transit autonomy and rapid deployment capabilities across distributed jobsites.

Integrating a complete hydraulic lifting apparatus onto a heavy-duty commercial truck chassis allows these units to travel at standard highway speeds, drastically reducing transport lead times.

By utilizing variable displacement hydraulic pumps and advanced load-moment indicators, operators achieve precise positioning and enhanced fuel efficiency during urban infrastructure rehabilitation projects.

This agility improves inter-site deployment speeds by over 25% compared to traditional stationary alternatives, directly lowering on-site labor overhead. As commercial real estate development accelerates, fleet owners increasingly invest in these versatile configurations to optimize asset rotation.

The capacity to execute high-capacity lifts and immediately demobilize without specialized multi-axle trailers ensures sustained operational impact across the construction sector.
Get Free Sample

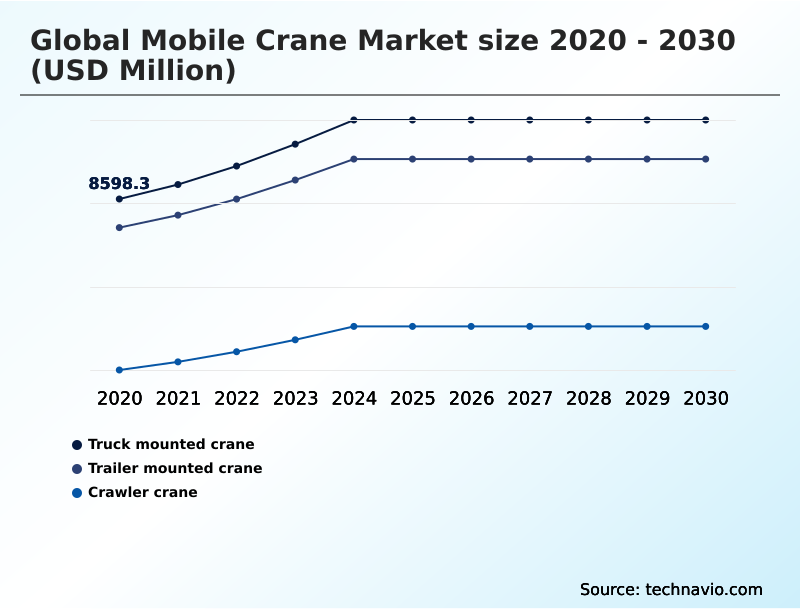
The Truck mounted crane segment was valued at USD 10.74 billion in 2024 and showed a gradual increase during the forecast period.
Get Free Sample

Regional Analysis

APAC is estimated to contribute 58.7% to the growth of the global market during the forecast period.Technavio’s analysts have elaborately explained the regional trends and drivers that shape the market during the forecast period.
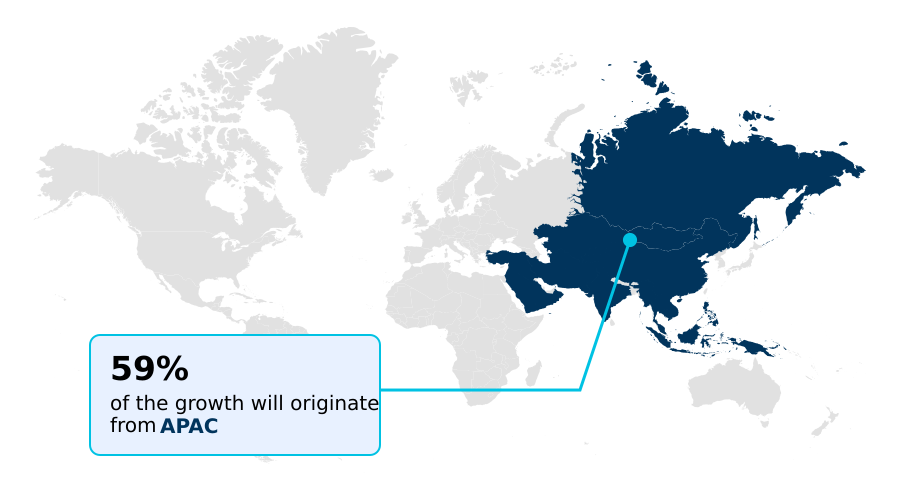
See How Mobile Crane Market Demand is Rising in APAC Get Free Sample

The geographic landscape of the Mobile Crane Market reflects distinct regional procurement strategies driven by varying infrastructure and regulatory demands. The APAC region commands the highest volume of demand, expanding rapidly due to relentless urbanization and massive deep-water port expansions.

Contractors in APAC aggressively deploy units with heavy-duty undercarriage systems and lattice boom structures to manage massive structural steel installations.

Conversely, the European market prioritizes sustainability, shifting heavily toward compact, electrified cranes to comply with ultra-low emission zones, achieving up to a 30% reduction in urban noise pollution.

While APAC emphasizes raw lifting capacity for heavy manufacturing facilities and petrochemical refinery maintenance, Europe leverages predictive fleet analytics to optimize asset lifecycles and strictly adhere to environmental mandates.

This distinct divergence highlights how localized operational constraints shape equipment modernization, forcing manufacturers to balance raw mechanical power in emerging economies with sophisticated, eco-friendly digital integrations across mature Western infrastructure sectors.

Market Dynamics

Our researchers analyzed the data with 2025 as the base year, along with the key drivers, trends, and challenges. A holistic analysis of drivers will help companies refine their marketing strategies to gain a competitive advantage.

  • The rapid evolution of the Mobile Crane Market highlights a profound shift toward intelligent, highly specialized material handling equipment. As global infrastructure initiatives become increasingly complex, large-scale contractors are aggressively deploying high-capacity all-terrain lifting platforms to navigate rugged topographies without compromising substantial vertical reach or payload stability.
  • The growing reliance on off-site prefabrication directly amplifies the demand for modular building mobile crane solutions, which streamline on-site assembly processes and reduce structural framing timelines by nearly 30% compared to traditional on-site fabrication methods.
  • Simultaneously, municipalities enforcing strict noise and air quality regulations are compelling equipment rental fleets to integrate zero-emission urban construction machinery, ensuring continuous operation inside enclosed commercial zones without violating environmental mandates.
  • In the renewable energy sector, the scaling of onshore and offshore wind farms necessitates robust wind turbine installation heavy equipment capable of securely hoisting massive generator nacelles to extreme elevations. To oversee these complex mechanical assets, fleet managers increasingly depend on advanced telematics in heavy lifting, optimizing preventative maintenance schedules and mitigating unpredictable mechanical failures across remote geographic sites.
  • By continuously monitoring load variables and fuel consumption rates, these intelligent digital ecosystems enable contractors to execute precise, safe lifting operations while extending the operational longevity of capital-intensive fleets.
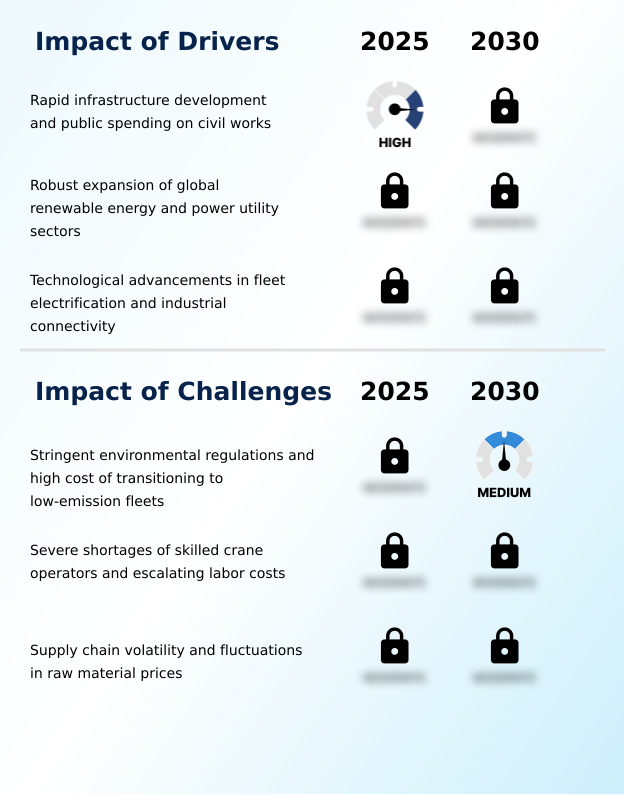
What are the key market drivers leading to the rise in the adoption of Mobile Crane Industry?

  • Rapid infrastructure development and substantial public spending on civil works serve as primary catalysts driving market expansion.

  • Massive investments in public infrastructure and renewable energy networks serve as the primary drivers propelling the Mobile Crane Market.
  • The escalating reliance on modular construction assembly forces commercial contractors to lift prefabricated components weighing well over 50 tons, directly necessitating machinery with robust structural steel erection capabilities.
  • Concurrently, the rapid deployment of high-capacity onshore wind farms requires versatile equipment capable of hoisting heavy generator nacelles to extreme heights, improving project execution speeds by 30% over traditional stationary solutions.
  • To accommodate these extreme payloads on unpaved terrain, modern cranes utilize complex multi-axle chassis designs and advanced load-moment indicators.
  • These critical engineering enhancements increase jobsite spatial efficiency by 15%, ensuring that heavy material handling tasks proceed swiftly, safely, and seamlessly across densely populated and remote environments alike.

What are the market trends shaping the Mobile Crane Industry?

  • The accelerated integration of telematics and artificial intelligence-driven predictive fleet analytics represents a defining market trend. This technological evolution fundamentally shifts fleet maintenance from reactive repairs to proactive asset management strategies.

  • The accelerated integration of predictive fleet analytics represents a transformative trend fundamentally altering the Mobile Crane Market. As infrastructure projects scale in complexity, fleet administrators deploy advanced telematics ecosystem monitoring to transition from reactive repairs to proactive asset lifecycle management.
  • This digital shift allows centralized engineering teams to track load stress and engine health across multiple jobsites using remote telemetry systems, thereby reducing unplanned mechanical downtime by 25%. Furthermore, the aggressive pursuit of carbon neutrality targets has sparked the widespread adoption of battery-powered lifting units within noise-sensitive metropolitan zones.
  • This structural electrification not only ensures compliance with rigid municipal emission mandates but also lowers localized energy consumption costs by up to 20% compared to legacy diesel powertrains. Consequently, these technological shifts empower commercial contractors to optimize fleet utilization rates while significantly enhancing overall operational safety.

What challenges does the Mobile Crane Industry face during its growth?

  • Stringent environmental regulations and the high capital costs associated with transitioning to low-emission fleets present critical challenges restraining industry growth.

  • Stringent environmental policies and severe shortages of certified operators act as structural challenges constraining the Mobile Crane Market. Regulatory authorities continually enforce strict emission regulations, compelling manufacturers to re-engineer traditional combustion engines into expensive zero-emission drivetrains. This mandatory transition forces equipment rental firms to absorb a 25% increase in upfront capital procurement costs, heavily compressing operational profit margins.
  • Furthermore, operating advanced heavy material handling machinery requires extensive technical training, and the ongoing labor deficit directly extends project timelines by up to 15%.
  • To mitigate these escalating labor and compliance costs, fleet managers are pressured to adopt hybrid propulsion systems and implement proactive asset lifecycle management software, though the initial integration of these complex digital tools remains financially burdensome for mid-sized regional contractors.

Exclusive Technavio Analysis on Customer Landscape

The mobile crane market forecasting report includes the adoption lifecycle of the market, covering from the innovator’s stage to the laggard’s stage. It focuses on adoption rates in different regions based on penetration. Furthermore, the mobile crane market report also includes key purchase criteria and drivers of price sensitivity to help companies evaluate and develop their market growth analysis strategies.
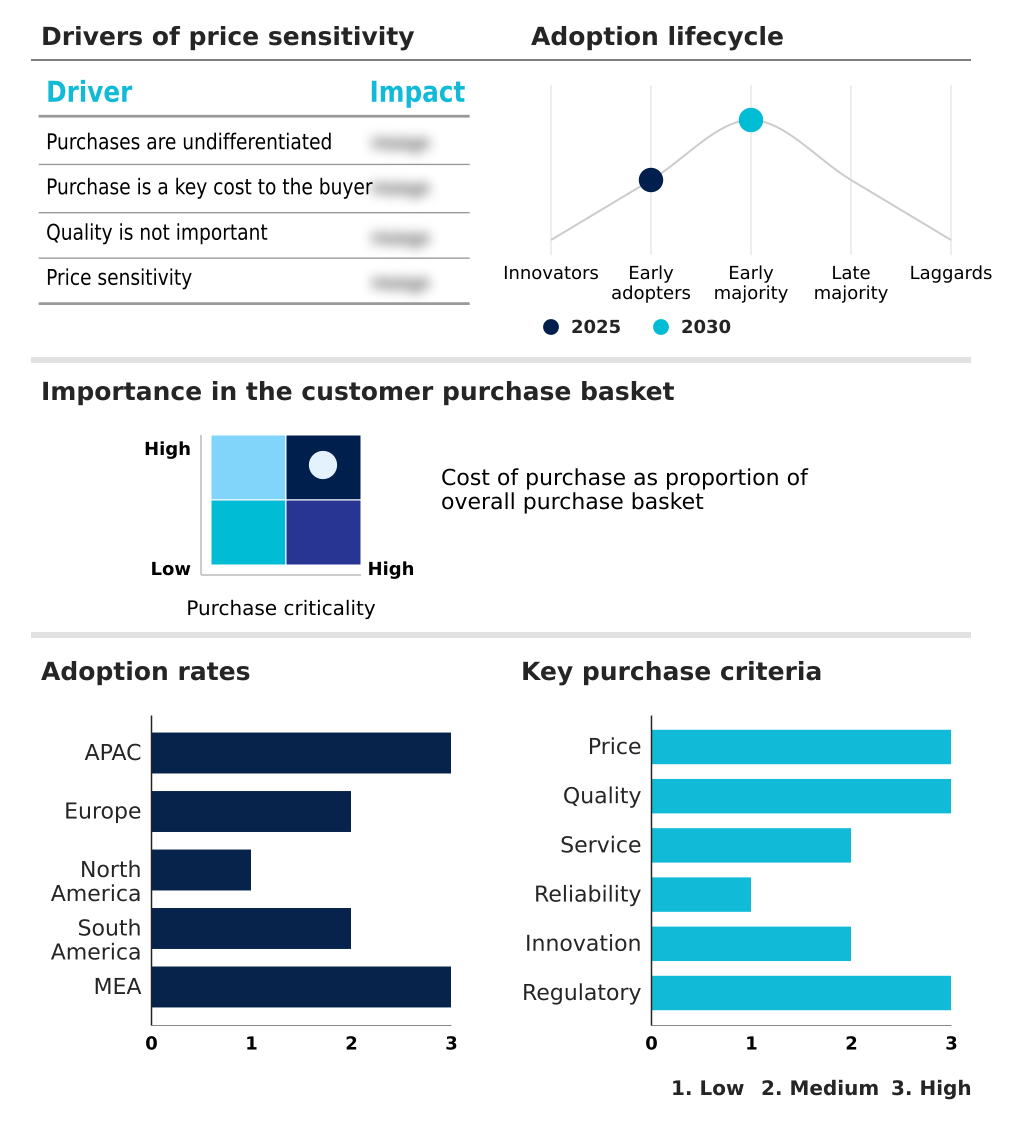
Customer Landscape of Mobile Crane Industry

Competitive Landscape

Companies are implementing various strategies, such as strategic alliances, mobile crane market forecast, partnerships, mergers and acquisitions, geographical expansion, and product/service launches, to enhance their presence in the industry.

Action Construction Equipment - High-capacity mobile cranes engineered for heavy lifting operations across civil engineering, power, and industrial construction sectors to optimize material handling efficiency and maximize overall project execution speed.

The industry research and growth report includes detailed analyses of the competitive landscape of the market and information about key companies, including:

  • Action Construction Equipment
  • Broderson Manufacturing Corp.
  • JMG Cranes S.p.A
  • KATO WORKS CO. LTD.
  • Kobelco Construction Machinery
  • Liebherr International AG
  • Link Belt Cranes
  • Liugong Machinery Co. Ltd.
  • LOCATELLI CRANE Srl
  • Maeda Seisakusho Co. Ltd.
  • Manitowoc Co Inc.
  • Ormig S.p.A.
  • PALFINGER AG
  • Sany Heavy Industry Co. Ltd.
  • SENNEBOGEN Maschinenfabrik GmbH
  • Spierings Mobile Cranes B.V.
  • Tadano Ltd.
  • Terex Corp.
  • XCMG Group
  • Zoomlion Industry Co. Ltd.

Qualitative and quantitative analysis of companies has been conducted to help clients understand the wider business environment as well as the strengths and weaknesses of key industry players. Data is qualitatively analyzed to categorize companies as pure play, category-focused, industry-focused, and diversified; it is quantitatively analyzed to categorize companies as dominant, leading, strong, tentative, and weak.

Recent Development and News in Mobile crane market

  • In the Construction Machinery and Heavy Transportation Equipment industry, the implementation of strict emission regulations has forced manufacturers to re-engineer diesel powertrains, directly impacting Mobile Crane demand by accelerating the adoption of battery-powered lifting units that reduce jobsite carbon footprints by over 40%.
  • The rapid expansion of mega-scale transport networks and smart city initiatives has shifted equipment procurement strategies, fundamentally driving Mobile Crane demand as contractors require highly maneuverable machinery capable of navigating narrow urban corridors with a 15% increase in spatial efficiency.
  • Massive investments in clean energy grid modernization and high-capacity onshore wind infrastructure have structurally altered heavy material handling requirements, compelling the Mobile Crane market to prioritize ultra-high-capacity lifting platforms that safely elevate heavy nacelles to extreme heights.
  • Escalating operational overhead and occupational safety mandates across heavy manufacturing facilities have driven the integration of proactive asset lifecycle management software, boosting Mobile Crane utilization rates by 20% through remote telemetry systems that proactively eliminate unplanned mechanical failures.

Dive into Technavio’s robust research methodology, blending expert interviews, extensive data synthesis, and validated models for unparalleled Mobile Crane Market insights. See full methodology.

Market Scope
Page number 318
Base year 2025
Historic period 2020-2024
Forecast period 2026-2030
Growth momentum & CAGR Accelerate at a CAGR of 7.3%
Market growth 2026-2030 USD 11607.9 million
Market structure Fragmented
YoY growth 2025-2026(%) 7.0%
Key countries China, Japan, India, South Korea, Australia, Indonesia, Germany, UK, France, Italy, Spain, The Netherlands, US, Canada, Mexico, Brazil, Argentina, Chile, Saudi Arabia, UAE, South Africa, Israel and Turkey
Competitive landscape Leading Companies, Market Positioning of Companies, Competitive Strategies, and Industry Risks

Request Free Sample

Research Analyst Overview

  • The Mobile Crane Market continues to evolve as an indispensable component of heavy industrial expansion, transitioning rapidly from mechanical workhorses to sophisticated, data-driven platforms. Industry participants heavily integrate intelligent electric crane technology and automated safety overrides to address strict occupational safety mandates and environmental compliance protocols.
  • By leveraging high-tensile steel alloys, modern machinery significantly reduces chassis deadweight while enhancing maximum lifting capacities. The strategic implementation of telematics ecosystem monitoring provides operators with continuous stability monitoring, delivering an 18% improvement in structural alignment accuracy during critical lifts.
  • Furthermore, advanced heavy-duty crawler models featuring robust pick-and-carry capability allow contractors to transport massive suspended payloads directly across challenging terrain, eliminating the need for sequential stationary lifts. Fleet administrators rely on these technological integrations to mitigate operational risks and align capital expenditure with corporate sustainability targets.
  • These combined mechanical and digital advancements establish a resilient foundation for long-term operational efficiency, ensuring that complex civil and commercial projects maintain aggressive completion schedules while strictly adhering to evolving safety standards.

What are the Key Data Covered in this Mobile Crane Market Research and Growth Report?

  • What is the expected growth of the Mobile Crane Market between 2026 and 2030?

    • USD 11.61 billion, at a CAGR of 7.3%

  • What segmentation does the market report cover?

    • The report is segmented by Type (Truck mounted crane, Trailer mounted crane, and Crawler crane), Application (Construction, Industrial, and Utilities), Capacity (Upto 50 ton, Above 200 ton, More than 51 to 100 ton, and More than 101 to 200 ton), Product Type (Telescopic boom, and Lattice boom) and Geography (APAC, Europe, North America, South America, Middle East and Africa)

  • Which regions are analyzed in the report?

    • APAC, Europe, North America, South America and Middle East and Africa

  • What are the key growth drivers and market challenges?

    • Rapid infrastructure development and public spending on civil works, Stringent environmental regulations and high cost of transitioning to low-emission fleets

  • Who are the major players in the Mobile Crane Market?

    • Action Construction Equipment, Broderson Manufacturing Corp., JMG Cranes S.p.A, KATO WORKS CO. LTD., Kobelco Construction Machinery, Liebherr International AG, Link Belt Cranes, Liugong Machinery Co. Ltd., LOCATELLI CRANE Srl, Maeda Seisakusho Co. Ltd., Manitowoc Co Inc., Ormig S.p.A., PALFINGER AG, Sany Heavy Industry Co. Ltd., SENNEBOGEN Maschinenfabrik GmbH, Spierings Mobile Cranes B.V., Tadano Ltd., Terex Corp., XCMG Group and Zoomlion Industry Co. Ltd.

Market Research Insights

  • The Mobile Crane Market serves as a foundational enabler of modern infrastructure, adapting rapidly to support commercial real estate development and complex civil engineering projects. As project timelines compress, fleet administrators rely on versatile lifting machinery to enhance supply chain resilience.
  • The transition toward high-capacity models facilitates offshore wind installation, yielding a 20% improvement in component assembly speeds compared to legacy stationary equipment. Concurrently, alignment with strict carbon neutrality targets has accelerated the deployment of electrified mobile cranes, resulting in a 35% reduction in localized fuel expenditures for major contractors.
  • By integrating automated load monitoring systems, operators have also decreased critical lifting errors by 18%. These measurable operational efficiency gains establish mobile cranes as indispensable assets for optimizing complex industrial workflows globally.

We can help! Our analysts can customize this mobile crane market research report to meet your requirements.

Get in touch

1. Executive Summary

1.1 Market overview

Executive Summary - Chart on Market Overview
Executive Summary - Data Table on Market Overview
Executive Summary - Chart on Global Market Characteristics
Executive Summary - Chart on Market by Geography
Executive Summary - Chart on Market Segmentation by Type
Executive Summary - Chart on Market Segmentation by Application
Executive Summary - Chart on Market Segmentation by Capacity
Executive Summary - Chart on Market Segmentation by Product Type
Executive Summary - Chart on Incremental Growth
Executive Summary - Data Table on Incremental Growth
Executive Summary - Chart on Company Market Positioning

2. Technavio Analysis

2.1 Analysis of price sensitivity, lifecycle, customer purchase basket, adoption rates, and purchase criteria

2.2 Criticality of inputs and Factors of differentiation

Chart on Overview on criticality of inputs and factors of differentiation

2.3 Factors of disruption

Chart on Overview on factors of disruption

2.4 Impact of drivers and challenges

Chart on Impact of drivers and challenges in 2025 and 2030

3. Market Landscape

3.1 Market ecosystem

Chart on Parent Market
Data Table on - Parent Market

3.2 Market characteristics

Chart on Market characteristics analysis

3.3 Value chain analysis

Chart on Value chain analysis

4. Market Sizing

4.1 Market definition

Data Table on Offerings of companies included in the market definition

4.2 Market segment analysis

Market segments

4.3 Market size 2025

4.4 Market outlook: Forecast for 2025-2030

Chart on Global - Market size and forecast 2025-2030 ($ million)
Data Table on Global - Market size and forecast 2025-2030 ($ million)
Chart on Global Market: Year-over-year growth 2025-2030 (%)
Data Table on Global Market: Year-over-year growth 2025-2030 (%)

5. Historic Market Size

5.1 Global Mobile Crane Market 2020 - 2024

Historic Market Size - Data Table on Global Mobile Crane Market 2020 - 2024 ($ million)

5.2 Type segment analysis 2020 - 2024

Historic Market Size - Type Segment 2020 - 2024 ($ million)

5.3 Application segment analysis 2020 - 2024

Historic Market Size - Application Segment 2020 - 2024 ($ million)

5.4 Capacity segment analysis 2020 - 2024

Historic Market Size - Capacity Segment 2020 - 2024 ($ million)

5.5 Product Type segment analysis 2020 - 2024

Historic Market Size - Product Type Segment 2020 - 2024 ($ million)

5.6 Geography segment analysis 2020 - 2024

Historic Market Size - Geography Segment 2020 - 2024 ($ million)

5.7 Country segment analysis 2020 - 2024

Historic Market Size - Country Segment 2020 - 2024 ($ million)

6. Qualitative Analysis

6.1 Impact of AI on global mobile crane market

6.2 Impact of geopolitical conflicts on global mobile crane market

7. Five Forces Analysis

7.1 Five forces summary

Five forces analysis - Comparison between 2025 and 2030

7.2 Bargaining power of buyers

Bargaining power of buyers - Impact of key factors 2025 and 2030

7.3 Bargaining power of suppliers

Bargaining power of suppliers - Impact of key factors in 2025 and 2030

7.4 Threat of new entrants

Threat of new entrants - Impact of key factors in 2025 and 2030

7.5 Threat of substitutes

Threat of substitutes - Impact of key factors in 2025 and 2030

7.6 Threat of rivalry

Threat of rivalry - Impact of key factors in 2025 and 2030

7.7 Market condition

Chart on Market condition - Five forces 2025 and 2030

8. Market Segmentation by Type

8.1 Market segments

Chart on Type - Market share 2025-2030 (%)
Data Table on Type - Market share 2025-2030 (%)

8.2 Comparison by Type

Chart on Comparison by Type
Data Table on Comparison by Type

8.3 Truck mounted crane - Market size and forecast 2025-2030

Chart on Truck mounted crane - Market size and forecast 2025-2030 ($ million)
Data Table on Truck mounted crane - Market size and forecast 2025-2030 ($ million)
Chart on Truck mounted crane - Year-over-year growth 2025-2030 (%)
Data Table on Truck mounted crane - Year-over-year growth 2025-2030 (%)

8.4 Trailer mounted crane - Market size and forecast 2025-2030

Chart on Trailer mounted crane - Market size and forecast 2025-2030 ($ million)
Data Table on Trailer mounted crane - Market size and forecast 2025-2030 ($ million)
Chart on Trailer mounted crane - Year-over-year growth 2025-2030 (%)
Data Table on Trailer mounted crane - Year-over-year growth 2025-2030 (%)

8.5 Crawler crane - Market size and forecast 2025-2030

Chart on Crawler crane - Market size and forecast 2025-2030 ($ million)
Data Table on Crawler crane - Market size and forecast 2025-2030 ($ million)
Chart on Crawler crane - Year-over-year growth 2025-2030 (%)
Data Table on Crawler crane - Year-over-year growth 2025-2030 (%)

8.6 Market opportunity by Type

Market opportunity by Type ($ million)
Data Table on Market opportunity by Type ($ million)

9. Market Segmentation by Application

9.1 Market segments

Chart on Application - Market share 2025-2030 (%)
Data Table on Application - Market share 2025-2030 (%)

9.2 Comparison by Application

Chart on Comparison by Application
Data Table on Comparison by Application

9.3 Construction - Market size and forecast 2025-2030

Chart on Construction - Market size and forecast 2025-2030 ($ million)
Data Table on Construction - Market size and forecast 2025-2030 ($ million)
Chart on Construction - Year-over-year growth 2025-2030 (%)
Data Table on Construction - Year-over-year growth 2025-2030 (%)

9.4 Industrial - Market size and forecast 2025-2030

Chart on Industrial - Market size and forecast 2025-2030 ($ million)
Data Table on Industrial - Market size and forecast 2025-2030 ($ million)
Chart on Industrial - Year-over-year growth 2025-2030 (%)
Data Table on Industrial - Year-over-year growth 2025-2030 (%)

9.5 Utilities - Market size and forecast 2025-2030

Chart on Utilities - Market size and forecast 2025-2030 ($ million)
Data Table on Utilities - Market size and forecast 2025-2030 ($ million)
Chart on Utilities - Year-over-year growth 2025-2030 (%)
Data Table on Utilities - Year-over-year growth 2025-2030 (%)

9.6 Market opportunity by Application

Market opportunity by Application ($ million)
Data Table on Market opportunity by Application ($ million)

10. Market Segmentation by Capacity

10.1 Market segments

Chart on Capacity - Market share 2025-2030 (%)
Data Table on Capacity - Market share 2025-2030 (%)

10.2 Comparison by Capacity

Chart on Comparison by Capacity
Data Table on Comparison by Capacity

10.3 Upto 50 ton - Market size and forecast 2025-2030

Chart on Upto 50 ton - Market size and forecast 2025-2030 ($ million)
Data Table on Upto 50 ton - Market size and forecast 2025-2030 ($ million)
Chart on Upto 50 ton - Year-over-year growth 2025-2030 (%)
Data Table on Upto 50 ton - Year-over-year growth 2025-2030 (%)

10.4 Above 200 ton - Market size and forecast 2025-2030

Chart on Above 200 ton - Market size and forecast 2025-2030 ($ million)
Data Table on Above 200 ton - Market size and forecast 2025-2030 ($ million)
Chart on Above 200 ton - Year-over-year growth 2025-2030 (%)
Data Table on Above 200 ton - Year-over-year growth 2025-2030 (%)

10.5 More than 51 to 100 ton - Market size and forecast 2025-2030

Chart on More than 51 to 100 ton - Market size and forecast 2025-2030 ($ million)
Data Table on More than 51 to 100 ton - Market size and forecast 2025-2030 ($ million)
Chart on More than 51 to 100 ton - Year-over-year growth 2025-2030 (%)
Data Table on More than 51 to 100 ton - Year-over-year growth 2025-2030 (%)

10.6 More than 101 to 200 ton - Market size and forecast 2025-2030

Chart on More than 101 to 200 ton - Market size and forecast 2025-2030 ($ million)
Data Table on More than 101 to 200 ton - Market size and forecast 2025-2030 ($ million)
Chart on More than 101 to 200 ton - Year-over-year growth 2025-2030 (%)
Data Table on More than 101 to 200 ton - Year-over-year growth 2025-2030 (%)

10.7 Market opportunity by Capacity

Market opportunity by Capacity ($ million)
Data Table on Market opportunity by Capacity ($ million)

11. Market Segmentation by Product Type

11.1 Market segments

Chart on Product Type - Market share 2025-2030 (%)
Data Table on Product Type - Market share 2025-2030 (%)

11.2 Comparison by Product Type

Chart on Comparison by Product Type
Data Table on Comparison by Product Type

11.3 Telescopic boom - Market size and forecast 2025-2030

Chart on Telescopic boom - Market size and forecast 2025-2030 ($ million)
Data Table on Telescopic boom - Market size and forecast 2025-2030 ($ million)
Chart on Telescopic boom - Year-over-year growth 2025-2030 (%)
Data Table on Telescopic boom - Year-over-year growth 2025-2030 (%)

11.4 Lattice boom - Market size and forecast 2025-2030

Chart on Lattice boom - Market size and forecast 2025-2030 ($ million)
Data Table on Lattice boom - Market size and forecast 2025-2030 ($ million)
Chart on Lattice boom - Year-over-year growth 2025-2030 (%)
Data Table on Lattice boom - Year-over-year growth 2025-2030 (%)

11.5 Market opportunity by Product Type

Market opportunity by Product Type ($ million)
Data Table on Market opportunity by Product Type ($ million)

12. Customer Landscape

12.1 Customer landscape overview

Analysis of price sensitivity, lifecycle, customer purchase basket, adoption rates, and purchase criteria

13. Geographic Landscape

13.1 Geographic segmentation

Chart on Market share by geography 2025-2030 (%)
Data Table on Market share by geography 2025-2030 (%)

13.2 Geographic comparison

Chart on Geographic comparison
Data Table on Geographic comparison

13.3 APAC - Market size and forecast 2025-2030

Chart on APAC - Market size and forecast 2025-2030 ($ million)
Data Table on APAC - Market size and forecast 2025-2030 ($ million)
Chart on APAC - Year-over-year growth 2025-2030 (%)
Data Table on APAC - Year-over-year growth 2025-2030 (%)
Chart on Regional Comparison - APAC
Data Table on Regional Comparison - APAC

13.3.1 China - Market size and forecast 2025-2030

Chart on China - Market size and forecast 2025-2030 ($ million)
Data Table on China - Market size and forecast 2025-2030 ($ million)
Chart on China - Year-over-year growth 2025-2030 (%)
Data Table on China - Year-over-year growth 2025-2030 (%)

13.3.2 Japan - Market size and forecast 2025-2030

Chart on Japan - Market size and forecast 2025-2030 ($ million)
Data Table on Japan - Market size and forecast 2025-2030 ($ million)
Chart on Japan - Year-over-year growth 2025-2030 (%)
Data Table on Japan - Year-over-year growth 2025-2030 (%)

13.3.3 India - Market size and forecast 2025-2030

Chart on India - Market size and forecast 2025-2030 ($ million)
Data Table on India - Market size and forecast 2025-2030 ($ million)
Chart on India - Year-over-year growth 2025-2030 (%)
Data Table on India - Year-over-year growth 2025-2030 (%)

13.3.4 South Korea - Market size and forecast 2025-2030

Chart on South Korea - Market size and forecast 2025-2030 ($ million)
Data Table on South Korea - Market size and forecast 2025-2030 ($ million)
Chart on South Korea - Year-over-year growth 2025-2030 (%)
Data Table on South Korea - Year-over-year growth 2025-2030 (%)

13.3.5 Australia - Market size and forecast 2025-2030

Chart on Australia - Market size and forecast 2025-2030 ($ million)
Data Table on Australia - Market size and forecast 2025-2030 ($ million)
Chart on Australia - Year-over-year growth 2025-2030 (%)
Data Table on Australia - Year-over-year growth 2025-2030 (%)

13.3.6 Indonesia - Market size and forecast 2025-2030

Chart on Indonesia - Market size and forecast 2025-2030 ($ million)
Data Table on Indonesia - Market size and forecast 2025-2030 ($ million)
Chart on Indonesia - Year-over-year growth 2025-2030 (%)
Data Table on Indonesia - Year-over-year growth 2025-2030 (%)

13.4 Europe - Market size and forecast 2025-2030

Chart on Europe - Market size and forecast 2025-2030 ($ million)
Data Table on Europe - Market size and forecast 2025-2030 ($ million)
Chart on Europe - Year-over-year growth 2025-2030 (%)
Data Table on Europe - Year-over-year growth 2025-2030 (%)
Chart on Regional Comparison - Europe
Data Table on Regional Comparison - Europe

13.4.1 Germany - Market size and forecast 2025-2030

Chart on Germany - Market size and forecast 2025-2030 ($ million)
Data Table on Germany - Market size and forecast 2025-2030 ($ million)
Chart on Germany - Year-over-year growth 2025-2030 (%)
Data Table on Germany - Year-over-year growth 2025-2030 (%)

13.4.2 UK - Market size and forecast 2025-2030

Chart on UK - Market size and forecast 2025-2030 ($ million)
Data Table on UK - Market size and forecast 2025-2030 ($ million)
Chart on UK - Year-over-year growth 2025-2030 (%)
Data Table on UK - Year-over-year growth 2025-2030 (%)

13.4.3 France - Market size and forecast 2025-2030

Chart on France - Market size and forecast 2025-2030 ($ million)
Data Table on France - Market size and forecast 2025-2030 ($ million)
Chart on France - Year-over-year growth 2025-2030 (%)
Data Table on France - Year-over-year growth 2025-2030 (%)

13.4.4 Italy - Market size and forecast 2025-2030

Chart on Italy - Market size and forecast 2025-2030 ($ million)
Data Table on Italy - Market size and forecast 2025-2030 ($ million)
Chart on Italy - Year-over-year growth 2025-2030 (%)
Data Table on Italy - Year-over-year growth 2025-2030 (%)

13.4.5 Spain - Market size and forecast 2025-2030

Chart on Spain - Market size and forecast 2025-2030 ($ million)
Data Table on Spain - Market size and forecast 2025-2030 ($ million)
Chart on Spain - Year-over-year growth 2025-2030 (%)
Data Table on Spain - Year-over-year growth 2025-2030 (%)

13.4.6 The Netherlands - Market size and forecast 2025-2030

Chart on The Netherlands - Market size and forecast 2025-2030 ($ million)
Data Table on The Netherlands - Market size and forecast 2025-2030 ($ million)
Chart on The Netherlands - Year-over-year growth 2025-2030 (%)
Data Table on The Netherlands - Year-over-year growth 2025-2030 (%)

13.5 North America - Market size and forecast 2025-2030

Chart on North America - Market size and forecast 2025-2030 ($ million)
Data Table on North America - Market size and forecast 2025-2030 ($ million)
Chart on North America - Year-over-year growth 2025-2030 (%)
Data Table on North America - Year-over-year growth 2025-2030 (%)
Chart on Regional Comparison - North America
Data Table on Regional Comparison - North America

13.5.1 US - Market size and forecast 2025-2030

Chart on US - Market size and forecast 2025-2030 ($ million)
Data Table on US - Market size and forecast 2025-2030 ($ million)
Chart on US - Year-over-year growth 2025-2030 (%)
Data Table on US - Year-over-year growth 2025-2030 (%)

13.5.2 Canada - Market size and forecast 2025-2030

Chart on Canada - Market size and forecast 2025-2030 ($ million)
Data Table on Canada - Market size and forecast 2025-2030 ($ million)
Chart on Canada - Year-over-year growth 2025-2030 (%)
Data Table on Canada - Year-over-year growth 2025-2030 (%)

13.5.3 Mexico - Market size and forecast 2025-2030

Chart on Mexico - Market size and forecast 2025-2030 ($ million)
Data Table on Mexico - Market size and forecast 2025-2030 ($ million)
Chart on Mexico - Year-over-year growth 2025-2030 (%)
Data Table on Mexico - Year-over-year growth 2025-2030 (%)

13.6 South America - Market size and forecast 2025-2030

Chart on South America - Market size and forecast 2025-2030 ($ million)
Data Table on South America - Market size and forecast 2025-2030 ($ million)
Chart on South America - Year-over-year growth 2025-2030 (%)
Data Table on South America - Year-over-year growth 2025-2030 (%)
Chart on Regional Comparison - South America
Data Table on Regional Comparison - South America

13.6.1 Brazil - Market size and forecast 2025-2030

Chart on Brazil - Market size and forecast 2025-2030 ($ million)
Data Table on Brazil - Market size and forecast 2025-2030 ($ million)
Chart on Brazil - Year-over-year growth 2025-2030 (%)
Data Table on Brazil - Year-over-year growth 2025-2030 (%)

13.6.2 Argentina - Market size and forecast 2025-2030

Chart on Argentina - Market size and forecast 2025-2030 ($ million)
Data Table on Argentina - Market size and forecast 2025-2030 ($ million)
Chart on Argentina - Year-over-year growth 2025-2030 (%)
Data Table on Argentina - Year-over-year growth 2025-2030 (%)

13.6.3 Chile - Market size and forecast 2025-2030

Chart on Chile - Market size and forecast 2025-2030 ($ million)
Data Table on Chile - Market size and forecast 2025-2030 ($ million)
Chart on Chile - Year-over-year growth 2025-2030 (%)
Data Table on Chile - Year-over-year growth 2025-2030 (%)

13.7 Middle East and Africa - Market size and forecast 2025-2030

Chart on Middle East and Africa - Market size and forecast 2025-2030 ($ million)
Data Table on Middle East and Africa - Market size and forecast 2025-2030 ($ million)
Chart on Middle East and Africa - Year-over-year growth 2025-2030 (%)
Data Table on Middle East and Africa - Year-over-year growth 2025-2030 (%)
Chart on Regional Comparison - Middle East and Africa
Data Table on Regional Comparison - Middle East and Africa

13.7.1 Saudi Arabia - Market size and forecast 2025-2030

Chart on Saudi Arabia - Market size and forecast 2025-2030 ($ million)
Data Table on Saudi Arabia - Market size and forecast 2025-2030 ($ million)
Chart on Saudi Arabia - Year-over-year growth 2025-2030 (%)
Data Table on Saudi Arabia - Year-over-year growth 2025-2030 (%)

13.7.2 UAE - Market size and forecast 2025-2030

Chart on UAE - Market size and forecast 2025-2030 ($ million)
Data Table on UAE - Market size and forecast 2025-2030 ($ million)
Chart on UAE - Year-over-year growth 2025-2030 (%)
Data Table on UAE - Year-over-year growth 2025-2030 (%)

13.7.3 South Africa - Market size and forecast 2025-2030

Chart on South Africa - Market size and forecast 2025-2030 ($ million)
Data Table on South Africa - Market size and forecast 2025-2030 ($ million)
Chart on South Africa - Year-over-year growth 2025-2030 (%)
Data Table on South Africa - Year-over-year growth 2025-2030 (%)

13.7.4 Israel - Market size and forecast 2025-2030

Chart on Israel - Market size and forecast 2025-2030 ($ million)
Data Table on Israel - Market size and forecast 2025-2030 ($ million)
Chart on Israel - Year-over-year growth 2025-2030 (%)
Data Table on Israel - Year-over-year growth 2025-2030 (%)

13.7.5 Turkey - Market size and forecast 2025-2030

Chart on Turkey - Market size and forecast 2025-2030 ($ million)
Data Table on Turkey - Market size and forecast 2025-2030 ($ million)
Chart on Turkey - Year-over-year growth 2025-2030 (%)
Data Table on Turkey - Year-over-year growth 2025-2030 (%)

13.8 Market opportunity by geography

Market opportunity by geography ($ million)
Data Tables on Market opportunity by geography ($ million)

14. Drivers, Challenges, and Opportunity

14.1 Market drivers

Rapid infrastructure development and public spending on civil works
Robust expansion of global renewable energy and power utility sectors
Technological advancements in fleet electrification and industrial connectivity

14.2 Market challenges

Stringent environmental regulations and high cost of transitioning to low-emission fleets
Severe shortages of skilled crane operators and escalating labor costs
Supply chain volatility and fluctuations in raw material prices

14.3 Impact of drivers and challenges

Impact of drivers and challenges in 2025 and 2030

14.4 Market opportunities

Accelerated integration of telematics and AI-driven predictive fleet analytics
Widespread adoption of hybrid and zero-emission propulsion technologies
Expansion of high-capacity all-terrain cranes in wind and modular construction

15. Competitive Landscape

15.1 Overview

15.2

Overview on criticality of inputs and factors of differentiation

15.3 Landscape disruption

Overview on factors of disruption

15.4 Industry risks

Impact of key risks on business

16. Competitive Analysis

16.1 Companies profiled

Companies covered

16.2 Company ranking index

16.3 Market positioning of companies

Matrix on companies position and classification

16.4 Action Construction Equipment

Action Construction Equipment - Overview
Action Construction Equipment - Business segments
Action Construction Equipment - Key offerings
Action Construction Equipment - Segment focus
SWOT

16.5 JMG Cranes S.p.A

JMG Cranes S.p.A - Overview
JMG Cranes S.p.A - Product / Service
JMG Cranes S.p.A - Key offerings
SWOT

16.6 KATO WORKS CO. LTD.

KATO WORKS CO. LTD. - Overview
KATO WORKS CO. LTD. - Product / Service
KATO WORKS CO. LTD. - Key offerings
SWOT

16.7 Kobelco Construction Machinery

Kobelco Construction Machinery - Overview
Kobelco Construction Machinery - Product / Service
Kobelco Construction Machinery - Key offerings
SWOT

16.8 Liebherr International AG

Liebherr International AG - Overview
Liebherr International AG - Product / Service
Liebherr International AG - Key offerings
SWOT

16.9 Link Belt Cranes

Link Belt Cranes - Overview
Link Belt Cranes - Product / Service
Link Belt Cranes - Key offerings
SWOT

16.10 Liugong Machinery Co. Ltd.

Liugong Machinery Co. Ltd. - Overview
Liugong Machinery Co. Ltd. - Business segments
Liugong Machinery Co. Ltd. - Key offerings
Liugong Machinery Co. Ltd. - Segment focus
SWOT

16.11 Maeda Seisakusho Co. Ltd.

Maeda Seisakusho Co. Ltd. - Overview
Maeda Seisakusho Co. Ltd. - Product / Service
Maeda Seisakusho Co. Ltd. - Key offerings
SWOT

16.12 Manitowoc Co Inc.

Manitowoc Co Inc. - Overview
Manitowoc Co Inc. - Business segments
Manitowoc Co Inc. - Key offerings
Manitowoc Co Inc. - Segment focus
SWOT

16.13 PALFINGER AG

PALFINGER AG - Overview
PALFINGER AG - Business segments
PALFINGER AG - Key offerings
PALFINGER AG - Segment focus
SWOT

16.14 Sany Heavy Industry Co. Ltd.

Sany Heavy Industry Co. Ltd. - Overview
Sany Heavy Industry Co. Ltd. - Business segments
Sany Heavy Industry Co. Ltd. - Key offerings
Sany Heavy Industry Co. Ltd. - Segment focus
SWOT

16.15 Tadano Ltd.

Tadano Ltd. - Overview
Tadano Ltd. - Business segments
Tadano Ltd. - Key offerings
Tadano Ltd. - Segment focus
SWOT

16.16 Terex Corp.

Terex Corp. - Overview
Terex Corp. - Business segments
Terex Corp. - Key offerings
Terex Corp. - Segment focus
SWOT

16.17 XCMG Group

XCMG Group - Overview
XCMG Group - Business segments
XCMG Group - Key offerings
XCMG Group - Segment focus
SWOT

16.18 Zoomlion Industry Co. Ltd.

Zoomlion Industry Co. Ltd. - Overview
Zoomlion Industry Co. Ltd. - Business segments
Zoomlion Industry Co. Ltd. - Key offerings
Zoomlion Industry Co. Ltd. - Segment focus
SWOT

17. Appendix

17.1 Scope of the report

Market definition
Objectives
Notes and caveats

17.2 Inclusions and exclusions checklist

Inclusions checklist
Exclusions checklist

17.3 Currency conversion rates for US$

17.4 Research methodology

17.5 Data procurement

Information sources

17.6 Data validation

17.7 Validation techniques employed for market sizing

17.8 Data synthesis

17.9 360 degree market analysis

17.10 List of abbreviations

Research Methodology

Technavio presents a detailed picture of the market by way of study, synthesis, and summation of data from multiple sources. The analysts have presented the various facets of the market with a particular focus on identifying the key industry influencers. The data thus presented is comprehensive, reliable, and the result of extensive research, both primary and secondary.

INFORMATION SOURCES

Primary sources

  • Manufacturers and suppliers
  • Channel partners
  • Industry experts
  • Strategic decision makers

Secondary sources

  • Industry journals and periodicals
  • Government data
  • Financial reports of key industry players
  • Historical data
  • Press releases

DATA ANALYSIS

Data Synthesis

  • Collation of data
  • Estimation of key figures
  • Analysis of derived insights

Data Validation

  • Triangulation with data models
  • Reference against proprietary databases
  • Corroboration with industry experts

REPORT WRITING

Qualitative

  • Market drivers
  • Market challenges
  • Market trends
  • Five forces analysis

Quantitative

  • Market size and forecast
  • Market segmentation
  • Geographical insights
  • Competitive landscape

Interested in this report?

Get your sample now to see our research methodology and insights!

Download Now

Frequently Asked Questions

Mobile Crane market growth will increase by USD 11607.9 million during 2026-2030.

The Mobile Crane market is expected to grow at a CAGR of 7.3% during 2026-2030.

Mobile Crane market is segmented by Type (Truck mounted crane, Trailer mounted crane, Crawler crane) Application (Construction, Industrial, Utilities) Capacity (Upto 50 ton, Above 200 ton, More than 51 to 100 ton, More than 101 to 200 ton) Product type (Telescopic boom, Lattice boom)

Action Construction Equipment, Broderson Manufacturing Corp., JMG Cranes S.p.A, KATO WORKS CO. LTD., Kobelco Construction Machinery, Liebherr International AG, Link Belt Cranes, Liugong Machinery Co. Ltd., LOCATELLI CRANE Srl, Maeda Seisakusho Co. Ltd., Manitowoc Co Inc., Ormig S.p.A., PALFINGER AG, Sany Heavy Industry Co. Ltd., SENNEBOGEN Maschinenfabrik GmbH, Spierings Mobile Cranes B.V., Tadano Ltd., Terex Corp., XCMG Group, Zoomlion Industry Co. Ltd. are a few of the key vendors in the Mobile Crane market.

APAC will register the highest growth rate of 58.7% among the other regions. Therefore, the Mobile Crane market in APAC is expected to garner significant business opportunities for the vendors during the forecast period.

China, Japan, India, South Korea, Australia, Indonesia, Germany, UK, France, Italy, Spain, The Netherlands, US, Canada, Mexico, Brazil, Argentina, Chile, Saudi Arabia, UAE, South Africa, Israel, Turkey

  • Rapid infrastructure development and public spending on civil works is the driving factor this market.

The Mobile Crane market vendors should focus on grabbing business opportunities from the Type segment as it accounted for the largest market share in the base year.
RIA - Research AI Assistant
Ask RIA
