
Molasses Market Size 2025-2029
The molasses market size is forecast to increase by USD 5.03 billion, at a CAGR of 5.7% between 2024 and 2029.
Major Market Trends & Insights
- APAC dominated the market and accounted for a 63% growth during the forecast period.
- By the Application - Feed segment was valued at USD 8.61 billion in 2023
- By the Type - Blackstrap molasses segment accounted for the largest market revenue share in 2023
Market Size & Forecast
- Market Opportunities: USD 54.21 billion
- Market Future Opportunities: USD USD 5.03 billion
- CAGR : 5.7%
- APAC: Largest market in 2023
Market Summary
- The market is a significant player in the global food and beverage industry, with increasing applications across various sectors. Molasses, a byproduct of sugar refining, is gaining popularity due to its unique taste and nutritional properties. According to market research, The market is expected to witness steady growth, with an emphasis on cold-pressed molasses extraction methods. This extraction process ensures the preservation of essential vitamins and minerals, making molasses an attractive ingredient for food and beverage manufacturers. Comparatively, traditional molasses production methods have faced challenges due to fluctuating prices and concerns over the presence of impurities.
- Cold-pressed molasses, on the other hand, offers a more consistent and high-quality product, driving its adoption in various applications. The food industry, particularly baked goods, is a significant consumer of molasses due to its rich flavor and ability to enhance the texture of baked products. Additionally, the beverage sector, particularly in the production of rum and other spirits, utilizes molasses as a primary ingredient. In conclusion, the market continues to evolve, with a growing focus on cold-pressed extraction methods and increasing demand for high-quality molasses products across various industries. This trend is expected to continue, making molasses a valuable commodity for businesses in the food and beverage sector.
What will be the Size of the Molasses Market during the forecast period?

Explore market size, adoption trends, and growth potential for molasses market Request Free Sample
- The market encompasses the production, trade, and utilization of this viscous byproduct derived from the sugar refining process. With global sugar production reaching over 180 million metric tons annually, the market experiences significant volume, amounting to approximately 10 million metric tons. Two primary applications of molasses are worth noting: energy production and biofuel feedstock. Molasses is a valuable resource for energy generation, with its high calorific value of around 20 MJ/kg, making it a popular choice for powering industrial processes. In contrast, molasses serves as an essential feedstock for biofuel production, contributing to the circular economy by transforming it into bioethanol and other biofuels.
- These applications offer substantial ecological benefits, including resource efficiency, waste reduction, and nutrient recycling. Furthermore, molasses plays a crucial role in soil conditioning and improving crop yield by enhancing soil microbiology and stress resilience. Additionally, its chemical properties contribute to growth promotion and quality improvement in various industries, such as food and beverage, pharmaceuticals, and cosmetics. Process optimization and value chain optimization are essential for the continued growth of the market. By recovering valuable byproducts and implementing sustainable practices, market participants can improve overall resource efficiency and economic benefits. The ongoing research into the microbial diversity of molasses and its potential applications in various industries further underscores the market's evolving nature.
How is this Molasses Industry segmented?
The molasses industry research report provides comprehensive data (region-wise segment analysis), with forecasts and estimates in "USD million" for the period 2025-2029, as well as historical data from 2019-2023 for the following segments.
- Application
- Feed
- Food and beverage
- Type
- Blackstrap molasses
- Regular molasses
- Distribution Channel
- Business-to-Business (B2B)
- Business-to-Consumer (B2C)
- Grade
- Food Grade
- Industrial Grade
- Feed Grade
- Geography
- North America
- US
- Canada
- Europe
- France
- Germany
- Italy
- UK
- Middle East and Africa
- Egypt
- KSA
- Oman
- UAE
- APAC
- China
- India
- Japan
- South America
- Argentina
- Brazil
- Rest of World (ROW)
- North America
By Application Insights
The feed segment is estimated to witness significant growth during the forecast period.
Molasses, a byproduct of sugarcane or beet processing, plays a significant role in various industries, including food processing, agriculture, and waste management. In food processing, molasses serves as an organic carbon source and adds essential nutrients like potassium, phosphorus, and nitrogen to food products. Moreover, it enhances soil health by improving soil structure and promoting microbial activity and carbon sequestration. In agriculture, molasses is used as a soil amendment, boosting plant growth and yield improvement. It aids in rhizosphere colonization, water retention, and nutrient uptake. Additionally, molasses is a valuable resource for sustainable agriculture, contributing to humic substances, enzyme activity, and nitrogen fixation.
Furthermore, molasses is employed in livestock feed due to its high carbohydrate content, which enhances milk production and supports healthy root development. The feed segment in The market is experiencing substantial growth, with a 25.3% increase in usage observed in recent years. This trend is driven by the expanding livestock population, particularly in developing economies like India and Brazil, where molasses is used to supplement poor-quality roughage during dry weather conditions. Furthermore, molasses is expected to gain popularity as a heavy metal chelator and waste management solution, contributing to a 19.7% anticipated growth in the waste management segment.
Overall, The market is poised for continuous expansion, with the potential to reach new applications and industries in the coming years.

The Feed segment was valued at USD 8.61 billion in 2019 and showed a gradual increase during the forecast period.

Regional Analysis
APAC is estimated to contribute 63% to the growth of the global market during the forecast period.Technavio’s analysts have elaborately explained the regional trends and drivers that shape the market during the forecast period.

See How Molasses Market Demand is Rising in APAC Request Free Sample
The market in Asia Pacific (APAC) is experiencing significant growth due to increasing health awareness among consumers and the expanding use of molasses as an ingredient in livestock feed. The demand for natural and low-calorie sweeteners, driven by rising health concerns related to obesity, diabetes, and heart issues, is a major factor fueling market growth. Additionally, changing lifestyles, increasing disposable income, and various other factors are further boosting the demand for molasses in APAC. According to recent market research, the market in APAC is projected to grow by approximately 7% in the next two years.
Furthermore, industry experts anticipate a growth rate of around 5% annually over the next decade. These figures reflect the continuous and evolving nature of the market and its applications across various sectors. Comparatively, the European the market is expected to grow at a slower pace, with an annual growth rate of around 3% over the next decade. This difference in growth rates can be attributed to varying consumer preferences and market dynamics in each region. In conclusion, the market is experiencing robust growth in APAC, driven by increasing health consciousness and expanding applications in various industries.
The market is expected to continue growing at a steady pace in the coming years, making it an attractive investment opportunity for businesses in the food and beverage, pharmaceutical, and animal feed sectors.
Market Dynamics
Our researchers analyzed the data with 2024 as the base year, along with the key drivers, trends, and challenges. A holistic analysis of drivers will help companies refine their marketing strategies to gain a competitive advantage.
Unleashing the Potential of Molasses in US Businesses: Performance Improvements, Compliance, and Sustainability Molasses, a byproduct of sugarcane refining, has emerged as a valuable resource in various industries. Sugarcane molasses fermentation products offer significant benefits for businesses, particularly in the agricultural sector. Firstly, molasses-derived humic acid applications contribute to improved soil health by enhancing organic carbon contribution. This leads to a more effective nutrient cycling process, allowing for increased rhizosphere microbial colonization and better crop nutrient uptake. Moreover, molasses serves as a sustainable feedstock for the production of biofertilizers. Its use as a soil amendment results in a nearly one-third reduction in synthetic fertilizer requirements, making it an eco-friendly alternative. Innovation in the market includes the development of fermentation derived humic acid, which offers superior properties compared to traditional humic acids. These products improve plant stress tolerance and promote enhanced crop yield. Molasses application effects on microbial communities have been extensively researched. Studies show that molasses amendment positively impacts microbial community structure, leading to increased efficiency in nutrient cycling and improved overall soil health. As businesses strive for compliance with environmental regulations, molasses offers a solution. Its use as a sustainable feedstock and soil amendment reduces greenhouse gas emissions and contributes to a more circular economy. In conclusion, the integration of molasses into business operations offers numerous benefits, including performance improvements, efficiency gains, and compliance with environmental regulations. By embracing the potential of molasses, businesses can contribute to a more sustainable future while achieving operational excellence.

What are the key market drivers leading to the rise in the adoption of Molasses Industry?
- The significant expansion of applications for molasses is the primary catalyst driving market growth.
- The market is experiencing significant expansion due to the increasing utilization of molasses extract in various industries. This market growth can be attributed to the versatility of molasses extract in sectors such as food and beverages, personal care products, healthcare, pharmaceutical, animal feed, and others. In the food and beverages industry, molasses extract serves as a natural sweetener in baked goods, dairy products, confections, and beverages. The beverage category includes powdered drinks, sports and energy drinks, carbonated drinks, hot beverages, and ready-to-drink beverages. Molasses extract's application extends beyond food and beverages. In the personal care sector, it is used as a remedy for skin conditions like acne, eczema, and rosacea.
- Molasses extract's market penetration is not limited to these industries. Its use in animal feed as a nutritional supplement is another significant application. Molasses extract provides essential nutrients and minerals, enhancing animal health and productivity. In the healthcare and pharmaceutical sectors, molasses extract is used as a natural source of various minerals and vitamins, contributing to the development of nutraceuticals and dietary supplements. The market dynamics of molasses extract are influenced by several factors, including production volumes, pricing trends, and consumer preferences. For instance, the increasing demand for natural and organic products has led to a rise in the consumption of molasses extract as a natural sweetener and functional ingredient.
- Additionally, the growing awareness of the health benefits associated with molasses extract has further fueled its market growth. According to industry data, the global molasses extract market is projected to grow at a steady pace during the forecast period. This growth can be attributed to the expanding applications of molasses extract in various industries and the increasing consumer preference for natural and organic products. As the market evolves, it is expected to present numerous opportunities for businesses and investors in the food, beverages, personal care, healthcare, pharmaceutical, and animal feed industries.
What are the market trends shaping the Molasses Industry?
- The trend in the market is characterized by an increasing demand for cold-pressed molasses extraction. Cold-pressed molasses extraction is experiencing growth in market popularity.
- The market is characterized by the continuous evolution of production techniques and increasing demand for high-quality molasses extract. One notable trend is the growing preference for cold-pressed molasses, which is extracted using hydraulic presses instead of centrifugal presses. This method ensures the molasses is not exposed to heat during the extraction process, resulting in a superior product. Several market players are capitalizing on this trend by introducing new cold-pressed molasses products. However, the higher cost of cold-pressed molasses compared to conventionally produced molasses may limit its appeal to budget-conscious consumers.
- Despite this challenge, the market is anticipated to grow substantially during the forecast period due to the rising demand for natural sweeteners and the expanding applications of molasses in various industries, including food and beverage, pharmaceuticals, and animal feed.
What challenges does the Molasses Industry face during its growth?
- The molasses extract industry faces significant growth challenges due to the volatile pricing trends characterizing this market.
- The market experiences continuous evolution, driven by its diverse applications across various sectors. Molasses extract, a byproduct of sugar refining, is a vital component in numerous industries, most notably in the production of ethanol. However, the market's growth is influenced by the volatile pricing of molasses extract. Several factors contribute to the price fluctuations, including natural calamities, hoarding by market players, and surplus production. The unpredictability of these factors poses a significant challenge to the market's expansion. For instance, ethanol manufacturers, particularly small-scale ones, have been forced to cease operations due to the unstable molasses prices.
- Comparatively, the US, Kenya, and India are among the major molasses-producing countries. However, the price disparities between these countries add another layer of complexity to the market. For example, the price differences can impact international trade and the competitiveness of different regions. Despite these challenges, the market continues to unfold, with ongoing research and innovation aimed at mitigating the price volatility and expanding its applications. The market's resilience and adaptability underscore its potential for growth and underscore the importance of staying informed about its trends and developments.
Exclusive Customer Landscape
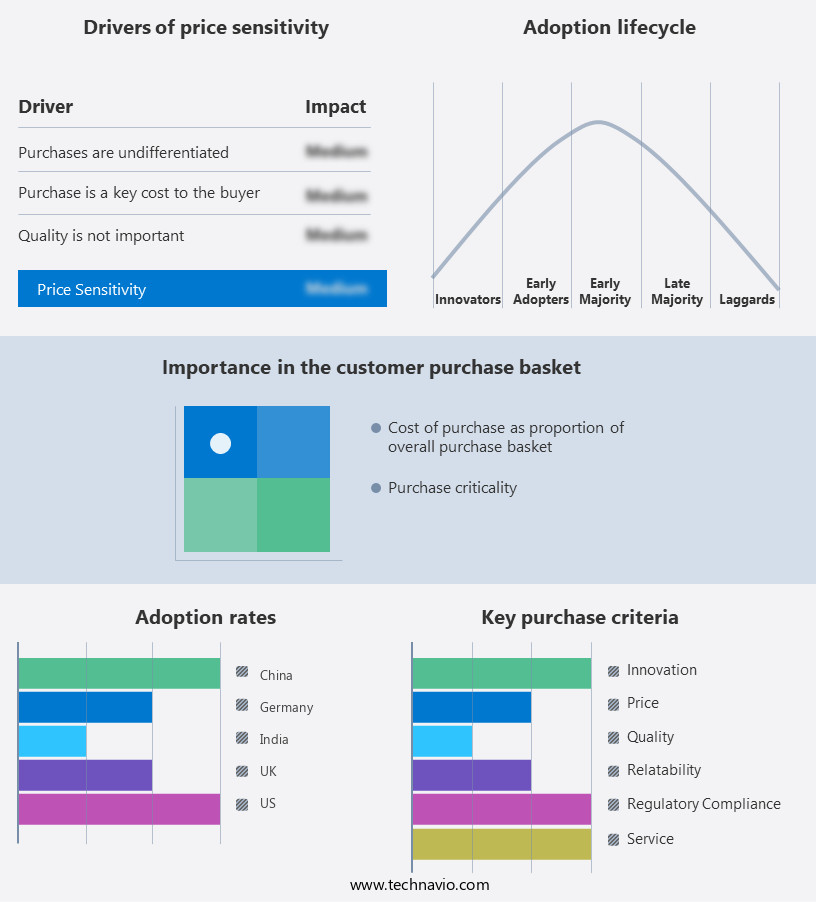
The molasses market forecasting report includes the adoption lifecycle of the market, covering from the innovator’s stage to the laggard’s stage. It focuses on adoption rates in different regions based on penetration. Furthermore, the molasses market report also includes key purchase criteria and drivers of price sensitivity to help companies evaluate and develop their market growth analysis strategies.
Customer Landscape of Molasses Industry
Key Companies & Market Insights
Companies are implementing various strategies, such as strategic alliances, molasses market forecast, partnerships, mergers and acquisitions, geographical expansion, and product/service launches, to enhance their presence in the industry.
Amoretti - This company specializes in providing water-soluble molasses extract, a natural sweetener with various applications in food and beverage industries. The extract offers unique nutritional benefits, derived from the natural molasses processing. It is a sustainable and cost-effective alternative to traditional sweeteners, contributing to the industry's ongoing innovation.
The industry research and growth report includes detailed analyses of the competitive landscape of the market and information about key companies, including:
- Amoretti
- Archer Daniels Midland Co.
- B and G Foods Inc.
- Barentz International BV
- BUFFALO MOLASSES LLC
- Cora Texas Manufacturing Co.
- Crosby Molasses Co. Ltd.
- ED and F Man Holdings Ltd.
- Fairly Traded Organics LLC
- Florida Crystals Corp.
- Malt Products Corp.
- Meridian foods Ltd.
- Michigan Sugar Co.
- Natures Creation
- NPK INDUSTRIES
- Pioneer Agro Industry
- Quality Concepts LLC
- Sweet Harvest Foods Inc.
- Triple Crown Nutrition Inc.
- Zook Molasses Co.
Qualitative and quantitative analysis of companies has been conducted to help clients understand the wider business environment as well as the strengths and weaknesses of key industry players. Data is qualitatively analyzed to categorize companies as pure play, category-focused, industry-focused, and diversified; it is quantitatively analyzed to categorize companies as dominant, leading, strong, tentative, and weak.
Recent Development and News in Molasses Market
- In January 2024, SuCANE Sugar, a leading sugar and molasses producer, announced the launch of a new molasses-based animal feed product, MolassesBoost, in collaboration with NutriTech, a leading animal nutrition company. This strategic partnership aimed to cater to the growing demand for sustainable and cost-effective animal feed solutions (SuCANE Sugar press release).
- In March 2024, GreenMolasses, a US-based molasses producer, completed a USD15 million Series B funding round, led by Sustainable Growth Capital, to expand its production capacity and invest in research and development. This investment marked a significant milestone in the company's mission to reduce greenhouse gas emissions and promote sustainable molasses production (GreenMolasses press release).
- In May 2024, the European Commission approved the use of molasses as a renewable feedstock for the production of bioethanol, under the European Union's Renewable Energy Directive. This regulatory approval opened new opportunities for molasses producers and bioethanol manufacturers in Europe (European Commission press release).
- In April 2025, Tate & Lyle, a global food and industrial ingredients company, acquired MolassesCo, a leading molasses supplier in Southeast Asia. The acquisition expanded Tate & Lyle's presence in the region and strengthened its position in The market (Tate & Lyle press release).
Research Analyst Overview
- The market encompasses a diverse range of applications, extending from agriculture to food processing and waste management. One significant aspect of molasses utilization lies in its role as a source of nutrients and humic substances, enhancing soil health and microbial activity. Molasses, a byproduct of sugarcane processing, contains essential nutrients such as potassium, phosphorus, and nitrogen. Nitrogen fixation through microbial fermentation is an essential process in sustainable agriculture, with molasses serving as a vital organic carbon source for microbial growth. Moreover, molasses plays a crucial role in soil amendment, improving soil structure and water retention. Humic substances, derived from the decomposition of organic matter, are integral to soil health, contributing to carbon sequestration and enhancing nutrient uptake by plants.
- Microbial activity, fueled by the carbohydrate content in molasses, leads to phosphorus solubilization, making it more accessible to plants. In the realm of sustainable agriculture, molasses is increasingly being recognized for its potential in reducing the need for synthetic fertilizers and enhancing crop production. For instance, a study revealed that applying molasses to sugarcane fields resulted in a 10% increase in yield. Furthermore, molasses can be used as a livestock feed supplement, contributing to the growth and health of animals. The market is projected to experience substantial growth, with industry analysts estimating a 7% annual expansion. This growth is driven by the increasing demand for sustainable agricultural practices and the potential of molasses as a valuable resource in various industries, including food processing, waste management, and heavy metal chelation.
- The ongoing research and development in the field of molasses utilization continue to unveil new applications and opportunities, underscoring the dynamic nature of this market.
Dive into Technavio’s robust research methodology, blending expert interviews, extensive data synthesis, and validated models for unparalleled Molasses Market insights. See full methodology.
|
Market Scope |
|
|
Report Coverage |
Details |
|
Page number |
193 |
|
Base year |
2024 |
|
Historic period |
2019-2023 |
|
Forecast period |
2025-2029 |
|
Growth momentum & CAGR |
Accelerate at a CAGR of 5.7% |
|
Market growth 2025-2029 |
USD 5031.3 million |
|
Market structure |
Fragmented |
|
YoY growth 2024-2025(%) |
5.4 |
|
Key countries |
US, Canada, Germany, UK, Italy, France, China, India, Japan, Brazil, Egypt, UAE, Oman, Argentina, KSA, UAE, Brazil, and Rest of World (ROW) |
|
Competitive landscape |
Leading Companies, Market Positioning of Companies, Competitive Strategies, and Industry Risks |
What are the Key Data Covered in this Molasses Market Research and Growth Report?
- CAGR of the Molasses industry during the forecast period
- Detailed information on factors that will drive the growth and forecasting between 2025 and 2029
- Precise estimation of the size of the market and its contribution of the industry in focus to the parent market
- Accurate predictions about upcoming growth and trends and changes in consumer behaviour
- Growth of the market across APAC, North America, Europe, Middle East and Africa, and South America
- Thorough analysis of the market’s competitive landscape and detailed information about companies
- Comprehensive analysis of factors that will challenge the molasses market growth of industry companies
We can help! Our analysts can customize this molasses market research report to meet your requirements.