Monochloroacetic Acid Market Size 2024-2028
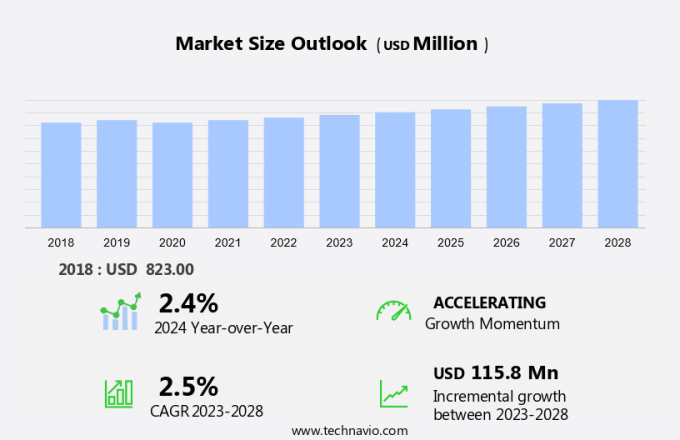
The monochloroacetic acid market size is forecast to increase by USD 115.8 million at a CAGR of 2.5% between 2023 and 2028.
- Monochloroacetic acid (MCAA) is a significant chemical compound with wide applications in various industries, including cosmetics, pharmaceuticals, and textiles. The market is driven by the increasing usage of its derivatives in these sectors. In the cosmetics industry, MCA is employed as a wetting agent and a texturizer, contributing to the consistency and desirable texture of cosmetic products. In pharmaceutical manufacturing, MCA is utilized as an intermediate in the production of several drugs. Furthermore, the textile industry uses MCA as a finishing agent to enhance fabric quality. Regulatory standards play a crucial role in the market, ensuring product safety and quality. Technological advancements have led to the development of crystalline product forms, enabling improved efficiency and consistency in manufacturing processes. Capacity expansion in the Asia Pacific region is another growth factor, driven by the region's growing industrialization and increasing demand for MCA derivatives. However, volatile prices of raw materials pose a challenge to market growth.
What will be the Size of the Market During the Forecast Period?
- Monochloroacetic Acid (MCAA) is a significant chemical compound used in various industries, including pharmaceuticals, agriculture, and manufacturing. The demand for MCAA continues to grow due to its versatile applications. MCA is an essential intermediate in the production of various chemicals, such as chloroacetic acids and their salts, which are used in the manufacturing of pharmaceuticals, agrochemicals, and other industrial chemicals. In the pharmaceutical industry, MCA is used in the synthesis of drugs like aspirin and thiamine. In agriculture, it is used as a herbicide and a precursor to other agrochemicals. The increasing focus on sustainable manufacturing practices and eco-friendly solutions has led to the growth of the MCA market. MCA is used in the production of biodegradable detergents, which are gaining popularity due to their environmental benefits. These detergents are less harmful to the environment and reduce the amount of water required for washing. Moreover, the demand for MCA in the production of bio-based surfactants is expected to increase due to the growing trend towards renewable energy and sustainable agriculture. Bio-based surfactants are used in various applications, including in the production of biodiesel and in agriculture as soil conditioners and pesticides. The chemical industry is undergoing a digital transformation, with the adoption of big data analytics and artificial intelligence (AI) to optimize supply chain management and improve product traceability. MCA producers are leveraging these technologies to enhance their operations and meet the evolving demands of their customers. Consumer awareness and safety regulations are also driving the growth of the MCA market.
- Strict regulations regarding the use of chemicals in various industries, particularly in pharmaceuticals and agriculture, have led to an increased focus on the production of safe and sustainable chemicals. MCA producers are investing in research and development to ensure the safety and sustainability of their products. The demand for housing and urban development is also expected to drive the growth of the MCA market. MCA is used in the production of construction chemicals, such as concrete admixtures and waterproofing agents, which are essential for the construction industry. In conclusion, the Monochloroacetic Acid market is expected to grow due to its versatile applications in various industries, including pharmaceuticals, agriculture, and manufacturing. The focus on sustainable manufacturing practices, eco-friendly solutions, and digital transformation is driving the growth of the market. Additionally, consumer awareness and safety regulations, as well as the demand for housing and urban development, are expected to provide significant opportunities for MCA producers.
How is this market segmented and which is the largest segment?
The market research report provides comprehensive data (region-wise segment analysis), with forecasts and estimates in "USD million" for the period 2024-2028, as well as historical data from 2018-2022 for the following segments.
- Application
- Cellulosic
- Agrochemicals
- Thioglycolic acid
- Surfactants
- Others
- Geography
- APAC
- China
- Japan
- North America
- US
- Europe
- Germany
- South America
- Middle East and Africa
- APAC
By Application Insights
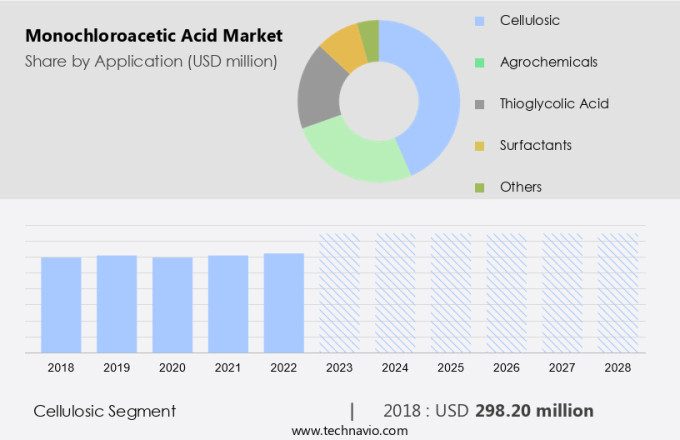
- The cellulosic segment is estimated to witness significant growth during the forecast period.
Monochloroacetic Acid (MCAA) is a significant chlorinated derivative with wide applications, particularly in the cosmetics industry and industrial use. MCAA is often used as an emulsifier in skincare products due to its ability to stabilize oil-in-water emulsions. In the cosmetics industry, MCAA's quality and production capacity are crucial for maintaining consumer trust and satisfaction. MCAA's use extends beyond cosmetics, as it is also employed in various industrial applications. For instance, it is used as a preservative in food and beverages, where it functions as a stabilizer and thickener. In the chemical industry, MCAA is used as a raw material for producing cellulosic, which is a water-soluble cellulose ether with numerous applications in food and beverages, ceramics, detergents, pharmaceuticals, and personal care.
Additionally, the growth of these industries is expected to drive the demand for MCAA, as disposable income levels rise and consumers seek high-quality products. MCAA's versatility and effectiveness make it an essential ingredient in various industries, ensuring its continued relevance and importance in the market. In conclusion, Monochloroacetic Acid plays a vital role in numerous industries, from cosmetics to food and beverages, due to its unique properties and wide range of applications. The growth of these industries is expected to fuel the demand for MCAA, making it a valuable investment opportunity for businesses seeking to expand their product offerings and cater to the evolving needs of consumers.
Get a glance at the market report of share of various segments Request Free Sample
The cellulosic segment was valued at USD 298.20 million in 2018 and showed a gradual increase during the forecast period.
Regional Analysis
- APAC is estimated to contribute 49% to the growth of the global market during the forecast period.
Technavio's analysts have elaborately explained the regional trends and drivers that shape the market during the forecast period.
For more insights on the market share of various regions Request Free Sample
Monochloroacetic acid (MCAA) is a vital chemical compound used as a preservative in various industries, including food and beverages, pharmaceuticals, and cosmetics. In the Asia Pacific (APAC) region, the expanding food and beverage market is driving the growth of the MCAA market. The increasing consumption of packaged food products in APAC is leading to a higher demand for MCAA. Among all the countries in the region, China holds the largest market share for MCAA due to its extensive usage in food processing, pharmaceuticals, and cosmetics industries. Moreover, several nations in APAC are concentrating on expanding their national oil and gas industries, which may further boost the demand for MCAA.
Market Dynamics
Our researchers analyzed the data with 2023 as the base year, along with the key drivers, trends, and challenges. A holistic analysis of drivers will help companies refine their marketing strategies to gain a competitive advantage.
What are the key market drivers leading to the rise in adoption of Monochloroacetic Acid Market?
Increasing use of MCAA derivatives in end-user industries is the key driver of the market.
- Monochloroacetic Acid (MCAA), a significant chemical compound, plays a vital role in various industries, including textiles, healthcare, and pesticides. In textiles, MCAA is utilized as an essential component in the production of cellulosic, which functions as a finishing agent. This application is prevalent in the textile, adhesives, detergents, and leather and paper industries. MCAA's intermediary function is crucial in the synthesis of indigo dyes and textile auxiliaries. In the healthcare sector, MCAA is used in the manufacturing of carboxymethyl cellulose, a vital ingredient in the production of pharmaceuticals and personal care items like facial cleansers, lotions, and other cosmetics.
- The increasing demand for processed foods and innovations in the food processing and packaging industries are major drivers for the usage of MCAA in the production of preservatives and packaging materials. As a result, the market for MCAA is anticipated to grow steadily during the forecast period. MCAA's unique properties, such as its ability to form foam-resistant non-staining films with good adhesiveness and stretchability, make it an indispensable component in numerous industries. Its extensive applications and versatility make it a valuable asset in the chemical industry.
What are the market trends shaping the Monochloroacetic Acid Market?
Capacity expansion in APAC is the upcoming trend in the market.
- Monochloroacetic acid (MCA), a significant chemical compound, continues to hold a substantial market share, particularly in Asia Pacific. The region accounts for over half of the global MCA demand, driven by rapid urbanization and industrialization in countries like China, India, and Indonesia. The global MCA production capacity has witnessed a notable increase in the last five years, with China and India being the major contributors. In 2016, AkzoNobel and Atul India announced a joint venture to manufacture MCA in India, leading to an anticipated threefold expansion of the country's production capacity.
- Regulatory standards ensure consistency in the production and application of MCA across various industries, including cosmetics, pharmaceuticals, textiles, and as wetting agents. Technological advancements continue to influence the development of crystalline product forms and improved texture properties, further expanding the application scope of MCA.
What challenges does Monochloroacetic Acid Market face during the growth?
Volatile prices of raw materials is a key challenge affecting the market growth.
- Monochloroacetic acid (MCA) is a significant intermediate chemical used in various industries, including agriculture and manufacturing. The production of MCA involves the chlorination of glacial acetic acid. Acetic acid is primarily synthesized through catalytic oxidation of acetaldehyde, which is derived from acetylene or ethanol. The cost of ethanol, a crucial raw material for acetic acid production, is influenced by the price of crude oil. In 2021, ethanol prices were high, leading to increased production costs for MCA manufacturers. However, ethanol prices experienced a significant decrease from 2022, which positively impacted the MCA market. The volatile ethanol prices pose a challenge for MCA manufacturers, as they struggle to maintain consistent raw material costs and, consequently, stable final product prices.
- In the agrochemical sector, MCA is used as a precursor for producing chloroacetic acids, which are essential in pest control. Additionally, MCA is utilized in the production of carboxymethyl cellulose (CMC), a thickening agent, and surfactants. In the pharmaceutical industry, MCA is used in the chemical synthesis of various medications. The MCA market's growth is influenced by the demand for these applications.
Exclusive Customer Landscape
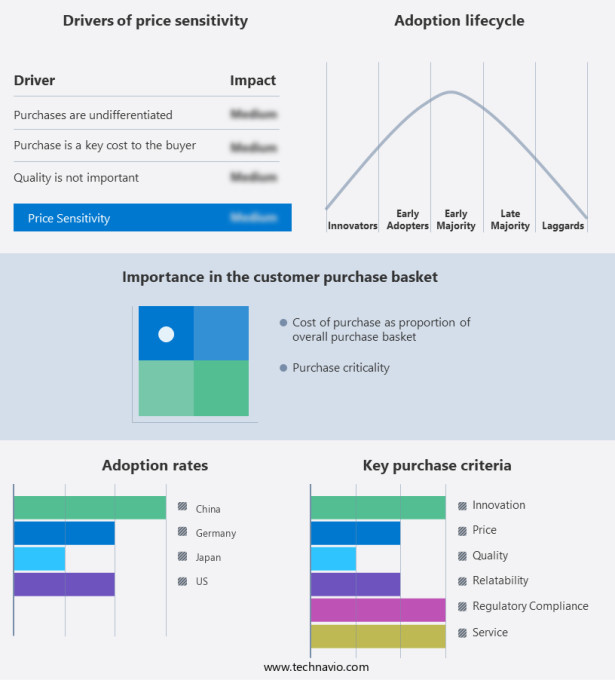
The market forecasting report includes the adoption lifecycle of the market, covering from the innovator's stage to the laggard's stage. It focuses on adoption rates in different regions based on penetration. Furthermore, the market report also includes key purchase criteria and drivers of price sensitivity to help companies evaluate and develop their market growth analysis strategies.
Customer Landscape
Key Companies & Market Insights
Companies are implementing various strategies, such as strategic alliances, market forecast , partnerships, mergers and acquisitions, geographical expansion, and product/service launches, to enhance their presence in the market. The market research and growth report includes detailed analyses of the competitive landscape of the market and information about key companies, including:
- Abhishek Impex
- Anugrah In Org Pvt. Ltd.
- Atul Ltd.
- CABB Group GmbH
- Daicel Corp.
- Denak Co. Ltd.
- Henan HDF Chemical Co. Ltd.
- IOL Chemicals and Pharmaceuticals Ltd.
- ITALMAR Thailand Co. Ltd.
- Jiangxi Biochem Co. Ltd.
- Jubilant Pharmova Ltd.
- Kerry Group Plc
- Merck KGaA
- Meridian Chem Bond Pvt. Ltd.
- Nouryon Chemicals Holding B.V.
- PCC SE
- S.R.Drugs and Intermediates Pvt. Ltd.
- Shiv Chem Industries
- Thermo Fisher Scientific Inc.
Qualitative and quantitative analysis of companies has been conducted to help clients understand the wider business environment as well as the strengths and weaknesses of key market players. Data is qualitatively analyzed to categorize companies as pure play, category-focused, industry-focused, and diversified; it is quantitatively analyzed to categorize companies as dominant, leading, strong, tentative, and weak.
Research Analyst Overview
Monochloroacetic acid (MCAA), a chlorinated derivative of acetic acid, is a versatile chemical compound with extensive applications in various industries. In agriculture, it serves as an essential intermediary component in the manufacturing of herbicides and pesticides, enhancing crop yields and ensuring effective pest control. In the personal care sector, monochloroacetic acid is utilized as a surfactant, emulsifier, and wetting agent in the production of facial cleansers, lotions, and cosmetics. Its reactivity makes it an ideal ingredient in the synthesis of carboxymethyl cellulose, a binder used in the manufacturing of textile and construction materials.
Additionally, in healthcare, monochloroacetic acid is employed as a preservative and a component in the synthesis of medications. Its corrosive properties necessitate stringent regulatory standards to ensure safety during manufacturing and usage. Monochloroacetic acid's industrial applications extend to the production of detergents, foaming agents, and dispersants. The evolving needs of the cosmetics industry and technological advancements in personal care products continue to drive the demand for monochloroacetic acid. The growing infrastructure investments in urbanization and construction, as well as increasing disposable income, fuel the demand for personal care items and agrochemicals. The production capacity of monochloroacetic acid is expected to expand to meet these market demands while maintaining the highest standards of quality and safety.
Further, the market is evolving with a growing focus on sustainable and eco-friendly solutions. MCA is used in various applications, including biodegradable pesticides and innovative cosmetic formulations. As consumers increasingly demand personalized healthcare solutions and natural ingredients for skincare, MCA plays a key role in creating effective, non-toxic, and eco-friendly products. The chemical industry is seeing trends toward green chemistry solutions, with a focus on renewable resources and plant-based ingredients in line with organic farming practices and biodegradable detergents. Regulatory compliance, including MCA safety regulations and chemical safety standards, ensures consumer protection. As the industry embraces responsible manufacturing, circular economy models, and packaging sustainability, the MCA market is poised for growth, contributing to environmental conservation, water scarcity solutions, and reduced carbon footprints in agriculture and cosmetics.
|
Market Scope |
|
|
Report Coverage |
Details |
|
Page number |
183 |
|
Base year |
2023 |
|
Historic period |
2018-2022 |
|
Forecast period |
2024-2028 |
|
Growth momentum & CAGR |
Accelerate at a CAGR of 2.5% |
|
Market growth 2024-2028 |
USD 115.8 million |
|
Market structure |
Fragmented |
|
YoY growth 2023-2024(%) |
2.4 |
|
Key countries |
US, China, Japan, and Germany |
|
Competitive landscape |
Leading Companies, Market Positioning of Companies, Competitive Strategies, and Industry Risks |
What are the Key Data Covered in this Market Research and Growth Report?
- CAGR of the market during the forecast period
- Detailed information on factors that will drive the market growth and forecasting between 2024 and 2028
- Precise estimation of the size of the market and its contribution of the market in focus to the parent market
- Accurate predictions about upcoming market growth and trends and changes in consumer behaviour
- Growth of the market across APAC, North America, Europe, South America, and Middle East and Africa
- Thorough analysis of the market's competitive landscape and detailed information about companies
- Comprehensive analysis of factors that will challenge the growth of market companies
We can help! Our analysts can customize this market research report to meet your requirements. Get in touch


