Moocs Market Analysis, Size, and Forecast 2026-2030: North America (US, Canada, and Mexico), APAC (China, India, and Japan), Europe (UK, Germany, and France), South America (Brazil, Argentina, and Colombia), Middle East and Africa (South Africa, UAE, and Saudi Arabia), and Rest of World (ROW)

Moocs Market Analysis, Size, and Forecast 2026-2030:
North America (US, Canada, and Mexico), APAC (China, India, and Japan), Europe (UK, Germany, and France), South America (Brazil, Argentina, and Colombia), Middle East and Africa (South Africa, UAE, and Saudi Arabia), and Rest of World (ROW)

Published: Mar 2026 303 Pages SKU: IRTNTR40509

Market Overview at a Glance

$85.38 B
Market Opportunity
37.6%
CAGR 2025 - 2030
35.9%
APAC Growth
$11.16 B
xMOOCs segment 2024

Moocs Market Size 2026-2030
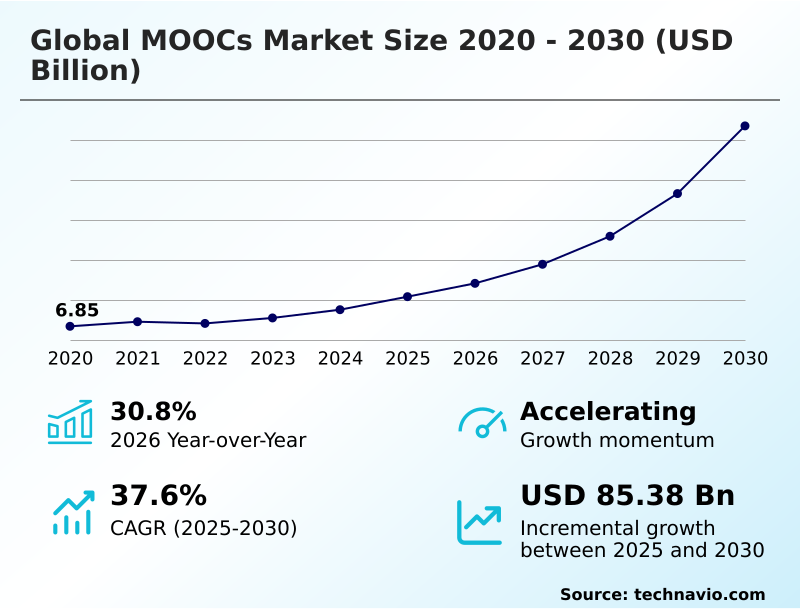
The moocs market size is valued to increase by USD 85.38 billion, at a CAGR of 37.6% from 2025 to 2030. Rise in regional MOOCs will drive the moocs market.

Major Market Trends & Insights

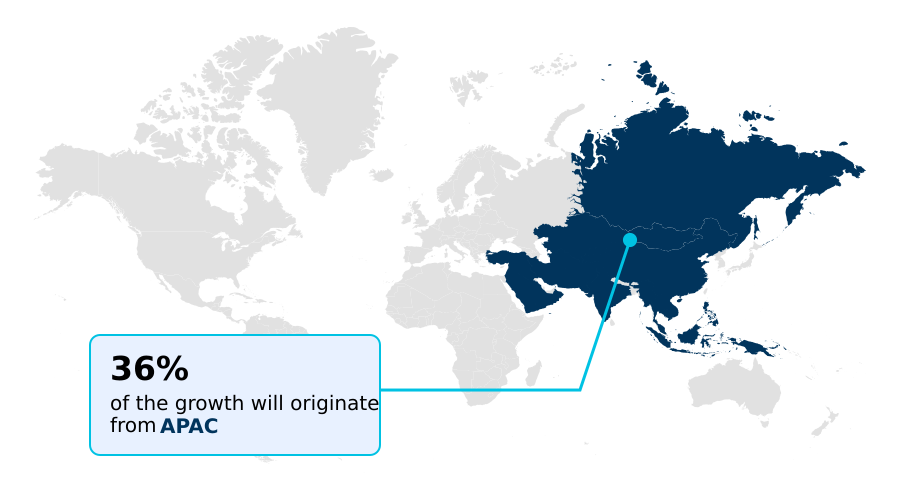
  • APAC dominated the market and accounted for a 35.9% growth during the forecast period.
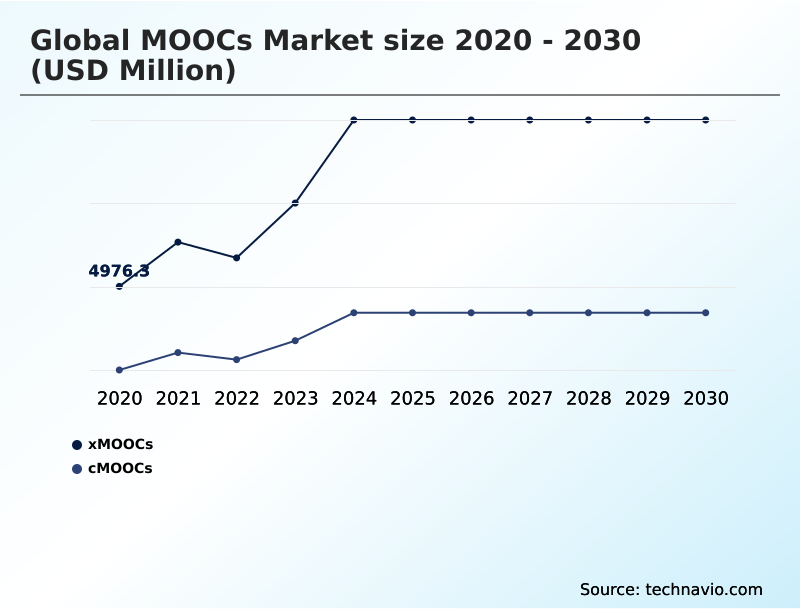
  • By Type - xMOOCs segment was valued at USD 11.16 billion in 2024
  • By Subjects - Technology segment accounted for the largest market revenue share in 2024

Market Size & Forecast

  • Market Opportunities: USD 100.20 billion
  • Market Future Opportunities: USD 85.38 billion
  • CAGR from 2025 to 2030 : 37.6%

Market Summary

  • The MOOCs market is rapidly evolving from a source of supplemental education into an essential engine for workforce development and skills-based learning. Driven by the urgent need for continuous reskilling and upskilling, corporations and individuals alike are turning to online learning platforms for flexible and targeted professional development courses.
  • A significant trend is the integration of big data analytics in education, which enables the creation of highly personalized learning paths that adapt to an individual's progress, significantly improving student engagement metrics. However, the industry grapples with challenges related to the credential legitimacy of digital course certificates and persistently low course completion rates.
  • For instance, a multinational logistics firm can deploy standardized corporate training modules via a learning management system to its global workforce, ensuring uniform compliance training across regions while tracking completion through learning analytics dashboards.
  • This approach not only streamlines training but also provides valuable data for internal talent gap analysis, making the case for lifelong learning programs as a strategic imperative. The future will be defined by stronger academic-industry partnerships and the adoption of advanced instructional design models, including gamified learning environments, to create more effective and engaging learning experiences.

What will be the Size of the Moocs Market during the forecast period?

Get Key Insights on Market Forecast (PDF) Request Free Sample

How is the Moocs Market Segmented?

The moocs industry research report provides comprehensive data (region-wise segment analysis), with forecasts and estimates in "USD million" for the period 2026-2030, as well as historical data from 2020-2024 for the following segments.

  • Type
    • xMOOCs
    • cMOOCs
  • Subjects
    • Technology
    • Science
    • Business and management
    • Arts and humanities
    • Others
  • End-user
    • Students
    • Professionals
    • Corporates
  • Geography
    • North America
      • US
      • Canada
      • Mexico
    • APAC
      • China
      • India
      • Japan
    • Europe
      • UK
      • Germany
      • France
    • South America
      • Brazil
      • Argentina
      • Colombia
    • Middle East and Africa
      • South Africa
      • UAE
      • Saudi Arabia
    • Rest of World (ROW)

By Type Insights

The xmoocs segment is estimated to witness significant growth during the forecast period.

The MOOCs market is segmented by approach, with content-centric MOOCs (xMOOCs) representing a significant share. This model emphasizes a structured, scalable approach to open access education, mirroring traditional university-level courses.

It relies on predefined curriculum development and centralized knowledge dissemination, often integrated within institutional learning management systems. Key features include automated grading systems and a focus on self-paced learning, which are pivotal to its scalability.

However, platforms using these instructional design models face challenges with course completion rates. To combat this, providers are improving the user experience (UX) in learning and implementing various learner motivation techniques.

Enhanced models now incorporate blended learning solutions and grant digital badges and credentials, with some platforms reporting a 15% improvement in student engagement metrics after redesigning course interactivity.

Request Free Sample

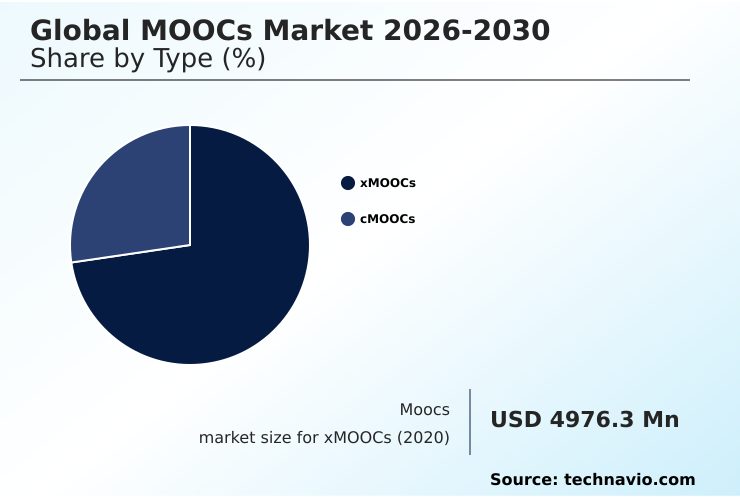
The xMOOCs segment was valued at USD 11.16 billion in 2024 and showed a gradual increase during the forecast period.

Request Free Sample

Regional Analysis

APAC is estimated to contribute 35.9% to the growth of the global market during the forecast period.Technavio’s analysts have elaborately explained the regional trends and drivers that shape the market during the forecast period.

See How Moocs Market Demand is Rising in APAC Request Free Sample

The geographic landscape is shifting toward regional learning hubs, with the APAC region showing a growth momentum approximately 2% higher than North America's. This is driven by demand for localized multilingual course offerings and government-led digital initiatives.

Leading online learning platforms are investing in cloud-based learning infrastructure to improve digital content delivery across these diverse markets.

A key strategy is focusing on mobile learning applications to support self-paced learning, as mobile penetration in emerging economies often outpaces broadband.

In mature markets like North America and Europe, there is a clear trend toward hybrid learning models and blended learning solutions that combine online and in-person instruction.

These regions are also seeing higher adoption of subscription-based learning for continuing education credits and are pioneering the use of adaptive learning technologies to create more effective and inclusive education design.

Market Dynamics

Our researchers analyzed the data with 2025 as the base year, along with the key drivers, trends, and challenges. A holistic analysis of drivers will help companies refine their marketing strategies to gain a competitive advantage.

  • Strategic discussions in the MOOCs market center on critical operational and pedagogical questions. A primary focus is the impact of gamification on student engagement and developing methods for assessing soft skills development online. For corporate clients, measuring ROI of corporate MOOC training is paramount, directly influencing the corporate adoption of skills-based hiring.
  • Technologically, the industry is exploring the role of AI in personalized learning paths and using big data for curriculum optimization. There's ongoing debate when comparing xMOOC and cMOOC effectiveness for different learning goals.
  • Key operational challenges include overcoming low MOOC completion rates, addressing the challenges of proctoring online exams, and facilitating peer assessment at scale, all while ensuring data privacy in online learning. Future growth hinges on building credibility for digital certificates and understanding the future of micro-credentials in hiring.
  • Success also depends on implementing best practices for instructional design and effective strategies for effective online collaboration, including building community in online courses. From a technical standpoint, the focus is on integrating VR labs in science courses and adopting mobile-first design for learning platforms.
  • From a strategic view, the development of blended learning models in higher education and developing regional MOOCs for local markets are key expansion vectors, representing a market shift where platform revenue from corporate training is over 40% higher than individual learner segments.

What are the key market drivers leading to the rise in the adoption of Moocs Industry?
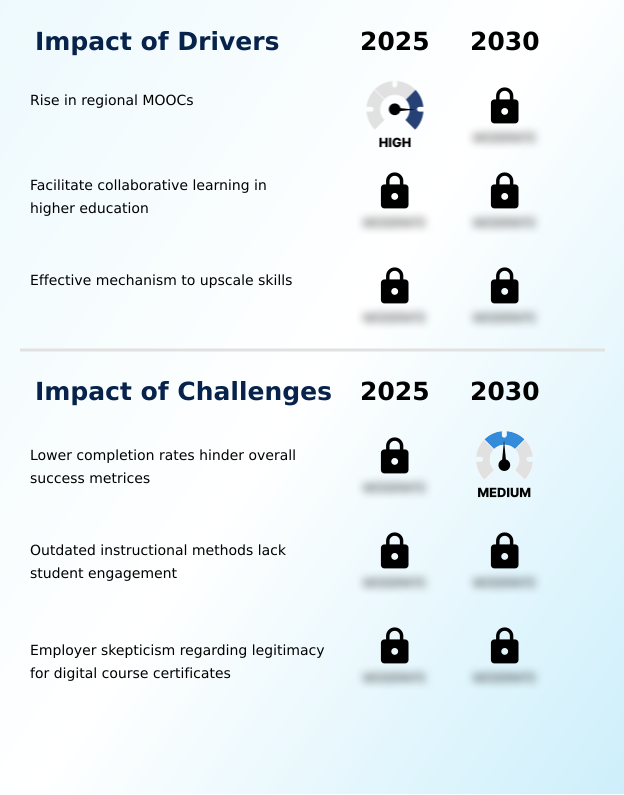
  • A key market driver is the rise of regional MOOCs, which cater to local linguistic and cultural needs, thereby expanding the accessibility of online education worldwide.

  • The market is significantly driven by corporate demand for effective workforce upskilling programs. Companies are increasingly adopting skills-based learning through tailored corporate training modules and professional development courses as primary employee training solutions.
  • This shift addresses persistent challenges in talent gap analysis, with corporations reporting that targeted reskilling and upskilling initiatives can fill internal roles 50% faster than external hiring.
  • The growth of academic-industry partnerships is fueling the creation of relevant career-oriented learning paths and even entire online degree programs. These collaborations ensure that lifelong learning programs deliver crucial technical skill acquisition aligned with industry needs.
  • This alignment is further refined through data-driven pedagogy, which optimizes course content to meet specific corporate objectives, boosting employee performance post-training.

What are the market trends shaping the Moocs Industry?

  • The extensive application of Massive Open Online Courses (MOOCs) in corporate training is emerging as a defining market trend. This shift addresses the growing demand for scalable and continuous workforce development.

  • A key trend fueling the digital transformation in education is the adoption of sophisticated technologies to enhance learner outcomes. Platforms are creating gamified learning environments and deploying big data analytics in education to create data-driven personalized learning paths.
  • This focus on competency-based education supports effective student retention strategies, with learning analytics dashboards showing that personalized content can improve learner persistence by over 20%. The use of interactive learning tools, virtual reality labs, and collaborative peer assessment models is also growing. This evolution directly boosts credential legitimacy, as employers now value technology-driven skill validation.
  • As a result, micro-credentials are becoming central to career pivot strategies, with job placement rates for certified learners increasing by up to 35% in high-demand tech fields.

What challenges does the Moocs Industry face during its growth?

  • A primary challenge affecting industry growth is the lower completion rates of online courses, which hinder overall success metrics and the perceived effectiveness of digital platforms.

  • A primary challenge for online course providers is establishing the credential legitimacy of digital course certificates. Employers remain skeptical without robust skill validation mechanisms, such as rigorous proctored online exams, which are complex to scale. This skepticism impacts the perceived value of credentials, making it difficult for providers when measuring learning outcomes.
  • Furthermore, while connectivist MOOCs (cMOOCs) use social learning features and peer-to-peer interaction tools to improve engagement, they often struggle with a lack of structure, affecting student retention strategies. While a 30% rise in collaborative tool usage is noted, effectively assessing soft skills development in these unstructured environments remains a hurdle.
  • Ensuring that accessible learning platforms can support high-bandwidth virtual classroom technology for all users, regardless of digital infrastructure, also presents a significant operational constraint.

Exclusive Technavio Analysis on Customer Landscape

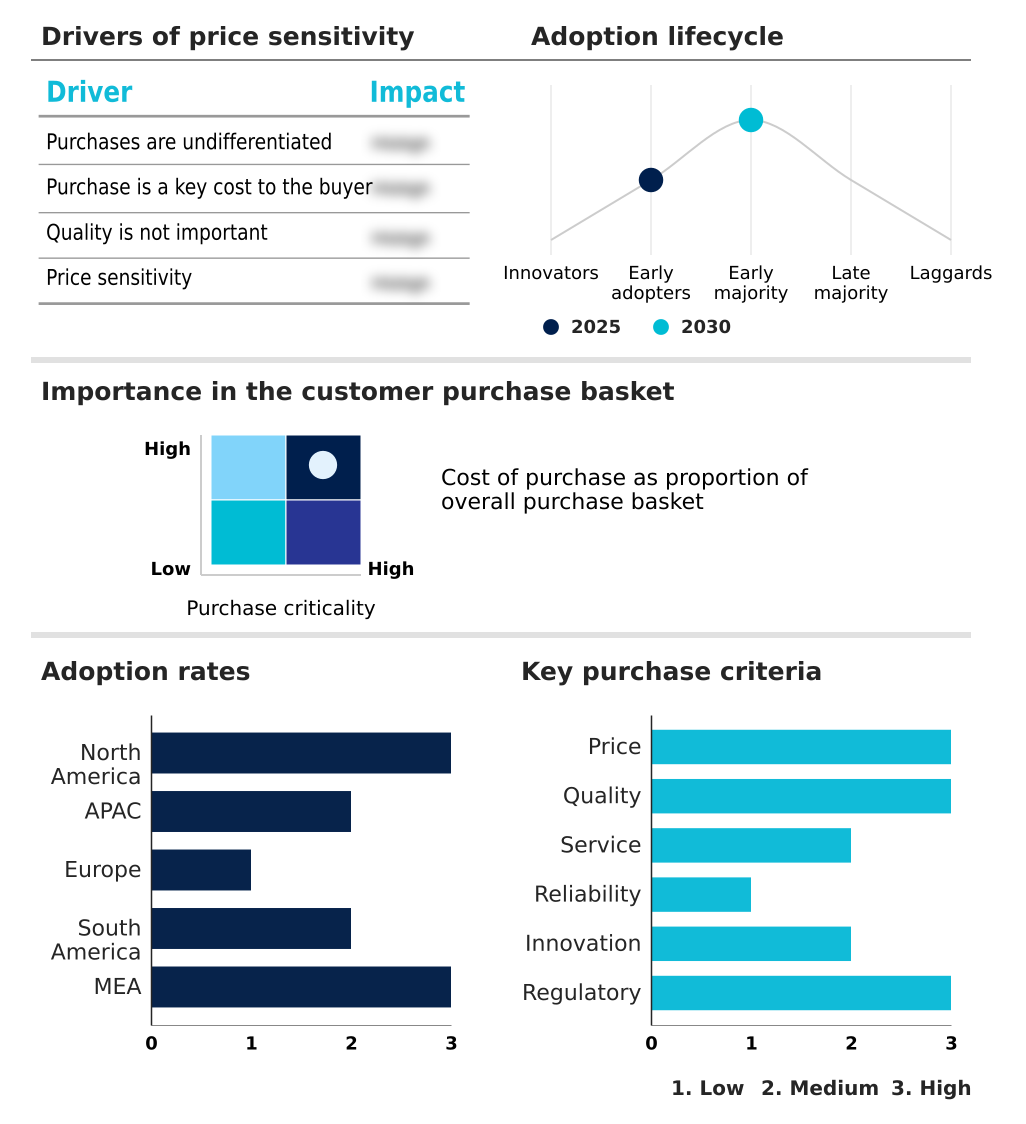
The moocs market forecasting report includes the adoption lifecycle of the market, covering from the innovator’s stage to the laggard’s stage. It focuses on adoption rates in different regions based on penetration. Furthermore, the moocs market report also includes key purchase criteria and drivers of price sensitivity to help companies evaluate and develop their market growth analysis strategies.

Customer Landscape of Moocs Industry

Competitive Landscape

Companies are implementing various strategies, such as strategic alliances, moocs market forecast, partnerships, mergers and acquisitions, geographical expansion, and product/service launches, to enhance their presence in the industry.

2U Inc. - Vendors provide a spectrum of online learning solutions, from university-affiliated degree programs to professional micro-credentials, addressing diverse upskilling and educational needs.

The industry research and growth report includes detailed analyses of the competitive landscape of the market and information about key companies, including:

  • 2U Inc.
  • Accenture Plc
  • Brilliant Worldwide Inc.
  • Coursera Inc.
  • DataCamp Inc.
  • Domestika Inc.
  • FutureLearn Ltd.
  • Kadenze Inc.
  • Microsoft Corp.
  • Mindvalley Inc.
  • OpenClassrooms SAS
  • Pearson Plc
  • Pluralsight LLC
  • SAP SE
  • Simplilearn Solutions Pvt. Ltd.
  • SkillShare Inc.
  • Skillsoft Corp.
  • Udemy Inc.
  • XuetangX

Qualitative and quantitative analysis of companies has been conducted to help clients understand the wider business environment as well as the strengths and weaknesses of key industry players. Data is qualitatively analyzed to categorize companies as pure play, category-focused, industry-focused, and diversified; it is quantitatively analyzed to categorize companies as dominant, leading, strong, tentative, and weak.

Recent Development and News in Moocs market

  • In January 2025, the Indian Institute of Management Bangalore launched its first Hindi MOOCs programme on the SWAYAM platform to broaden access to sustainability education for students and professionals.
  • In April 2025, Coursera Inc. announced the launch of AI-dubbed MOOCs in multiple languages, including Spanish and German, to expand its global reach to non-English learners.
  • In April 2025, FutureLearn Ltd. announced a partnership with Strategic Gears Academy to expand its MOOC delivery across Saudi Arabia, aligning with national workforce development goals.
  • In May 2025, Banaras Hindu University unveiled 63 new SWAYAM MOOCs, significantly expanding the national platform's free online course catalog across disciplines like engineering, commerce, and law.

Dive into Technavio’s robust research methodology, blending expert interviews, extensive data synthesis, and validated models for unparalleled Moocs Market insights. See full methodology.

Market Scope
Page number 303
Base year 2025
Historic period 2020-2024
Forecast period 2026-2030
Growth momentum & CAGR Accelerate at a CAGR of 37.6%
Market growth 2026-2030 USD 85383.4 million
Market structure Fragmented
YoY growth 2025-2026(%) 30.8%
Key countries US, Canada, Mexico, China, India, Japan, South Korea, Australia, Indonesia, UK, Germany, France, Italy, Spain, The Netherlands, Brazil, Argentina, Colombia, South Africa, UAE, Saudi Arabia, Egypt and Turkey
Competitive landscape Leading Companies, Market Positioning of Companies, Competitive Strategies, and Industry Risks

Request Free Sample

Research Analyst Overview

  • The MOOCs market is defined by its ecosystem of online learning platforms offering lifelong learning programs and professional development courses. These platforms leverage diverse instructional design models and adaptive learning technologies for digital content delivery, supported by robust cloud-based learning infrastructure and learning management systems.
  • A key focus is on improving student engagement metrics through interactive learning tools, gamified learning environments, and social learning features. The shift towards skills-based learning is driving demand for micro-credentials and digital course certificates, validated through strong skill validation mechanisms and proctored online exams. Pedagogy is evolving with data-driven pedagogy, big data analytics in education, and personalized learning paths.
  • Platforms are differentiating between content-centric MOOCs (xMOOCs) and connectivist MOOCs (cMOOCs), with many adopting hybrid learning models and blended learning solutions. For engagement, peer assessment models, peer-to-peer interaction tools, and virtual classroom technology are essential. The market is also seeing innovation in virtual reality labs and mobile learning applications.
  • For enterprises, tailored corporate training modules are critical for workforce upskilling programs, with outcomes measured by course completion rates and validated by digital badges and credentials that enhance career-oriented learning paths managed by automated grading systems.

What are the Key Data Covered in this Moocs Market Research and Growth Report?

  • What is the expected growth of the Moocs Market between 2026 and 2030?

    • USD 85.38 billion, at a CAGR of 37.6%

  • What segmentation does the market report cover?

    • The report is segmented by Type (xMOOCs, and cMOOCs), Subjects (Technology, Science, Business and management, Arts and humanities, and Others), End-user (Students, Professionals, and Corporates) and Geography (North America, APAC, Europe, South America, Middle East and Africa)

  • Which regions are analyzed in the report?

    • North America, APAC, Europe, South America and Middle East and Africa

  • What are the key growth drivers and market challenges?

    • Rise in regional MOOCs, Lower completion rates hinder overall success metrices

  • Who are the major players in the Moocs Market?

    • 2U Inc., Accenture Plc, Brilliant Worldwide Inc., Coursera Inc., DataCamp Inc., Domestika Inc., FutureLearn Ltd., Kadenze Inc., Microsoft Corp., Mindvalley Inc., OpenClassrooms SAS, Pearson Plc, Pluralsight LLC, SAP SE, Simplilearn Solutions Pvt. Ltd., SkillShare Inc., Skillsoft Corp., Udemy Inc. and XuetangX

Market Research Insights

  • The MOOCs market champions open access education through diverse online course providers offering everything from university-level courses and online degree programs to vocational training online. This digital education ecosystem supports both self-paced learning and structured pathways for technical skill acquisition and soft skills development.
  • For corporations, these platforms are vital employee training solutions, addressing talent gap analysis through targeted reskilling and upskilling. With corporate L&D budgets showing a 25% higher allocation to digital credentials over traditional seminars, the focus on measuring learning outcomes is critical. For individuals, these platforms facilitate career pivot strategies and provide continuing education credits.
  • Success hinges on effective student retention strategies, superior user experience (UX) in learning, and strong learner motivation techniques. Behind the scenes, excellence in educational content creation and curriculum development is key. The industry’s growth is fueled by academic-industry partnerships, the creation of regional learning hubs with multilingual course offerings, and a commitment to inclusive education design on accessible learning platforms.
  • The shift to competency-based education and subscription-based learning models has improved credential legitimacy by 40% among employers.

We can help! Our analysts can customize this moocs market research report to meet your requirements.

Get in touch

1. Executive Summary

1.1 Market overview

Executive Summary - Chart on Market Overview
Executive Summary - Data Table on Market Overview
Executive Summary - Chart on Global Market Characteristics
Executive Summary - Chart on Market by Geography
Executive Summary - Chart on Market Segmentation by Type
Executive Summary - Chart on Market Segmentation by Subjects
Executive Summary - Chart on Market Segmentation by End-user
Executive Summary - Chart on Incremental Growth
Executive Summary - Data Table on Incremental Growth
Executive Summary - Chart on Company Market Positioning

2. Technavio Analysis

2.1 Analysis of price sensitivity, lifecycle, customer purchase basket, adoption rates, and purchase criteria

2.2 Criticality of inputs and Factors of differentiation

Chart on Overview on criticality of inputs and factors of differentiation

2.3 Factors of disruption

Chart on Overview on factors of disruption

2.4 Impact of drivers and challenges

Chart on Impact of drivers and challenges in 2025 and 2030

3. Market Landscape

3.1 Market ecosystem

Chart on Parent Market
Data Table on - Parent Market

3.2 Market characteristics

Chart on Market characteristics analysis

3.3 Value chain analysis

Chart on Value chain analysis

4. Market Sizing

4.1 Market definition

Data Table on Offerings of companies included in the market definition

4.2 Market segment analysis

Market segments

4.3 Market size 2025

4.4 Market outlook: Forecast for 2025-2030

Chart on Global - Market size and forecast 2025-2030 ($ million)
Data Table on Global - Market size and forecast 2025-2030 ($ million)
Chart on Global Market: Year-over-year growth 2025-2030 (%)
Data Table on Global Market: Year-over-year growth 2025-2030 (%)

5. Historic Market Size

5.1 Global MOOCs Market 2020 - 2024

Historic Market Size - Data Table on Global MOOCs Market 2020 - 2024 ($ million)

5.2 Type segment analysis 2020 - 2024

Historic Market Size - Type Segment 2020 - 2024 ($ million)

5.3 Subjects segment analysis 2020 - 2024

Historic Market Size - Subjects Segment 2020 - 2024 ($ million)

5.4 End-user segment analysis 2020 - 2024

Historic Market Size - End-user Segment 2020 - 2024 ($ million)

5.5 Geography segment analysis 2020 - 2024

Historic Market Size - Geography Segment 2020 - 2024 ($ million)

5.6 Country segment analysis 2020 - 2024

Historic Market Size - Country Segment 2020 - 2024 ($ million)

6. Qualitative Analysis

6.1 AI impact on the Global MOOCs Market

7. Five Forces Analysis

7.1 Five forces summary

Five forces analysis - Comparison between 2025 and 2030

7.2 Bargaining power of buyers

Bargaining power of buyers - Impact of key factors 2025 and 2030

7.3 Bargaining power of suppliers

Bargaining power of suppliers - Impact of key factors in 2025 and 2030

7.4 Threat of new entrants

Threat of new entrants - Impact of key factors in 2025 and 2030

7.5 Threat of substitutes

Threat of substitutes - Impact of key factors in 2025 and 2030

7.6 Threat of rivalry

Threat of rivalry - Impact of key factors in 2025 and 2030

7.7 Market condition

Chart on Market condition - Five forces 2025 and 2030

8. Market Segmentation by Type

8.1 Market segments

Chart on Type - Market share 2025-2030 (%)
Data Table on Type - Market share 2025-2030 (%)

8.2 Comparison by Type

Chart on Comparison by Type
Data Table on Comparison by Type

8.3 xMOOCs - Market size and forecast 2025-2030

Chart on xMOOCs - Market size and forecast 2025-2030 ($ million)
Data Table on xMOOCs - Market size and forecast 2025-2030 ($ million)
Chart on xMOOCs - Year-over-year growth 2025-2030 (%)
Data Table on xMOOCs - Year-over-year growth 2025-2030 (%)

8.4 cMOOCs - Market size and forecast 2025-2030

Chart on cMOOCs - Market size and forecast 2025-2030 ($ million)
Data Table on cMOOCs - Market size and forecast 2025-2030 ($ million)
Chart on cMOOCs - Year-over-year growth 2025-2030 (%)
Data Table on cMOOCs - Year-over-year growth 2025-2030 (%)

8.5 Market opportunity by Type

Market opportunity by Type ($ million)
Data Table on Market opportunity by Type ($ million)

9. Market Segmentation by Subjects

9.1 Market segments

Chart on Subjects - Market share 2025-2030 (%)
Data Table on Subjects - Market share 2025-2030 (%)

9.2 Comparison by Subjects

Chart on Comparison by Subjects
Data Table on Comparison by Subjects

9.3 Technology - Market size and forecast 2025-2030

Chart on Technology - Market size and forecast 2025-2030 ($ million)
Data Table on Technology - Market size and forecast 2025-2030 ($ million)
Chart on Technology - Year-over-year growth 2025-2030 (%)
Data Table on Technology - Year-over-year growth 2025-2030 (%)

9.4 Science - Market size and forecast 2025-2030

Chart on Science - Market size and forecast 2025-2030 ($ million)
Data Table on Science - Market size and forecast 2025-2030 ($ million)
Chart on Science - Year-over-year growth 2025-2030 (%)
Data Table on Science - Year-over-year growth 2025-2030 (%)

9.5 Business and management - Market size and forecast 2025-2030

Chart on Business and management - Market size and forecast 2025-2030 ($ million)
Data Table on Business and management - Market size and forecast 2025-2030 ($ million)
Chart on Business and management - Year-over-year growth 2025-2030 (%)
Data Table on Business and management - Year-over-year growth 2025-2030 (%)

9.6 Arts and humanities - Market size and forecast 2025-2030

Chart on Arts and humanities - Market size and forecast 2025-2030 ($ million)
Data Table on Arts and humanities - Market size and forecast 2025-2030 ($ million)
Chart on Arts and humanities - Year-over-year growth 2025-2030 (%)
Data Table on Arts and humanities - Year-over-year growth 2025-2030 (%)

9.7 Others - Market size and forecast 2025-2030

Chart on Others - Market size and forecast 2025-2030 ($ million)
Data Table on Others - Market size and forecast 2025-2030 ($ million)
Chart on Others - Year-over-year growth 2025-2030 (%)
Data Table on Others - Year-over-year growth 2025-2030 (%)

9.8 Market opportunity by Subjects

Market opportunity by Subjects ($ million)
Data Table on Market opportunity by Subjects ($ million)

10. Market Segmentation by End-user

10.1 Market segments

Chart on End-user - Market share 2025-2030 (%)
Data Table on End-user - Market share 2025-2030 (%)

10.2 Comparison by End-user

Chart on Comparison by End-user
Data Table on Comparison by End-user

10.3 Students - Market size and forecast 2025-2030

Chart on Students - Market size and forecast 2025-2030 ($ million)
Data Table on Students - Market size and forecast 2025-2030 ($ million)
Chart on Students - Year-over-year growth 2025-2030 (%)
Data Table on Students - Year-over-year growth 2025-2030 (%)

10.4 Professionals - Market size and forecast 2025-2030

Chart on Professionals - Market size and forecast 2025-2030 ($ million)
Data Table on Professionals - Market size and forecast 2025-2030 ($ million)
Chart on Professionals - Year-over-year growth 2025-2030 (%)
Data Table on Professionals - Year-over-year growth 2025-2030 (%)

10.5 Corporates - Market size and forecast 2025-2030

Chart on Corporates - Market size and forecast 2025-2030 ($ million)
Data Table on Corporates - Market size and forecast 2025-2030 ($ million)
Chart on Corporates - Year-over-year growth 2025-2030 (%)
Data Table on Corporates - Year-over-year growth 2025-2030 (%)

10.6 Market opportunity by End-user

Market opportunity by End-user ($ million)
Data Table on Market opportunity by End-user ($ million)

11. Customer Landscape

11.1 Customer landscape overview

Analysis of price sensitivity, lifecycle, customer purchase basket, adoption rates, and purchase criteria

12. Geographic Landscape

12.1 Geographic segmentation

Chart on Market share by geography 2025-2030 (%)
Data Table on Market share by geography 2025-2030 (%)

12.2 Geographic comparison

Chart on Geographic comparison
Data Table on Geographic comparison

12.3 North America - Market size and forecast 2025-2030

Chart on North America - Market size and forecast 2025-2030 ($ million)
Data Table on North America - Market size and forecast 2025-2030 ($ million)
Chart on North America - Year-over-year growth 2025-2030 (%)
Data Table on North America - Year-over-year growth 2025-2030 (%)
Chart on Regional Comparison - North America
Data Table on Regional Comparison - North America

12.3.1 US - Market size and forecast 2025-2030

Chart on US - Market size and forecast 2025-2030 ($ million)
Data Table on US - Market size and forecast 2025-2030 ($ million)
Chart on US - Year-over-year growth 2025-2030 (%)
Data Table on US - Year-over-year growth 2025-2030 (%)

12.3.2 Canada - Market size and forecast 2025-2030

Chart on Canada - Market size and forecast 2025-2030 ($ million)
Data Table on Canada - Market size and forecast 2025-2030 ($ million)
Chart on Canada - Year-over-year growth 2025-2030 (%)
Data Table on Canada - Year-over-year growth 2025-2030 (%)

12.3.3 Mexico - Market size and forecast 2025-2030

Chart on Mexico - Market size and forecast 2025-2030 ($ million)
Data Table on Mexico - Market size and forecast 2025-2030 ($ million)
Chart on Mexico - Year-over-year growth 2025-2030 (%)
Data Table on Mexico - Year-over-year growth 2025-2030 (%)

12.4 APAC - Market size and forecast 2025-2030

Chart on APAC - Market size and forecast 2025-2030 ($ million)
Data Table on APAC - Market size and forecast 2025-2030 ($ million)
Chart on APAC - Year-over-year growth 2025-2030 (%)
Data Table on APAC - Year-over-year growth 2025-2030 (%)
Chart on Regional Comparison - APAC
Data Table on Regional Comparison - APAC

12.4.1 China - Market size and forecast 2025-2030

Chart on China - Market size and forecast 2025-2030 ($ million)
Data Table on China - Market size and forecast 2025-2030 ($ million)
Chart on China - Year-over-year growth 2025-2030 (%)
Data Table on China - Year-over-year growth 2025-2030 (%)

12.4.2 India - Market size and forecast 2025-2030

Chart on India - Market size and forecast 2025-2030 ($ million)
Data Table on India - Market size and forecast 2025-2030 ($ million)
Chart on India - Year-over-year growth 2025-2030 (%)
Data Table on India - Year-over-year growth 2025-2030 (%)

12.4.3 Japan - Market size and forecast 2025-2030

Chart on Japan - Market size and forecast 2025-2030 ($ million)
Data Table on Japan - Market size and forecast 2025-2030 ($ million)
Chart on Japan - Year-over-year growth 2025-2030 (%)
Data Table on Japan - Year-over-year growth 2025-2030 (%)

12.4.4 South Korea - Market size and forecast 2025-2030

Chart on South Korea - Market size and forecast 2025-2030 ($ million)
Data Table on South Korea - Market size and forecast 2025-2030 ($ million)
Chart on South Korea - Year-over-year growth 2025-2030 (%)
Data Table on South Korea - Year-over-year growth 2025-2030 (%)

12.4.5 Australia - Market size and forecast 2025-2030

Chart on Australia - Market size and forecast 2025-2030 ($ million)
Data Table on Australia - Market size and forecast 2025-2030 ($ million)
Chart on Australia - Year-over-year growth 2025-2030 (%)
Data Table on Australia - Year-over-year growth 2025-2030 (%)

12.4.6 Indonesia - Market size and forecast 2025-2030

Chart on Indonesia - Market size and forecast 2025-2030 ($ million)
Data Table on Indonesia - Market size and forecast 2025-2030 ($ million)
Chart on Indonesia - Year-over-year growth 2025-2030 (%)
Data Table on Indonesia - Year-over-year growth 2025-2030 (%)

12.5 Europe - Market size and forecast 2025-2030

Chart on Europe - Market size and forecast 2025-2030 ($ million)
Data Table on Europe - Market size and forecast 2025-2030 ($ million)
Chart on Europe - Year-over-year growth 2025-2030 (%)
Data Table on Europe - Year-over-year growth 2025-2030 (%)
Chart on Regional Comparison - Europe
Data Table on Regional Comparison - Europe

12.5.1 UK - Market size and forecast 2025-2030

Chart on UK - Market size and forecast 2025-2030 ($ million)
Data Table on UK - Market size and forecast 2025-2030 ($ million)
Chart on UK - Year-over-year growth 2025-2030 (%)
Data Table on UK - Year-over-year growth 2025-2030 (%)

12.5.2 Germany - Market size and forecast 2025-2030

Chart on Germany - Market size and forecast 2025-2030 ($ million)
Data Table on Germany - Market size and forecast 2025-2030 ($ million)
Chart on Germany - Year-over-year growth 2025-2030 (%)
Data Table on Germany - Year-over-year growth 2025-2030 (%)

12.5.3 France - Market size and forecast 2025-2030

Chart on France - Market size and forecast 2025-2030 ($ million)
Data Table on France - Market size and forecast 2025-2030 ($ million)
Chart on France - Year-over-year growth 2025-2030 (%)
Data Table on France - Year-over-year growth 2025-2030 (%)

12.5.4 Italy - Market size and forecast 2025-2030

Chart on Italy - Market size and forecast 2025-2030 ($ million)
Data Table on Italy - Market size and forecast 2025-2030 ($ million)
Chart on Italy - Year-over-year growth 2025-2030 (%)
Data Table on Italy - Year-over-year growth 2025-2030 (%)

12.5.5 Spain - Market size and forecast 2025-2030

Chart on Spain - Market size and forecast 2025-2030 ($ million)
Data Table on Spain - Market size and forecast 2025-2030 ($ million)
Chart on Spain - Year-over-year growth 2025-2030 (%)
Data Table on Spain - Year-over-year growth 2025-2030 (%)

12.5.6 The Netherlands - Market size and forecast 2025-2030

Chart on The Netherlands - Market size and forecast 2025-2030 ($ million)
Data Table on The Netherlands - Market size and forecast 2025-2030 ($ million)
Chart on The Netherlands - Year-over-year growth 2025-2030 (%)
Data Table on The Netherlands - Year-over-year growth 2025-2030 (%)

12.6 South America - Market size and forecast 2025-2030

Chart on South America - Market size and forecast 2025-2030 ($ million)
Data Table on South America - Market size and forecast 2025-2030 ($ million)
Chart on South America - Year-over-year growth 2025-2030 (%)
Data Table on South America - Year-over-year growth 2025-2030 (%)
Chart on Regional Comparison - South America
Data Table on Regional Comparison - South America

12.6.1 Brazil - Market size and forecast 2025-2030

Chart on Brazil - Market size and forecast 2025-2030 ($ million)
Data Table on Brazil - Market size and forecast 2025-2030 ($ million)
Chart on Brazil - Year-over-year growth 2025-2030 (%)
Data Table on Brazil - Year-over-year growth 2025-2030 (%)

12.6.2 Argentina - Market size and forecast 2025-2030

Chart on Argentina - Market size and forecast 2025-2030 ($ million)
Data Table on Argentina - Market size and forecast 2025-2030 ($ million)
Chart on Argentina - Year-over-year growth 2025-2030 (%)
Data Table on Argentina - Year-over-year growth 2025-2030 (%)

12.6.3 Colombia - Market size and forecast 2025-2030

Chart on Colombia - Market size and forecast 2025-2030 ($ million)
Data Table on Colombia - Market size and forecast 2025-2030 ($ million)
Chart on Colombia - Year-over-year growth 2025-2030 (%)
Data Table on Colombia - Year-over-year growth 2025-2030 (%)

12.7 Middle East and Africa - Market size and forecast 2025-2030

Chart on Middle East and Africa - Market size and forecast 2025-2030 ($ million)
Data Table on Middle East and Africa - Market size and forecast 2025-2030 ($ million)
Chart on Middle East and Africa - Year-over-year growth 2025-2030 (%)
Data Table on Middle East and Africa - Year-over-year growth 2025-2030 (%)
Chart on Regional Comparison - Middle East and Africa
Data Table on Regional Comparison - Middle East and Africa

12.7.1 South Africa - Market size and forecast 2025-2030

Chart on South Africa - Market size and forecast 2025-2030 ($ million)
Data Table on South Africa - Market size and forecast 2025-2030 ($ million)
Chart on South Africa - Year-over-year growth 2025-2030 (%)
Data Table on South Africa - Year-over-year growth 2025-2030 (%)

12.7.2 UAE - Market size and forecast 2025-2030

Chart on UAE - Market size and forecast 2025-2030 ($ million)
Data Table on UAE - Market size and forecast 2025-2030 ($ million)
Chart on UAE - Year-over-year growth 2025-2030 (%)
Data Table on UAE - Year-over-year growth 2025-2030 (%)

12.7.3 Saudi Arabia - Market size and forecast 2025-2030

Chart on Saudi Arabia - Market size and forecast 2025-2030 ($ million)
Data Table on Saudi Arabia - Market size and forecast 2025-2030 ($ million)
Chart on Saudi Arabia - Year-over-year growth 2025-2030 (%)
Data Table on Saudi Arabia - Year-over-year growth 2025-2030 (%)

12.7.4 Egypt - Market size and forecast 2025-2030

Chart on Egypt - Market size and forecast 2025-2030 ($ million)
Data Table on Egypt - Market size and forecast 2025-2030 ($ million)
Chart on Egypt - Year-over-year growth 2025-2030 (%)
Data Table on Egypt - Year-over-year growth 2025-2030 (%)

12.7.5 Turkey - Market size and forecast 2025-2030

Chart on Turkey - Market size and forecast 2025-2030 ($ million)
Data Table on Turkey - Market size and forecast 2025-2030 ($ million)
Chart on Turkey - Year-over-year growth 2025-2030 (%)
Data Table on Turkey - Year-over-year growth 2025-2030 (%)

12.8 Market opportunity by geography

Market opportunity by geography ($ million)
Data Tables on Market opportunity by geography ($ million)

13. Drivers, Challenges, and Opportunity

13.1 Market drivers

Rise in regional MOOCs
Facilitate collaborative learning in higher education
Effective mechanism to upscale skills

13.2 Market challenges

Lower completion rates hinder overall success metrices
Outdated instructional methods lack student engagement
Employer skepticism regarding legitimacy for digital course certificates

13.3 Impact of drivers and challenges

Impact of drivers and challenges in 2025 and 2030

13.4 Market opportunities

Extensive application of MOOCs in corporate training
Growing prominence of gamification
Big data analytics optimizing future personalized learning paths

14. Competitive Landscape

14.1 Overview

14.2

Overview on criticality of inputs and factors of differentiation

14.3 Landscape disruption

Overview on factors of disruption

14.4 Industry risks

Impact of key risks on business

15. Competitive Analysis

15.1 Companies profiled

Companies covered

15.2 Company ranking index

15.3 Market positioning of companies

Matrix on companies position and classification

15.4 2U Inc.

2U Inc. - Overview
2U Inc. - Business segments
2U Inc. - Key offerings
2U Inc. - Segment focus
SWOT

15.5 Accenture Plc

Accenture Plc - Overview
Accenture Plc - Business segments
Accenture Plc - Key news
Accenture Plc - Key offerings
Accenture Plc - Segment focus
SWOT

15.6 Brilliant Worldwide Inc.

Brilliant Worldwide Inc. - Overview
Brilliant Worldwide Inc. - Product / Service
Brilliant Worldwide Inc. - Key offerings
SWOT

15.7 Coursera Inc.

Coursera Inc. - Overview
Coursera Inc. - Business segments
Coursera Inc. - Key news
Coursera Inc. - Key offerings
Coursera Inc. - Segment focus
SWOT

15.8 DataCamp Inc.

DataCamp Inc. - Overview
DataCamp Inc. - Product / Service
DataCamp Inc. - Key offerings
SWOT

15.9 Domestika Inc.

Domestika Inc. - Overview
Domestika Inc. - Product / Service
Domestika Inc. - Key offerings
SWOT

15.10 Kadenze Inc.

Kadenze Inc. - Overview
Kadenze Inc. - Product / Service
Kadenze Inc. - Key offerings
SWOT

15.11 Microsoft Corp.

Microsoft Corp. - Overview
Microsoft Corp. - Business segments
Microsoft Corp. - Key news
Microsoft Corp. - Key offerings
Microsoft Corp. - Segment focus
SWOT

15.12 Mindvalley Inc.

Mindvalley Inc. - Overview
Mindvalley Inc. - Product / Service
Mindvalley Inc. - Key offerings
SWOT

15.13 OpenClassrooms SAS

OpenClassrooms SAS - Overview
OpenClassrooms SAS - Product / Service
OpenClassrooms SAS - Key offerings
SWOT

15.14 Pearson Plc

Pearson Plc - Overview
Pearson Plc - Business segments
Pearson Plc - Key news
Pearson Plc - Key offerings
Pearson Plc - Segment focus
SWOT

15.15 SAP SE

SAP SE - Overview
SAP SE - Business segments
SAP SE - Key news
SAP SE - Key offerings
SAP SE - Segment focus
SWOT

15.16 Simplilearn Solutions Pvt. Ltd.

Simplilearn Solutions Pvt. Ltd. - Overview
Simplilearn Solutions Pvt. Ltd. - Product / Service
Simplilearn Solutions Pvt. Ltd. - Key offerings
SWOT

15.17 SkillShare Inc.

SkillShare Inc. - Overview
SkillShare Inc. - Product / Service
SkillShare Inc. - Key offerings
SWOT

15.18 Udemy Inc.

Udemy Inc. - Overview
Udemy Inc. - Business segments
Udemy Inc. - Key news
Udemy Inc. - Key offerings
Udemy Inc. - Segment focus
SWOT

16. Appendix

16.1 Scope of the report

Market definition
Objectives
Notes and caveats

16.2 Inclusions and exclusions checklist

Inclusions checklist
Exclusions checklist

16.3 Currency conversion rates for US$

16.4 Research methodology

16.5 Data procurement

Information sources

16.6 Data validation

16.7 Validation techniques employed for market sizing

16.8 Data synthesis

16.9 360 degree market analysis

16.10 List of abbreviations

Research Methodology

Technavio presents a detailed picture of the market by way of study, synthesis, and summation of data from multiple sources. The analysts have presented the various facets of the market with a particular focus on identifying the key industry influencers. The data thus presented is comprehensive, reliable, and the result of extensive research, both primary and secondary.

INFORMATION SOURCES

Primary sources

  • Manufacturers and suppliers
  • Channel partners
  • Industry experts
  • Strategic decision makers

Secondary sources

  • Industry journals and periodicals
  • Government data
  • Financial reports of key industry players
  • Historical data
  • Press releases

DATA ANALYSIS

Data Synthesis

  • Collation of data
  • Estimation of key figures
  • Analysis of derived insights

Data Validation

  • Triangulation with data models
  • Reference against proprietary databases
  • Corroboration with industry experts

REPORT WRITING

Qualitative

  • Market drivers
  • Market challenges
  • Market trends
  • Five forces analysis

Quantitative

  • Market size and forecast
  • Market segmentation
  • Geographical insights
  • Competitive landscape

Interested in this report?

Get your sample now to see our research methodology and insights!

Download Now

Frequently Asked Questions

Moocs market growth will increase by USD 85383.4 million during 2026-2030.

The Moocs market is expected to grow at a CAGR of 37.6% during 2026-2030.

Moocs market is segmented by Type (xMOOCs, cMOOCs) Subjects (Technology, Science, Business and management, Arts and humanities, Others) End-user (Students, Professionals, Corporates)

2U Inc., Accenture Plc, Brilliant Worldwide Inc., Coursera Inc., DataCamp Inc., Domestika Inc., FutureLearn Ltd., Kadenze Inc., Microsoft Corp., Mindvalley Inc., OpenClassrooms SAS, Pearson Plc, Pluralsight LLC, SAP SE, Simplilearn Solutions Pvt. Ltd., SkillShare Inc., Skillsoft Corp., Udemy Inc., XuetangX are a few of the key vendors in the Moocs market.

APAC will register the highest growth rate of 35.9% among the other regions. Therefore, the Moocs market in APAC is expected to garner significant business opportunities for the vendors during the forecast period.

US, Canada, Mexico, China, India, Japan, South Korea, Australia, Indonesia, UK, Germany, France, Italy, Spain, The Netherlands, Brazil, Argentina, Colombia, South Africa, UAE, Saudi Arabia, Egypt, Turkey

  • Rise in regional MOOCs is the driving factor this market.

The Moocs market vendors should focus on grabbing business opportunities from the Type segment as it accounted for the largest market share in the base year.