Mpos Terminals Market Size 2026-2030
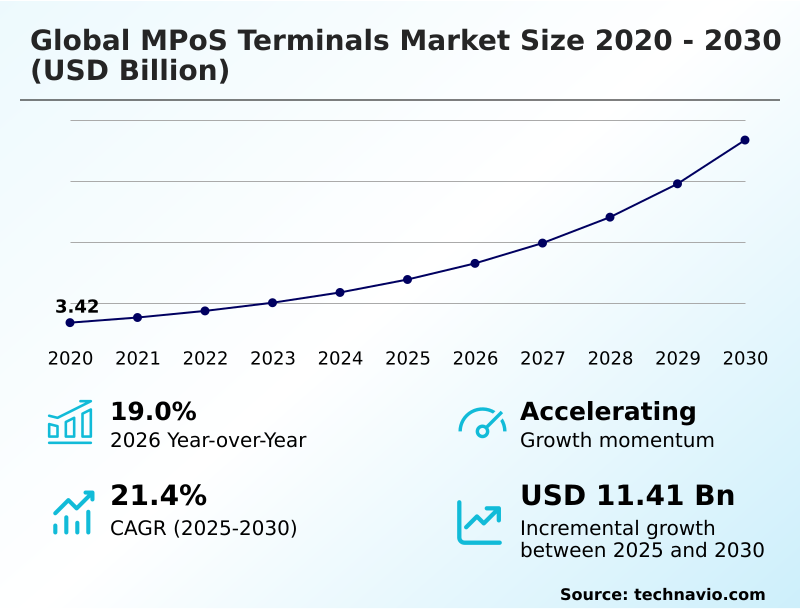
The mpos terminals market size is valued to increase by USD 11.41 billion, at a CAGR of 21.4% from 2025 to 2030. Rapid innovation in SoftPoS technology and hardware-free acceptance models will drive the mpos terminals market.
Major Market Trends & Insights
- APAC dominated the market and accounted for a 42% growth during the forecast period.
- By End-user - Retail segment was valued at USD 3.75 billion in 2024
- By Component - Hardware segment accounted for the largest market revenue share in 2024
Market Size & Forecast
- Market Opportunities: USD 14.94 billion
- Market Future Opportunities: USD 11.41 billion
- CAGR from 2025 to 2030 : 21.4%
Market Summary
- The mPoS terminals market is undergoing a significant transformation, moving beyond simple payment processing to become central to modern commerce operations. This evolution is driven by the demand for mobility in retail and hospitality, enabling capabilities like line-busting and tableside ordering.
- A key trend is the convergence of hardware and software, with android smart terminals functioning as app-based business hubs that integrate inventory management and customer loyalty programs. The adoption of cloud-native unified commerce allows for a single, real-time view across all sales channels, a critical factor for businesses implementing a buy-online-pick-up-in-store strategy, which can reduce fulfillment errors by over 25%.
- Growth is also propelled by softpos technology, which lowers entry barriers for micro-merchants. However, the industry faces challenges from intensifying cybersecurity vulnerabilities and the economic threat of hardware cannibalization from software-only solutions.
- Navigating the fragmented landscape of regulatory compliance, including pci mobile payments on cots standards, remains a persistent hurdle for manufacturers, impacting time-to-market for next-generation devices featuring biometric authentication and end-to-end encryption.
What will be the Size of the Mpos Terminals Market during the forecast period?
Get Key Insights on Market Forecast (PDF) Get Free Sample
How is the Mpos Terminals Market Segmented?
The mpos terminals industry research report provides comprehensive data (region-wise segment analysis), with forecasts and estimates in "USD million" for the period 2026-2030, as well as historical data from 2020-2024 for the following segments.
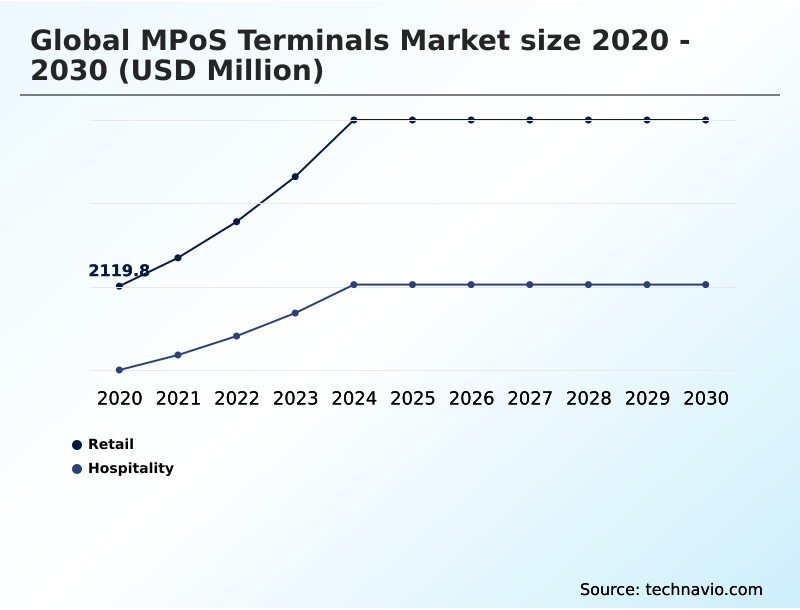
- End-user
- Retail
- Hospitality
- Component
- Hardware
- Software
- Services
- Product type
- Handheld terminals
- Tablets
- Others
- Geography
- APAC
- China
- India
- Japan
- North America
- US
- Canada
- Mexico
- Europe
- Germany
- UK
- France
- South America
- Brazil
- Argentina
- Middle East and Africa
- Saudi Arabia
- UAE
- South Africa
- Rest of World (ROW)
- APAC
By End-user Insights
The retail segment is estimated to witness significant growth during the forecast period.
The retail segment's adoption of mPoS technology is defined by a strategic shift toward unified commerce and omnichannel payment synchronization. Retailers are leveraging android smart terminals to enable mobile-first strategies, improving the customer journey with a frictionless user experience.
This includes streamlined omnichannel returns and rapid contactless transactions. The move toward hardware-free acceptance, driven by softpos technology, is expanding accessibility for smaller retailers.
Concurrently, platforms are integrating ai-driven fraud prevention for real-time transaction security, with some systems demonstrating a 40% increase in processing speed. This evolution provides deep data-driven insights, ensuring regulatory compliance while enhancing operational agility in a competitive landscape.
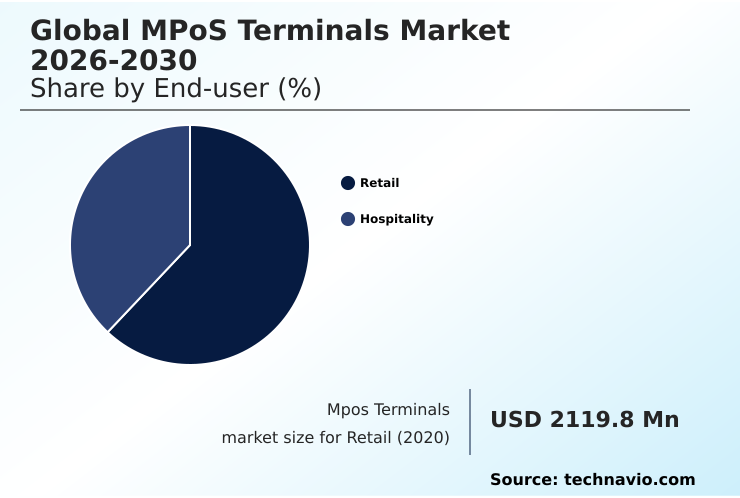
The Retail segment was valued at USD 3.75 billion in 2024 and showed a gradual increase during the forecast period.
Regional Analysis
APAC is estimated to contribute 42% to the growth of the global market during the forecast period.Technavio’s analysts have elaborately explained the regional trends and drivers that shape the market during the forecast period.

See How Mpos Terminals Market Demand is Rising in APAC Get Free Sample
The geographic landscape is marked by a divergence in adoption, with mature markets in North America and Europe prioritizing cloud-native unified commerce and ai-driven payment analytics for a data-centric retail approach.
These regions leverage high-speed processing for line-busting and managing customer loyalty programs. In contrast, emerging markets in APAC focus on portable payment processing and app-based business hubs to support micro-merchants.
The institutionalization of 5G connectivity ensures sub-ten-millisecond transaction speeds, while low-latency edge processing supports robust offline modes. However, all regions face challenges with cybersecurity vulnerabilities and the complex certification process for pci mobile payments on cots, influencing deployment strategies globally.
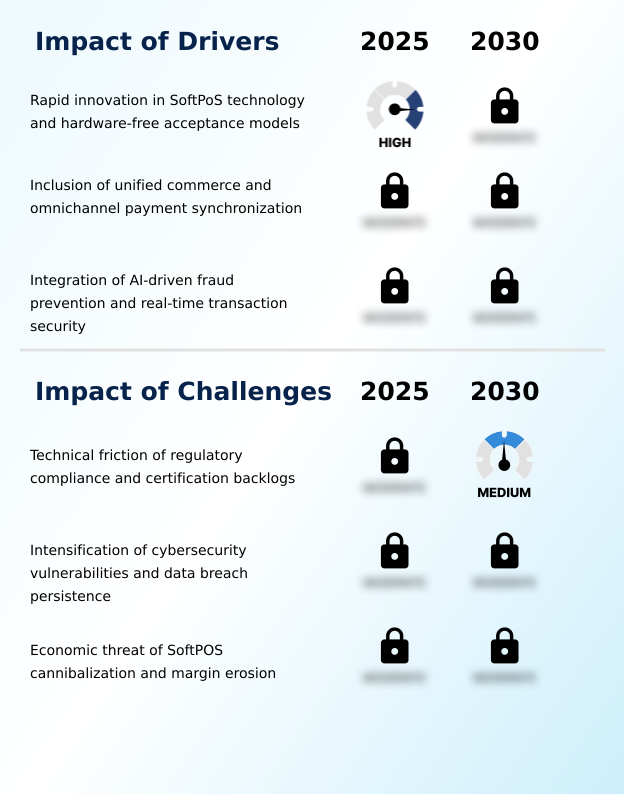
Market Dynamics
Our researchers analyzed the data with 2025 as the base year, along with the key drivers, trends, and challenges. A holistic analysis of drivers will help companies refine their marketing strategies to gain a competitive advantage.
- The strategic evolution of the mpos terminals market is multifaceted, focusing on enhancing operational agility and security. A key initiative involves transforming smartphones into secure payment terminals, which is closely linked to the rapid innovation in softpos tap-to-phone technology.
- This move toward software-only payment acceptance without peripherals presents an economic threat of softpos hardware cannibalization, compelling a necessary transitioning to integrated commerce platform providers. In this new paradigm, comparing security of smartphones vs terminals becomes critical, driving the ai-driven predictive threat modeling integration into payment gateways.
- For merchants, the benefits are clear, with unified commerce and omnichannel payment synchronization for retail becoming standard. The development of all-in-one android terminals that leverage a cloud-based architecture for inventory management is central to this shift. These systems apply machine learning for transaction pattern analysis, ensuring ai-driven fraud prevention for high-volume retail.
- The institutionalization of 5g and edge processing, with 5g enabling sub-ten-millisecond transaction speeds, provides the backbone for real-time transaction security in hospitality. However, the industry grapples with the technical friction of payment standard compliance and the intensification of cybersecurity data breach vulnerabilities.
- This is particularly true when using commercial off-the-shelf devices for payments, which requires high-security kernel architectures for pci mpoc to maintain integrity. The growth of software-based acceptance, which is expanding at nearly double the rate of dedicated hardware, highlights the urgency for traditional players to adapt their business models.
What are the key market drivers leading to the rise in the adoption of Mpos Terminals Industry?
- Rapid innovation in SoftPoS technology and the emergence of hardware-free acceptance models are key drivers propelling market growth.
- Key market drivers include the transition to unified commerce and the industrialization of omnichannel payments, with enterprise merchants driving a 44% year-over-year increase in processed volume by adopting such interconnected solutions.
- This requires the deployment of machine learning algorithms on cloud-native platforms for real-time inventory and customer data synchronization. Another major driver is the integration of AI-centric security, using behavioral biometrics and intelligent routing systems for fraud detection.
- The introduction of generative AI for predictive threat modeling is becoming a standard for enterprise-grade platforms.
- This is complemented by the move to 5G, which supports massive machine-type communications and network slicing, ensuring reliable, high-speed transaction processing and enabling a low-footprint point-of-sale ecosystem.
What are the market trends shaping the Mpos Terminals Industry?
- The market is witnessing a significant trend toward the development of all-in-one Android smart terminals. These devices are evolving into app-based business hubs that consolidate multiple operational functions.
- A dominant trend is the proliferation of all-in-one smart terminals that serve as multifaceted business hubs, offering value-added services beyond payments. These devices leverage cloud-native architectures for seamless property management systems integration and kitchen display systems integration, with some firms reporting that 60% of their revenue now comes from such advanced hardware.
- Concurrently, the rise of tap-to-phone certification, enabled by nfc protocols and high-security kernel architectures, is accelerating adoption in pop-up retail operations. This shift towards software-based solutions, which support biometric authentication and digital wallets, creates market tension through potential softpos cannibalization and margin erosion for traditional hardware providers, pushing them towards managed mpos models.
What challenges does the Mpos Terminals Industry face during its growth?
- The technical friction of regulatory compliance and persistent certification backlogs present a key challenge to industry growth.
- Primary market challenges stem from escalating cybersecurity threats and the complexities of regulatory compliance. The use of commercial off-the-shelf devices for payments expands the attack surface, necessitating robust security measures like end-to-end encryption and zero-trust network architectures.
- Another significant challenge is the economic threat from tap-to-phone technology, which is growing at nearly double the rate of dedicated hardware and cannibalizing sales. This forces manufacturers to differentiate through ruggedized hardware with integrated barcode scanners for specialized use cases.
- Furthermore, navigating fragmented global standards, including emv chip-and-pin standards, creates certification backlogs, delaying the launch of new terminals designed for card-present transactions and a seamless phygital shopping experience.
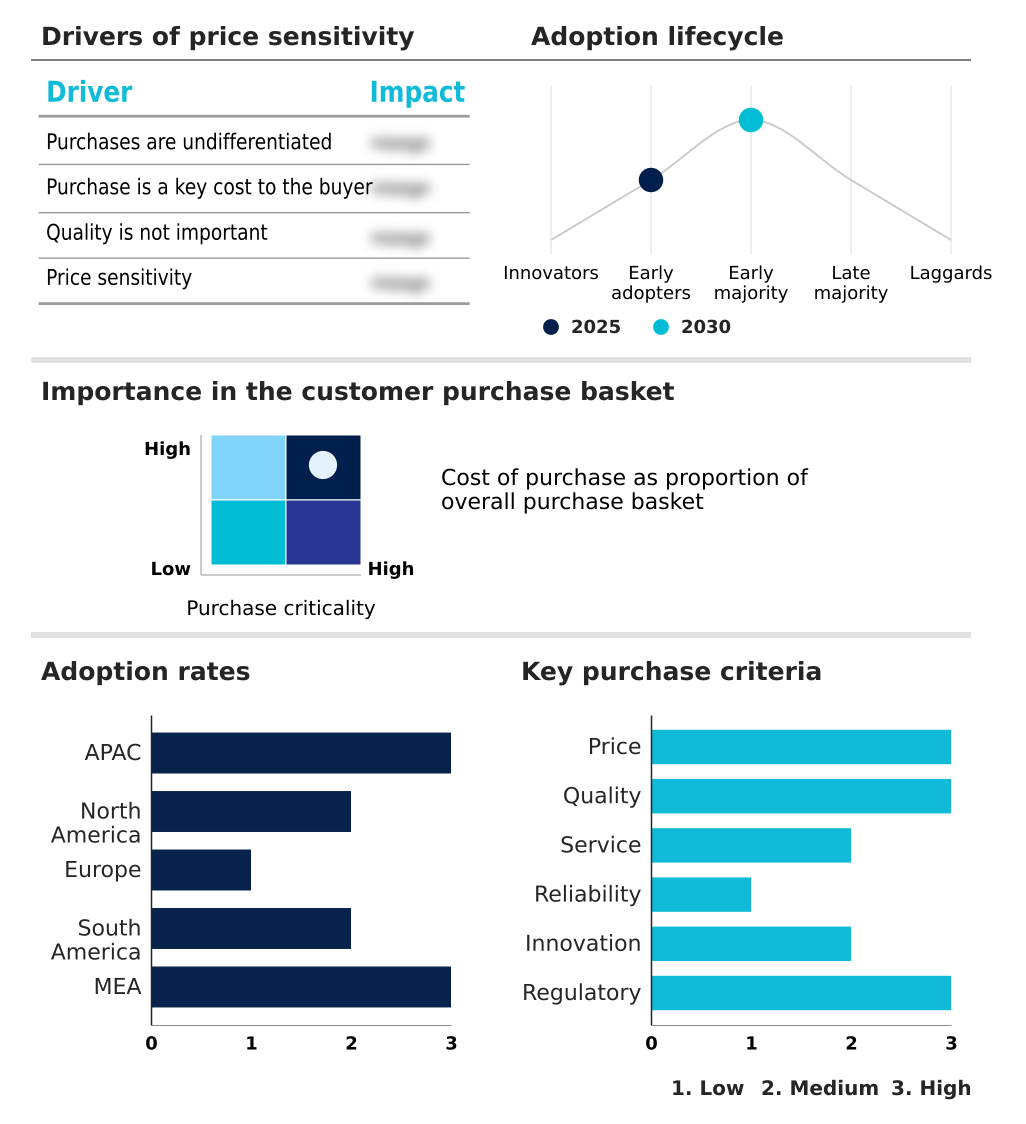
Exclusive Technavio Analysis on Customer Landscape
The mpos terminals market forecasting report includes the adoption lifecycle of the market, covering from the innovator’s stage to the laggard’s stage. It focuses on adoption rates in different regions based on penetration. Furthermore, the mpos terminals market report also includes key purchase criteria and drivers of price sensitivity to help companies evaluate and develop their market growth analysis strategies.
Customer Landscape of Mpos Terminals Industry
Competitive Landscape
Companies are implementing various strategies, such as strategic alliances, mpos terminals market forecast, partnerships, mergers and acquisitions, geographical expansion, and product/service launches, to enhance their presence in the industry.
Advantech Co. Ltd. - Vendors offer integrated hardware and software, from smart terminals to cloud platforms, enabling secure, omnichannel payment processing and data-driven insights for merchants globally.
The industry research and growth report includes detailed analyses of the competitive landscape of the market and information about key companies, including:
- Advantech Co. Ltd.
- BBPOS International Ltd.
- Block Inc.
- Castles Technology Co. Ltd.
- Elo Touch Solutions Inc.
- Fiserv Inc.
- Ingenico Group SA
- NCR Voyix Corp.
- New POS Technology Ltd.
- Newland Digital Technology Co. Ltd.
- Panasonic Holdings Corp.
- PAX Global Technology Ltd.
- Posiflex Technology Inc.
- Samsung Electronics Co. Ltd.
- Shift4 Payments Inc.
- SumUp Inc.
- VeriFone Inc.
- Zebra Technologies Corp.
Qualitative and quantitative analysis of companies has been conducted to help clients understand the wider business environment as well as the strengths and weaknesses of key industry players. Data is qualitatively analyzed to categorize companies as pure play, category-focused, industry-focused, and diversified; it is quantitatively analyzed to categorize companies as dominant, leading, strong, tentative, and weak.
Recent Development and News in Mpos terminals market
- In September 2024, PAX Global Technology Ltd. announced the global launch of its new A-series Android smart terminal, featuring enhanced biometric authentication and 5G connectivity to support unified commerce for enterprise retailers.
- In November 2024, SumUp Inc. secured a major funding round to accelerate the expansion of its SoftPOS and tap-to-phone solutions across North America, aiming to capture a larger share of the micro-merchant segment.
- In February 2025, VeriFone Inc. received the industry's first full PCI MPoC certification for its next-generation software kernel, enabling highly secure, hardware-free payment acceptance on commercial off-the-shelf (COTS) devices.
- In April 2025, Zebra Technologies Corp. unveiled a new line of ruggedized mPoS tablets specifically designed for logistics and field service applications, featuring extended battery life and industrial-grade barcode scanners.
Dive into Technavio’s robust research methodology, blending expert interviews, extensive data synthesis, and validated models for unparalleled Mpos Terminals Market insights. See full methodology.
| Market Scope | |
|---|---|
| Page number | 292 |
| Base year | 2025 |
| Historic period | 2020-2024 |
| Forecast period | 2026-2030 |
| Growth momentum & CAGR | Accelerate at a CAGR of 21.4% |
| Market growth 2026-2030 | USD 11408.1 million |
| Market structure | Fragmented |
| YoY growth 2025-2026(%) | 19.0% |
| Key countries | China, India, Japan, South Korea, Australia, Indonesia, US, Canada, Mexico, Germany, UK, France, Italy, Spain, The Netherlands, Brazil, Argentina, Chile, Saudi Arabia, UAE, South Africa, Turkey and Israel |
| Competitive landscape | Leading Companies, Market Positioning of Companies, Competitive Strategies, and Industry Risks |
Research Analyst Overview
- The mPoS market is defined by a critical pivot from single-purpose magnetic stripe readers to integrated commerce platforms. Boardroom decisions now center on adopting unified commerce through cloud-native architectures that support omnichannel payment synchronization. The rise of softpos technology and hardware-free acceptance models, driven by nfc protocols and tap-to-phone certification, challenges traditional hardware revenue through softpos cannibalization and margin erosion.
- To compete, vendors offer ruggedized hardware with integrated barcode scanners and digital signature capture, built on open-source operating systems. Security is paramount, with a focus on ai-driven fraud prevention, real-time transaction security, and end-to-end encryption. This involves implementing behavioral biometrics, intelligent routing systems, and high-security kernel architectures that adhere to pci mobile payments on cots standards.
- Next-generation android smart terminals, leveraging 5g connectivity and low-latency edge processing, function as app-based business hubs. These platforms utilize machine learning algorithms for ai-driven payment analytics, with some new processors enabling a 40% increase in transaction speed. The defense against cybersecurity vulnerabilities requires hardware-level security modules and zero-trust network architectures, while the push for emv chip-and-pin standards continues.
- Network slicing and support for massive machine-type communications are becoming essential features.
What are the Key Data Covered in this Mpos Terminals Market Research and Growth Report?
-
What is the expected growth of the Mpos Terminals Market between 2026 and 2030?
-
USD 11.41 billion, at a CAGR of 21.4%
-
-
What segmentation does the market report cover?
-
The report is segmented by End-user (Retail, and Hospitality), Component (Hardware, Software, and Services), Product Type (Handheld terminals, Tablets, and Others) and Geography (APAC, North America, Europe, South America, Middle East and Africa)
-
-
Which regions are analyzed in the report?
-
APAC, North America, Europe, South America and Middle East and Africa
-
-
What are the key growth drivers and market challenges?
-
Rapid innovation in SoftPoS technology and hardware-free acceptance models, Technical friction of regulatory compliance and certification backlogs
-
-
Who are the major players in the Mpos Terminals Market?
-
Advantech Co. Ltd., BBPOS International Ltd., Block Inc., Castles Technology Co. Ltd., Elo Touch Solutions Inc., Fiserv Inc., Ingenico Group SA, NCR Voyix Corp., New POS Technology Ltd., Newland Digital Technology Co. Ltd., Panasonic Holdings Corp., PAX Global Technology Ltd., Posiflex Technology Inc., Samsung Electronics Co. Ltd., Shift4 Payments Inc., SumUp Inc., VeriFone Inc. and Zebra Technologies Corp.
-
Market Research Insights
- The market's dynamics are shifting toward a frictionless user experience, driven by data-centric retail models. The adoption of unified commerce solutions has led to a 44% year-over-year increase in processed volume for some providers, underscoring the demand for a seamless phygital shopping experience that supports curbside transactions and tableside ordering.
- Mobile-first strategies enable line-busting and pop-up retail operations, while managed mpos models offer predictive remote monitoring for purpose-built hardware. The move to a low-footprint point-of-sale ecosystem supports both kitchen display systems integration and property management systems integration.
- This evolution is fueled by the demand for value-added services and robust customer loyalty programs, as merchants leverage data-driven insights to compete effectively in a landscape where tap-to-phone technology is increasingly prevalent.
We can help! Our analysts can customize this mpos terminals market research report to meet your requirements.
 RIA -
RIA - 
