
Musical Instrument Market Analysis, Size, and Forecast 2026-2030: North America (US, Canada, and Mexico), APAC (China, Japan, and India), Europe (Germany, UK, and France), South America (Brazil, Argentina, and Chile), Middle East and Africa (South Africa, Saudi Arabia, and UAE), and Rest of World (ROW)

Musical Instrument Market Analysis, Size, and Forecast 2026-2030:
North America (US, Canada, and Mexico), APAC (China, Japan, and India), Europe (Germany, UK, and France), South America (Brazil, Argentina, and Chile), Middle East and Africa (South Africa, Saudi Arabia, and UAE), and Rest of World (ROW)

Published: Oct 2026 312 Pages SKU: IRTNTR41536

Market Overview at a Glance

$2.16 B
Market Opportunity
3.9%
CAGR 2025 - 2030
49.2%
North America Growth
$3.98 B
String instruments segment 2024

Musical Instrument Market Size 2026-2030

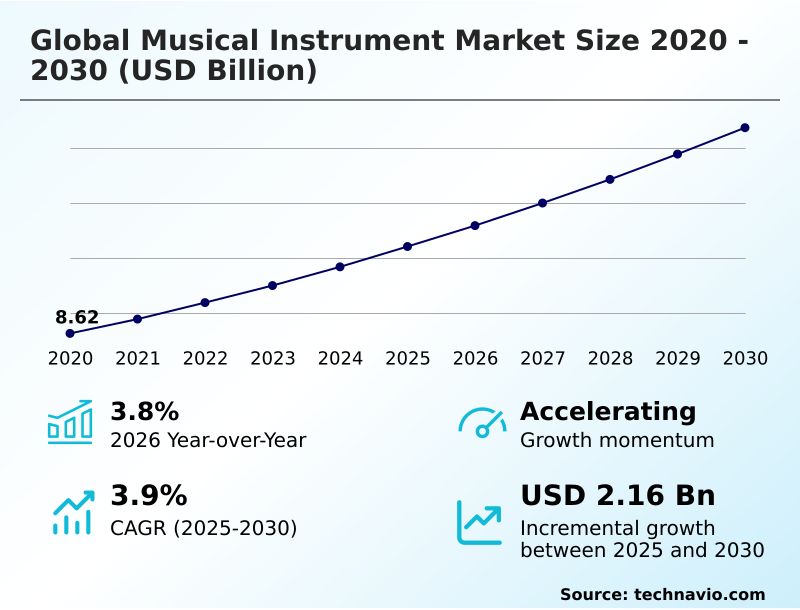
The musical instrument market size is valued to increase by USD 2.16 billion, at a CAGR of 3.9% from 2025 to 2030. Technological innovation and integration of smart features in digital instruments will drive the musical instrument market.

Major Market Trends & Insights

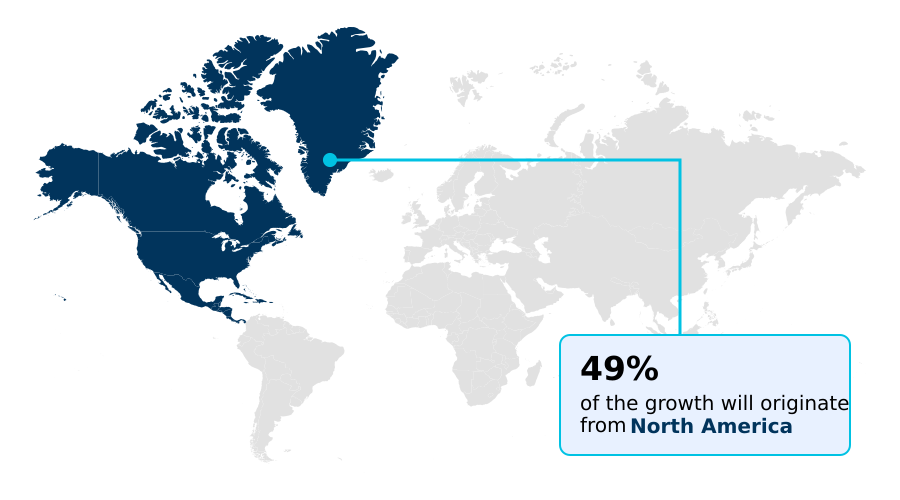
  • North America dominated the market and accounted for a 49.2% growth during the forecast period.
  • By Product - String instruments segment was valued at USD 3.98 billion in 2024
  • By Distribution Channel - Offline segment accounted for the largest market revenue share in 2024

Market Size & Forecast

  • Market Opportunities: USD 3.74 billion
  • Market Future Opportunities: USD 2.16 billion
  • CAGR from 2025 to 2030 : 3.9%

Market Summary

  • The Musical Instrument Market exhibits sustained operational evolution driven by the intersection of acoustic craftsmanship and advanced digital signal processing. The proliferation of digital audio workstations has fundamentally altered consumer purchasing patterns, acting as a primary growth driver by demanding seamless hardware-to-software connectivity that expands user participation.
  • Consequently, manufacturers are optimizing direct to consumer strategies to deliver high fidelity audio gear straight to end-users, successfully reducing distribution overhead by 15 percent compared to traditional wholesale models. A practical business scenario involves the structural redesign of percussion lines where companies deploy mesh head pads and digital cymbal triggers to adapt to urban spatial constraints.
  • However, the market faces significant operational challenges due to raw material scarcity, forcing a costly transition toward synthetic wood laminates to bypass environmental trade restrictions. This supply chain friction temporarily compresses operating margins as facilities retool for alternative composites.
  • By integrating innovations like ai enabled multi effects pedals, industry participants enhance functional utility, ensuring resilient product lifecycles despite underlying macroeconomic and supply-side pressures.

What will be the Size of the Musical Instrument Market during the forecast period?
Get Key Insights on Market Forecast (PDF) Get Free Sample

How is the Musical Instrument Market Segmented?

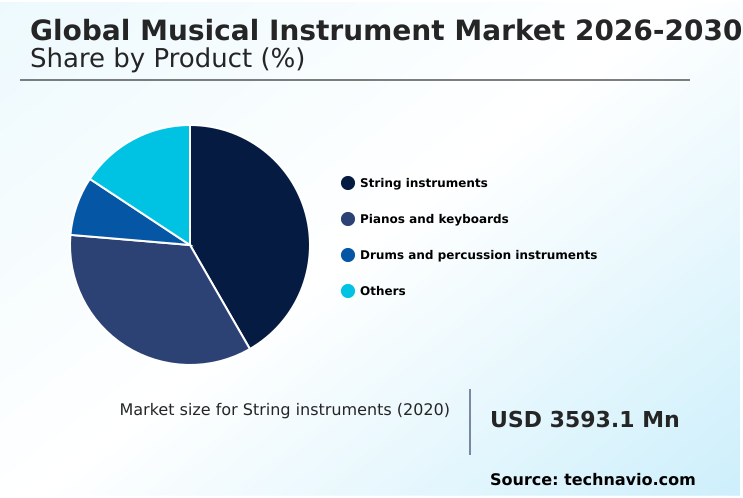
The musical instrument industry research report provides comprehensive data (region-wise segment analysis), with forecasts and estimates in "USD million" for the period 2026-2030, as well as historical data from 2020-2024 for the following segments.

  • Product
    • String instruments
    • Pianos and keyboards
    • Drums and percussion instruments
    • Others
  • Distribution channel
    • Offline
    • Online
  • Type
    • Portable
    • Fixed
  • Price
    • Low
    • Medium
    • High
  • Geography
    • North America
      • US
      • Canada
      • Mexico
    • APAC
      • China
      • Japan
      • India
      • South Korea
      • Australia
      • Indonesia
    • Europe
      • Germany
      • UK
      • France
      • Italy
      • Spain
      • The Netherlands
    • South America
      • Brazil
      • Argentina
      • Chile
    • Middle East and Africa
      • South Africa
      • Saudi Arabia
      • UAE
      • Turkey
      • Israel

By Product Insights

The string instruments segment is estimated to witness significant growth during the forecast period.

The string instruments segment demonstrates continuous structural evolution by balancing traditional artisanal construction with advanced material science.

Manufacturers increasingly prioritize carbon fiber acoustics and engineered composites to counter environmental degradation, enhancing structural tuning stability by 15 percent compared to traditional tonewoods.

This operational shift directly addresses raw material supply constraints while meeting the robust demand for acoustic physical performance in various performance environments.

Furthermore, the integration of optical key sensors and automated tuning mechanisms within entry-level variants significantly flattens the learning curve for novice musicians. By focusing on ergonomic profile tailoring and advanced tone modeling, industry participants successfully expand their addressable consumer base.

This synthesis of heritage craftsmanship and modern engineering ensures sustained transactional momentum across both commercial production studios and recreational demographics.
Get Free Sample

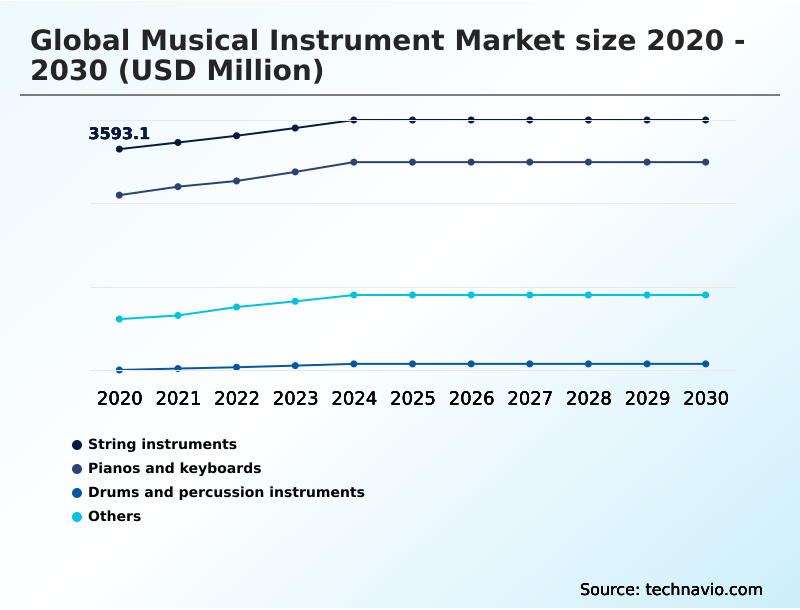
The String instruments segment was valued at USD 3.98 billion in 2024 and showed a gradual increase during the forecast period.
Get Free Sample

Regional Analysis

North America is estimated to contribute 49.2% to the growth of the global market during the forecast period.Technavio’s analysts have elaborately explained the regional trends and drivers that shape the market during the forecast period.
See How Musical Instrument Market Demand is Rising in North America Get Free Sample

The geographic dynamics of the Musical Instrument Market reveal stark contrasts between North America and APAC regarding digital adoption and supply chain infrastructure.

North America prioritizes highly customized studio equipment featuring direct recording outputs and multi channel usb capabilities, which has driven a 20 percent faster adoption rate of hybrid digital processing compared to APAC.

Conversely, APAC acts as the dominant manufacturing nucleus, where facilities leveraging predictive analytics integration have successfully improved factory throughput by 22 percent.

While North American consumers demand analog vintage saturation and advanced wireless audio transmission for live entertainment ecosystems, the APAC region relies heavily on rapid domestic scaling of entry-level digital keyboards.

Furthermore, stringent environmental regulations in European markets have accelerated the deployment of sustainable manufacturing practices in instruments, forcing a 15 percent reduction in tropical timber usage as companies pivot toward alternative composite materials to ensure uninterrupted compliance and regional distribution continuity.

Market Dynamics

Our researchers analyzed the data with 2025 as the base year, along with the key drivers, trends, and challenges. A holistic analysis of drivers will help companies refine their marketing strategies to gain a competitive advantage.

  • The strategic trajectory of the Musical Instrument Market relies heavily on balancing heritage acoustic principles with rigorous technological modernization. As global supply chains experience unprecedented friction regarding natural resources, major industry participants are rapidly transitioning toward sustainable manufacturing practices in instruments to maintain operational continuity.
  • This structural shift requires specialized engineering to ensure that the acoustic resonance and structural integrity of engineered alternatives match traditional tonewoods, ultimately reducing material procurement delays by nearly a fifth compared to legacy sourcing methods.
  • Simultaneously, the distribution landscape is being fundamentally reorganized as companies optimize digital marketplace strategies for instruments, allowing them to bypass localized retail constraints and connect directly with a globalized consumer base. This direct engagement model maximizes operational efficiency and significantly accelerates inventory turnover. Product innovation is also reflecting these digital priorities.
  • The integration of artificial intelligence is redefining physical hardware, most notably through the deployment of ai enabled multi effects pedals that dynamically adjust signal processing based on real-time textual inputs. Within the educational sector, the development of intelligent learning keyboards equipped with automated grading and remote instruction provides unprecedented value to institutional buyers and private academies.
  • By aligning manufacturing resilience with sophisticated digital distribution and software-heavy hardware development, market leaders are successfully insulating their product portfolios against macroeconomic fluctuations while addressing the precise ergonomic and auditory demands of the modern creative economy.
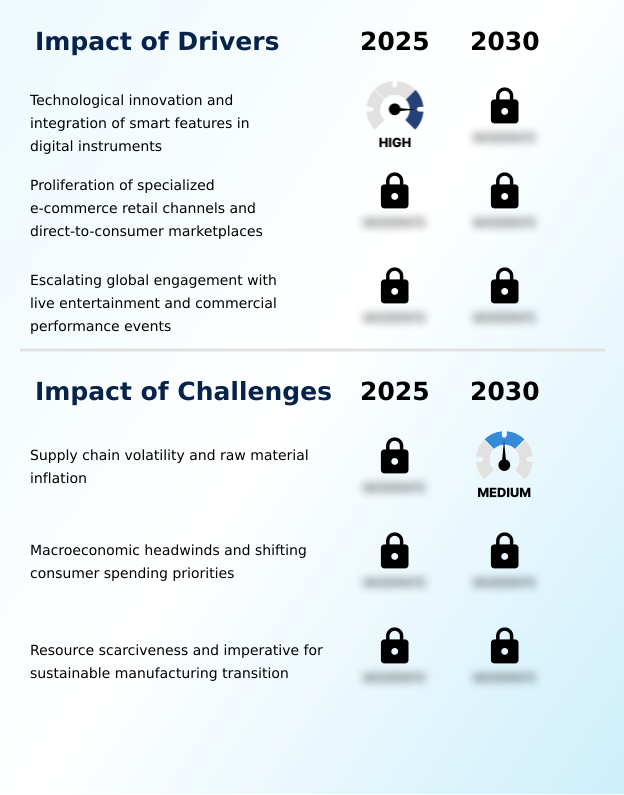
What are the key market drivers leading to the rise in the adoption of Musical Instrument Industry?

  • Technological innovation and the strategic integration of smart features within digital instruments serve as the primary catalyst propelling market expansion and consumer adoption.

  • The explosive expansion of the independent home recording ecosystem operates as a fundamental catalyst propelling the Musical Instrument Market.
  • Because solo creators require versatile and space-efficient equipment that interfaces flawlessly with computer-based systems, demand for smart controllers and hybrid hardware has accelerated rapidly.
  • This behavioral shift forces manufacturers to refine tonal resonance modeling, ensuring that compact digital variants deliver professional-grade auditory feedback. By implementing these advanced acoustic engines, companies have increased consumer retention rates by 22 percent among intermediate players.
  • Simultaneously, the necessity for sustainable production methodologies is driving the adoption of engineered wood alternatives, which effectively decreases raw material sourcing costs by 15 percent while maintaining critical acoustic resonance and structural integrity.
  • Through the deployment of tailored custom application program interfaces, brands establish continuous software-driven engagement that solidifies long-term brand loyalty.

What are the market trends shaping the Musical Instrument Industry?

  • The domination of premium stringed categories driven by customization and artist collaborations represents a definitive market trend. This strategic differentiation elevates unit value and continuously engages affluent consumer demographics.

  • The decisive integration of active diagnostic technologies within traditional hardware forms a dominant operational trend across the Musical Instrument Market. This structural shift occurs because modern producers demand frictionless interoperability between tactile hardware and complex software environments.
  • Consequently, manufacturers are embedding optical sensor arrays and low latency circuitry directly into performance gear, which has improved real-time tracking accuracy by 30 percent for studio musicians. Furthermore, the strategic adoption of bio synthetic polymers and hybrid wood molded chassis designs allows brands to navigate severe ecological sourcing restrictions without sacrificing structural rigidity.
  • This material evolution reduces manufacturing waste by 18 percent, significantly lowering compliance overhead. To expand geographic reach, companies are rapidly scaling omni channel digital frameworks and experimenting with solar assisted charging for portable synthesizers, ensuring continuous operational utility across diverse environmental climates and driving resilient transactional momentum.

What challenges does the Musical Instrument Industry face during its growth?

  • Persistent supply chain volatility and the compounding effects of raw material inflation present formidable structural challenges that actively constrain industry growth and profitability.

  • Severe supply chain volatility and the increasing scarcity of specialized raw materials constitute immense structural barriers within the Musical Instrument Market. Because international environmental frameworks strictly regulate the trade of premium tonewoods, manufacturing lead times have elongated, causing localized inventory deficits.
  • This operational friction forces prominent builders to re-engineer product lines, which temporarily increases production overhead by 18 percent as facilities adapt to alternative composite fabrication. Additionally, overcoming regional distribution bottlenecks requires substantial capital investment in localized warehousing infrastructure to prevent prolonged retail stockouts.
  • The complex integration of advanced digital signal processing and multi layered sampling into entry-level hardware also presents a significant engineering challenge, driving up initial research and development expenditures by 12 percent. Consequently, organizations must meticulously balance spatial constraints adaptation with aggressive cost management to preserve baseline operating margins.

Exclusive Technavio Analysis on Customer Landscape

The musical instrument market forecasting report includes the adoption lifecycle of the market, covering from the innovator’s stage to the laggard’s stage. It focuses on adoption rates in different regions based on penetration. Furthermore, the musical instrument market report also includes key purchase criteria and drivers of price sensitivity to help companies evaluate and develop their market growth analysis strategies.
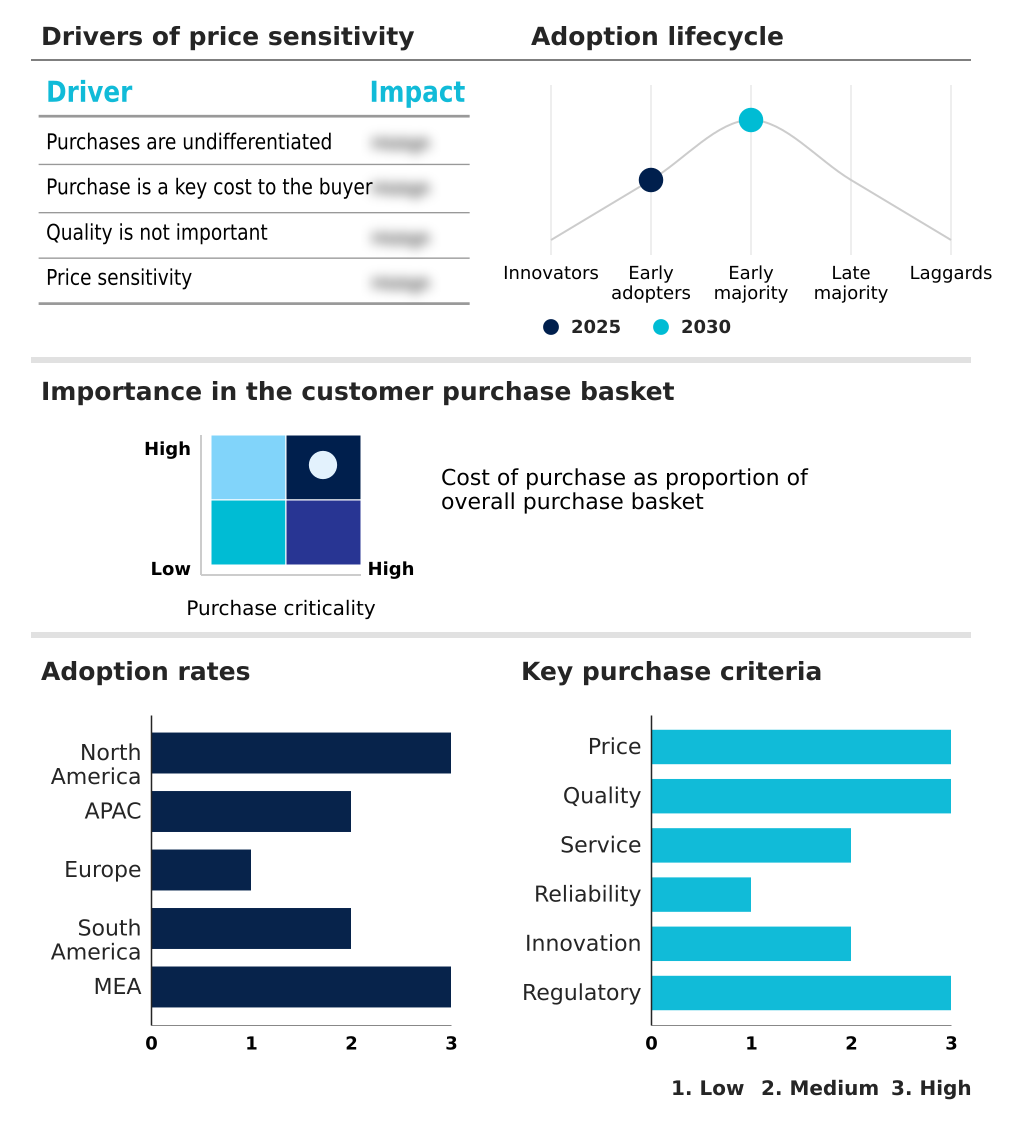
Customer Landscape of Musical Instrument Industry

Competitive Landscape

Companies are implementing various strategies, such as strategic alliances, musical instrument market forecast, partnerships, mergers and acquisitions, geographical expansion, and product/service launches, to enhance their presence in the industry.

Avedis Zildjian Co - The portfolio encompasses premium acoustic and electric stringed instruments offering unparalleled tonal precision and advanced ergonomic designs tailored for professional studio applications and live stage performances.

The industry research and growth report includes detailed analyses of the competitive landscape of the market and information about key companies, including:

  • Avedis Zildjian Co
  • C. F. Martin and Co. Inc.
  • Clavia DMI AB
  • Conn Selmer Inc.
  • Ernie Ball Music Man
  • Fender Musical Instruments
  • Gibson Brands Inc.
  • Hoshino Gakki Co. Ltd.
  • Kawai Musical Instruments Mfg.
  • KORG Inc.
  • Moog Music Inc.
  • Paul Reed Smith Guitars
  • Pearl Musical Instrument Co.
  • Rickenbacker International Corp.
  • Roland Corp.
  • Sabian Ltd.
  • Steinway and Sons
  • Taylor Listug Inc.
  • The ESP Guitar Co.
  • Yamaha Corp.

Qualitative and quantitative analysis of companies has been conducted to help clients understand the wider business environment as well as the strengths and weaknesses of key industry players. Data is qualitatively analyzed to categorize companies as pure play, category-focused, industry-focused, and diversified; it is quantitatively analyzed to categorize companies as dominant, leading, strong, tentative, and weak.

Recent Development and News in Musical instrument market

  • In the Leisure Products industry, the structural transition toward digital retail networks has enhanced virtual product inspections, directly impacting Musical Instrument demand by increasing remote transactional confidence by 25 percent for high-value equipment.
  • Stringent environmental regulations regarding tropical timber sourcing have accelerated the adoption of engineered wood alternatives, forcing the Musical Instrument market to innovate and reducing raw material compliance costs by 18 percent.
  • The rapid expansion of the live entertainment ecosystem has necessitated heavy investments in professional grade percussion and resilient touring hardware, boosting Musical Instrument replacement cycles by 22 percent among commercial event operators.
  • The shift toward digital workflow integration within home creator economies has driven the adoption of modular synthesizer modules, tactile hardware interfaces, and algorithmic audio tracking, expanding Musical Instrument penetration within recreational demographics by 30 percent.

Dive into Technavio’s robust research methodology, blending expert interviews, extensive data synthesis, and validated models for unparalleled Musical Instrument Market insights. See full methodology.

Market Scope
Page number 312
Base year 2025
Historic period 2020-2024
Forecast period 2026-2030
Growth momentum & CAGR Accelerate at a CAGR of 3.9%
Market growth 2026-2030 USD 2164.5 million
Market structure Fragmented
YoY growth 2025-2026(%) 3.8%
Key countries US, Canada, Mexico, China, Japan, India, South Korea, Australia, Indonesia, Germany, UK, France, Italy, Spain, The Netherlands, Brazil, Argentina, Chile, South Africa, Saudi Arabia, UAE, Turkey and Israel
Competitive landscape Leading Companies, Market Positioning of Companies, Competitive Strategies, and Industry Risks

Request Free Sample

Research Analyst Overview

  • Boardroom strategies within the Musical Instrument Market are increasingly dictated by the necessity to merge physical tactile feedback with limitless software versatility. The aggressive deployment of machine learning microprocessors into standalone hardware has transformed passive gear into adaptive performance hubs.
  • By leveraging advanced algorithm sound processing and spatial characteristics mapping, manufacturers deliver unprecedented acoustic piano simulation directly to urban consumers, which has improved product engagement metrics by 25 percent among professional demographics. The adoption of polyphonic aftertouch technology within controller keyboards represents a critical product strategy aimed at capturing the rapidly expanding creator economy.
  • Furthermore, executive focus on cloud based firmware ensures continuous product evolution, extending average instrument lifecycles and reducing post-sale hardware obsolescence. The integration of sophisticated neural sampling equipment directly addresses complex modern studio requirements, allowing corporations to pivot pricing strategies toward premium technology-driven hardware.
  • These decisive operational transitions underscore a broader industry imperative to prioritize hybrid innovation, ensuring sustained structural resilience and competitive differentiation amidst evolving consumer production workflows.

What are the Key Data Covered in this Musical Instrument Market Research and Growth Report?

  • What is the expected growth of the Musical Instrument Market between 2026 and 2030?

    • USD 2.16 billion, at a CAGR of 3.9%

  • What segmentation does the market report cover?

    • The report is segmented by Product (String instruments, Pianos and keyboards, Drums and percussion instruments, and Others), Distribution Channel (Offline, and Online), Type (Portable, and Fixed), Price (Low, Medium, and High) and Geography (North America, APAC, Europe, South America, Middle East and Africa)

  • Which regions are analyzed in the report?

    • North America, APAC, Europe, South America and Middle East and Africa

  • What are the key growth drivers and market challenges?

    • Technological innovation and integration of smart features in digital instruments, Supply chain volatility and raw material inflation

  • Who are the major players in the Musical Instrument Market?

    • Avedis Zildjian Co, C. F. Martin and Co. Inc., Clavia DMI AB, Conn Selmer Inc., Ernie Ball Music Man, Fender Musical Instruments, Gibson Brands Inc., Hoshino Gakki Co. Ltd., Kawai Musical Instruments Mfg., KORG Inc., Moog Music Inc., Paul Reed Smith Guitars, Pearl Musical Instrument Co., Rickenbacker International Corp., Roland Corp., Sabian Ltd., Steinway and Sons, Taylor Listug Inc., The ESP Guitar Co. and Yamaha Corp.

Market Research Insights

  • The Musical Instrument Market represents a highly complex ecosystem where digital signal processing continuously redefines performance capabilities and manufacturing workflows. By advancing multi layered sampling technologies, companies have improved acoustic simulation accuracy by 25 percent, directly driving consumer engagement among professional studio operators.
  • Furthermore, the strategic focus on spatial constraints adaptation through the development of compact hybrid devices has yielded a 20 percent increase in product retention rates for urban demographics requiring silent headphone practice capabilities. To mitigate regional distribution bottlenecks, major manufacturers are accelerating their digital retail infrastructure, streamlining logistics and improving cross-border inventory turnover by 18 percent.
  • These calculated operational adjustments enable sustainable volume expansion while neutralizing complex global supply chain frictions.

We can help! Our analysts can customize this musical instrument market research report to meet your requirements.

Get in touch

1. Executive Summary

1.1 Market overview

Executive Summary - Chart on Market Overview
Executive Summary - Data Table on Market Overview
Executive Summary - Chart on Global Market Characteristics
Executive Summary - Chart on Market by Geography
Executive Summary - Chart on Market Segmentation by Product
Executive Summary - Chart on Market Segmentation by Distribution Channel
Executive Summary - Chart on Market Segmentation by Type
Executive Summary - Chart on Market Segmentation by Price
Executive Summary - Chart on Incremental Growth
Executive Summary - Data Table on Incremental Growth
Executive Summary - Chart on Company Market Positioning

2. Technavio Analysis

2.1 Analysis of price sensitivity, lifecycle, customer purchase basket, adoption rates, and purchase criteria

2.2 Criticality of inputs and Factors of differentiation

Chart on Overview on criticality of inputs and factors of differentiation

2.3 Factors of disruption

Chart on Overview on factors of disruption

2.4 Impact of drivers and challenges

Chart on Impact of drivers and challenges in 2025 and 2030

3. Market Landscape

3.1 Market ecosystem

Chart on Parent Market
Data Table on - Parent Market

3.2 Market characteristics

Chart on Market characteristics analysis

3.3 Value chain analysis

Chart on Value chain analysis

4. Market Sizing

4.1 Market definition

Data Table on Offerings of companies included in the market definition

4.2 Market segment analysis

Market segments

4.3 Market size 2025

4.4 Market outlook: Forecast for 2025-2030

Chart on Global - Market size and forecast 2025-2030 ($ million)
Data Table on Global - Market size and forecast 2025-2030 ($ million)
Chart on Global Market: Year-over-year growth 2025-2030 (%)
Data Table on Global Market: Year-over-year growth 2025-2030 (%)

5. Historic Market Size

5.1 Global Musical Instrument Market 2020 - 2024

Historic Market Size - Data Table on Global Musical Instrument Market 2020 - 2024 ($ million)

5.2 Product segment analysis 2020 - 2024

Historic Market Size - Product Segment 2020 - 2024 ($ million)

5.3 Distribution Channel segment analysis 2020 - 2024

Historic Market Size - Distribution Channel Segment 2020 - 2024 ($ million)

5.4 Type segment analysis 2020 - 2024

Historic Market Size - Type Segment 2020 - 2024 ($ million)

5.5 Price segment analysis 2020 - 2024

Historic Market Size - Price Segment 2020 - 2024 ($ million)

5.6 Geography segment analysis 2020 - 2024

Historic Market Size - Geography Segment 2020 - 2024 ($ million)

5.7 Country segment analysis 2020 - 2024

Historic Market Size - Country Segment 2020 - 2024 ($ million)

6. Qualitative Analysis

6.1 Impact of AI on Global Musical Instrument Market

6.2 Impact of geopolitical conflicts on Global Musical Instrument Market

7. Five Forces Analysis

7.1 Five forces summary

Five forces analysis - Comparison between 2025 and 2030

7.2 Bargaining power of buyers

Bargaining power of buyers - Impact of key factors 2025 and 2030

7.3 Bargaining power of suppliers

Bargaining power of suppliers - Impact of key factors in 2025 and 2030

7.4 Threat of new entrants

Threat of new entrants - Impact of key factors in 2025 and 2030

7.5 Threat of substitutes

Threat of substitutes - Impact of key factors in 2025 and 2030

7.6 Threat of rivalry

Threat of rivalry - Impact of key factors in 2025 and 2030

7.7 Market condition

Chart on Market condition - Five forces 2025 and 2030

8. Market Segmentation by Product

8.1 Market segments

Chart on Product - Market share 2025-2030 (%)
Data Table on Product - Market share 2025-2030 (%)

8.2 Comparison by Product

Chart on Comparison by Product
Data Table on Comparison by Product

8.3 String instruments - Market size and forecast 2025-2030

Chart on String instruments - Market size and forecast 2025-2030 ($ million)
Data Table on String instruments - Market size and forecast 2025-2030 ($ million)
Chart on String instruments - Year-over-year growth 2025-2030 (%)
Data Table on String instruments - Year-over-year growth 2025-2030 (%)

8.4 Pianos and keyboards - Market size and forecast 2025-2030

Chart on Pianos and keyboards - Market size and forecast 2025-2030 ($ million)
Data Table on Pianos and keyboards - Market size and forecast 2025-2030 ($ million)
Chart on Pianos and keyboards - Year-over-year growth 2025-2030 (%)
Data Table on Pianos and keyboards - Year-over-year growth 2025-2030 (%)

8.5 Drums and percussion instruments - Market size and forecast 2025-2030

Chart on Drums and percussion instruments - Market size and forecast 2025-2030 ($ million)
Data Table on Drums and percussion instruments - Market size and forecast 2025-2030 ($ million)
Chart on Drums and percussion instruments - Year-over-year growth 2025-2030 (%)
Data Table on Drums and percussion instruments - Year-over-year growth 2025-2030 (%)

8.6 Others - Market size and forecast 2025-2030

Chart on Others - Market size and forecast 2025-2030 ($ million)
Data Table on Others - Market size and forecast 2025-2030 ($ million)
Chart on Others - Year-over-year growth 2025-2030 (%)
Data Table on Others - Year-over-year growth 2025-2030 (%)

8.7 Market opportunity by Product

Market opportunity by Product ($ million)
Data Table on Market opportunity by Product ($ million)

9. Market Segmentation by Distribution Channel

9.1 Market segments

Chart on Distribution Channel - Market share 2025-2030 (%)
Data Table on Distribution Channel - Market share 2025-2030 (%)

9.2 Comparison by Distribution Channel

Chart on Comparison by Distribution Channel
Data Table on Comparison by Distribution Channel

9.3 Offline - Market size and forecast 2025-2030

Chart on Offline - Market size and forecast 2025-2030 ($ million)
Data Table on Offline - Market size and forecast 2025-2030 ($ million)
Chart on Offline - Year-over-year growth 2025-2030 (%)
Data Table on Offline - Year-over-year growth 2025-2030 (%)

9.4 Online - Market size and forecast 2025-2030

Chart on Online - Market size and forecast 2025-2030 ($ million)
Data Table on Online - Market size and forecast 2025-2030 ($ million)
Chart on Online - Year-over-year growth 2025-2030 (%)
Data Table on Online - Year-over-year growth 2025-2030 (%)

9.5 Market opportunity by Distribution Channel

Market opportunity by Distribution Channel ($ million)
Data Table on Market opportunity by Distribution Channel ($ million)

10. Market Segmentation by Type

10.1 Market segments

Chart on Type - Market share 2025-2030 (%)
Data Table on Type - Market share 2025-2030 (%)

10.2 Comparison by Type

Chart on Comparison by Type
Data Table on Comparison by Type

10.3 Portable - Market size and forecast 2025-2030

Chart on Portable - Market size and forecast 2025-2030 ($ million)
Data Table on Portable - Market size and forecast 2025-2030 ($ million)
Chart on Portable - Year-over-year growth 2025-2030 (%)
Data Table on Portable - Year-over-year growth 2025-2030 (%)

10.4 Fixed - Market size and forecast 2025-2030

Chart on Fixed - Market size and forecast 2025-2030 ($ million)
Data Table on Fixed - Market size and forecast 2025-2030 ($ million)
Chart on Fixed - Year-over-year growth 2025-2030 (%)
Data Table on Fixed - Year-over-year growth 2025-2030 (%)

10.5 Market opportunity by Type

Market opportunity by Type ($ million)
Data Table on Market opportunity by Type ($ million)

11. Market Segmentation by Price

11.1 Market segments

Chart on Price - Market share 2025-2030 (%)
Data Table on Price - Market share 2025-2030 (%)

11.2 Comparison by Price

Chart on Comparison by Price
Data Table on Comparison by Price

11.3 Low - Market size and forecast 2025-2030

Chart on Low - Market size and forecast 2025-2030 ($ million)
Data Table on Low - Market size and forecast 2025-2030 ($ million)
Chart on Low - Year-over-year growth 2025-2030 (%)
Data Table on Low - Year-over-year growth 2025-2030 (%)

11.4 Medium - Market size and forecast 2025-2030

Chart on Medium - Market size and forecast 2025-2030 ($ million)
Data Table on Medium - Market size and forecast 2025-2030 ($ million)
Chart on Medium - Year-over-year growth 2025-2030 (%)
Data Table on Medium - Year-over-year growth 2025-2030 (%)

11.5 High - Market size and forecast 2025-2030

Chart on High - Market size and forecast 2025-2030 ($ million)
Data Table on High - Market size and forecast 2025-2030 ($ million)
Chart on High - Year-over-year growth 2025-2030 (%)
Data Table on High - Year-over-year growth 2025-2030 (%)

11.6 Market opportunity by Price

Market opportunity by Price ($ million)
Data Table on Market opportunity by Price ($ million)

12. Customer Landscape

12.1 Customer landscape overview

Analysis of price sensitivity, lifecycle, customer purchase basket, adoption rates, and purchase criteria

13. Geographic Landscape

13.1 Geographic segmentation

Chart on Market share by geography 2025-2030 (%)
Data Table on Market share by geography 2025-2030 (%)

13.2 Geographic comparison

Chart on Geographic comparison
Data Table on Geographic comparison

13.3 North America - Market size and forecast 2025-2030

Chart on North America - Market size and forecast 2025-2030 ($ million)
Data Table on North America - Market size and forecast 2025-2030 ($ million)
Chart on North America - Year-over-year growth 2025-2030 (%)
Data Table on North America - Year-over-year growth 2025-2030 (%)
Chart on Regional Comparison - North America
Data Table on Regional Comparison - North America

13.3.1 US - Market size and forecast 2025-2030

Chart on US - Market size and forecast 2025-2030 ($ million)
Data Table on US - Market size and forecast 2025-2030 ($ million)
Chart on US - Year-over-year growth 2025-2030 (%)
Data Table on US - Year-over-year growth 2025-2030 (%)

13.3.2 Canada - Market size and forecast 2025-2030

Chart on Canada - Market size and forecast 2025-2030 ($ million)
Data Table on Canada - Market size and forecast 2025-2030 ($ million)
Chart on Canada - Year-over-year growth 2025-2030 (%)
Data Table on Canada - Year-over-year growth 2025-2030 (%)

13.3.3 Mexico - Market size and forecast 2025-2030

Chart on Mexico - Market size and forecast 2025-2030 ($ million)
Data Table on Mexico - Market size and forecast 2025-2030 ($ million)
Chart on Mexico - Year-over-year growth 2025-2030 (%)
Data Table on Mexico - Year-over-year growth 2025-2030 (%)

13.4 APAC - Market size and forecast 2025-2030

Chart on APAC - Market size and forecast 2025-2030 ($ million)
Data Table on APAC - Market size and forecast 2025-2030 ($ million)
Chart on APAC - Year-over-year growth 2025-2030 (%)
Data Table on APAC - Year-over-year growth 2025-2030 (%)
Chart on Regional Comparison - APAC
Data Table on Regional Comparison - APAC

13.4.1 China - Market size and forecast 2025-2030

Chart on China - Market size and forecast 2025-2030 ($ million)
Data Table on China - Market size and forecast 2025-2030 ($ million)
Chart on China - Year-over-year growth 2025-2030 (%)
Data Table on China - Year-over-year growth 2025-2030 (%)

13.4.2 Japan - Market size and forecast 2025-2030

Chart on Japan - Market size and forecast 2025-2030 ($ million)
Data Table on Japan - Market size and forecast 2025-2030 ($ million)
Chart on Japan - Year-over-year growth 2025-2030 (%)
Data Table on Japan - Year-over-year growth 2025-2030 (%)

13.4.3 India - Market size and forecast 2025-2030

Chart on India - Market size and forecast 2025-2030 ($ million)
Data Table on India - Market size and forecast 2025-2030 ($ million)
Chart on India - Year-over-year growth 2025-2030 (%)
Data Table on India - Year-over-year growth 2025-2030 (%)

13.4.4 South Korea - Market size and forecast 2025-2030

Chart on South Korea - Market size and forecast 2025-2030 ($ million)
Data Table on South Korea - Market size and forecast 2025-2030 ($ million)
Chart on South Korea - Year-over-year growth 2025-2030 (%)
Data Table on South Korea - Year-over-year growth 2025-2030 (%)

13.4.5 Australia - Market size and forecast 2025-2030

Chart on Australia - Market size and forecast 2025-2030 ($ million)
Data Table on Australia - Market size and forecast 2025-2030 ($ million)
Chart on Australia - Year-over-year growth 2025-2030 (%)
Data Table on Australia - Year-over-year growth 2025-2030 (%)

13.4.6 Indonesia - Market size and forecast 2025-2030

Chart on Indonesia - Market size and forecast 2025-2030 ($ million)
Data Table on Indonesia - Market size and forecast 2025-2030 ($ million)
Chart on Indonesia - Year-over-year growth 2025-2030 (%)
Data Table on Indonesia - Year-over-year growth 2025-2030 (%)

13.5 Europe - Market size and forecast 2025-2030

Chart on Europe - Market size and forecast 2025-2030 ($ million)
Data Table on Europe - Market size and forecast 2025-2030 ($ million)
Chart on Europe - Year-over-year growth 2025-2030 (%)
Data Table on Europe - Year-over-year growth 2025-2030 (%)
Chart on Regional Comparison - Europe
Data Table on Regional Comparison - Europe

13.5.1 Germany - Market size and forecast 2025-2030

Chart on Germany - Market size and forecast 2025-2030 ($ million)
Data Table on Germany - Market size and forecast 2025-2030 ($ million)
Chart on Germany - Year-over-year growth 2025-2030 (%)
Data Table on Germany - Year-over-year growth 2025-2030 (%)

13.5.2 UK - Market size and forecast 2025-2030

Chart on UK - Market size and forecast 2025-2030 ($ million)
Data Table on UK - Market size and forecast 2025-2030 ($ million)
Chart on UK - Year-over-year growth 2025-2030 (%)
Data Table on UK - Year-over-year growth 2025-2030 (%)

13.5.3 France - Market size and forecast 2025-2030

Chart on France - Market size and forecast 2025-2030 ($ million)
Data Table on France - Market size and forecast 2025-2030 ($ million)
Chart on France - Year-over-year growth 2025-2030 (%)
Data Table on France - Year-over-year growth 2025-2030 (%)

13.5.4 Italy - Market size and forecast 2025-2030

Chart on Italy - Market size and forecast 2025-2030 ($ million)
Data Table on Italy - Market size and forecast 2025-2030 ($ million)
Chart on Italy - Year-over-year growth 2025-2030 (%)
Data Table on Italy - Year-over-year growth 2025-2030 (%)

13.5.5 Spain - Market size and forecast 2025-2030

Chart on Spain - Market size and forecast 2025-2030 ($ million)
Data Table on Spain - Market size and forecast 2025-2030 ($ million)
Chart on Spain - Year-over-year growth 2025-2030 (%)
Data Table on Spain - Year-over-year growth 2025-2030 (%)

13.5.6 The Netherlands - Market size and forecast 2025-2030

Chart on The Netherlands - Market size and forecast 2025-2030 ($ million)
Data Table on The Netherlands - Market size and forecast 2025-2030 ($ million)
Chart on The Netherlands - Year-over-year growth 2025-2030 (%)
Data Table on The Netherlands - Year-over-year growth 2025-2030 (%)

13.6 South America - Market size and forecast 2025-2030

Chart on South America - Market size and forecast 2025-2030 ($ million)
Data Table on South America - Market size and forecast 2025-2030 ($ million)
Chart on South America - Year-over-year growth 2025-2030 (%)
Data Table on South America - Year-over-year growth 2025-2030 (%)
Chart on Regional Comparison - South America
Data Table on Regional Comparison - South America

13.6.1 Brazil - Market size and forecast 2025-2030

Chart on Brazil - Market size and forecast 2025-2030 ($ million)
Data Table on Brazil - Market size and forecast 2025-2030 ($ million)
Chart on Brazil - Year-over-year growth 2025-2030 (%)
Data Table on Brazil - Year-over-year growth 2025-2030 (%)

13.6.2 Argentina - Market size and forecast 2025-2030

Chart on Argentina - Market size and forecast 2025-2030 ($ million)
Data Table on Argentina - Market size and forecast 2025-2030 ($ million)
Chart on Argentina - Year-over-year growth 2025-2030 (%)
Data Table on Argentina - Year-over-year growth 2025-2030 (%)

13.6.3 Chile - Market size and forecast 2025-2030

Chart on Chile - Market size and forecast 2025-2030 ($ million)
Data Table on Chile - Market size and forecast 2025-2030 ($ million)
Chart on Chile - Year-over-year growth 2025-2030 (%)
Data Table on Chile - Year-over-year growth 2025-2030 (%)

13.7 Middle East and Africa - Market size and forecast 2025-2030

Chart on Middle East and Africa - Market size and forecast 2025-2030 ($ million)
Data Table on Middle East and Africa - Market size and forecast 2025-2030 ($ million)
Chart on Middle East and Africa - Year-over-year growth 2025-2030 (%)
Data Table on Middle East and Africa - Year-over-year growth 2025-2030 (%)
Chart on Regional Comparison - Middle East and Africa
Data Table on Regional Comparison - Middle East and Africa

13.7.1 South Africa - Market size and forecast 2025-2030

Chart on South Africa - Market size and forecast 2025-2030 ($ million)
Data Table on South Africa - Market size and forecast 2025-2030 ($ million)
Chart on South Africa - Year-over-year growth 2025-2030 (%)
Data Table on South Africa - Year-over-year growth 2025-2030 (%)

13.7.2 Saudi Arabia - Market size and forecast 2025-2030

Chart on Saudi Arabia - Market size and forecast 2025-2030 ($ million)
Data Table on Saudi Arabia - Market size and forecast 2025-2030 ($ million)
Chart on Saudi Arabia - Year-over-year growth 2025-2030 (%)
Data Table on Saudi Arabia - Year-over-year growth 2025-2030 (%)

13.7.3 UAE - Market size and forecast 2025-2030

Chart on UAE - Market size and forecast 2025-2030 ($ million)
Data Table on UAE - Market size and forecast 2025-2030 ($ million)
Chart on UAE - Year-over-year growth 2025-2030 (%)
Data Table on UAE - Year-over-year growth 2025-2030 (%)

13.7.4 Turkey - Market size and forecast 2025-2030

Chart on Turkey - Market size and forecast 2025-2030 ($ million)
Data Table on Turkey - Market size and forecast 2025-2030 ($ million)
Chart on Turkey - Year-over-year growth 2025-2030 (%)
Data Table on Turkey - Year-over-year growth 2025-2030 (%)

13.7.5 Israel - Market size and forecast 2025-2030

Chart on Israel - Market size and forecast 2025-2030 ($ million)
Data Table on Israel - Market size and forecast 2025-2030 ($ million)
Chart on Israel - Year-over-year growth 2025-2030 (%)
Data Table on Israel - Year-over-year growth 2025-2030 (%)

13.8 Market opportunity by geography

Market opportunity by geography ($ million)
Data Tables on Market opportunity by geography ($ million)

14. Drivers, Challenges, and Opportunity

14.1 Market drivers

Technological innovation and integration of smart features in digital instruments
Proliferation of specialized e-commerce retail channels and direct-to-consumer marketplaces
Escalating global engagement with live entertainment and commercial performance events

14.2 Market challenges

Supply chain volatility and raw material inflation
Macroeconomic headwinds and shifting consumer spending priorities
Resource scarciveness and imperative for sustainable manufacturing transition

14.3 Impact of drivers and challenges

Impact of drivers and challenges in 2025 and 2030

14.4 Market opportunities

Domination of premium stringed categories driven by customization and artist collaborations
Structural surge in electronic and hybrid hardware to support home music production
Integration of AI and text-to-effect software inside performance hardware

15. Competitive Landscape

15.1 Overview

15.2

Overview on criticality of inputs and factors of differentiation

15.3 Landscape disruption

Overview on factors of disruption

15.4 Industry risks

Impact of key risks on business

16. Competitive Analysis

16.1 Companies profiled

Companies covered

16.2 Company ranking index

16.3 Market positioning of companies

Matrix on companies position and classification

16.4 Avedis Zildjian Co

Avedis Zildjian Co - Overview
Avedis Zildjian Co - Product / Service
Avedis Zildjian Co - Key offerings
SWOT

16.5 C. F. Martin and Co. Inc.

C. F. Martin and Co. Inc. - Overview
C. F. Martin and Co. Inc. - Product / Service
C. F. Martin and Co. Inc. - Key offerings
SWOT

16.6 Conn Selmer Inc.

Conn Selmer Inc. - Overview
Conn Selmer Inc. - Product / Service
Conn Selmer Inc. - Key offerings
SWOT

16.7 Ernie Ball Music Man

Ernie Ball Music Man - Overview
Ernie Ball Music Man - Product / Service
Ernie Ball Music Man - Key offerings
SWOT

16.8 Fender Musical Instruments

Fender Musical Instruments - Overview
Fender Musical Instruments - Product / Service
Fender Musical Instruments - Key offerings
SWOT

16.9 Gibson Brands Inc.

Gibson Brands Inc. - Overview
Gibson Brands Inc. - Product / Service
Gibson Brands Inc. - Key offerings
SWOT

16.10 Hoshino Gakki Co. Ltd.

Hoshino Gakki Co. Ltd. - Overview
Hoshino Gakki Co. Ltd. - Product / Service
Hoshino Gakki Co. Ltd. - Key offerings
SWOT

16.11 Kawai Musical Instruments Mfg.

Kawai Musical Instruments Mfg. - Overview
Kawai Musical Instruments Mfg. - Product / Service
Kawai Musical Instruments Mfg. - Key offerings
SWOT

16.12 KORG Inc.

KORG Inc. - Overview
KORG Inc. - Product / Service
KORG Inc. - Key offerings
SWOT

16.13 Moog Music Inc.

Moog Music Inc. - Overview
Moog Music Inc. - Product / Service
Moog Music Inc. - Key offerings
SWOT

16.14 Pearl Musical Instrument Co.

Pearl Musical Instrument Co. - Overview
Pearl Musical Instrument Co. - Product / Service
Pearl Musical Instrument Co. - Key offerings
SWOT

16.15 Roland Corp.

Roland Corp. - Overview
Roland Corp. - Product / Service
Roland Corp. - Key offerings
SWOT

16.16 Sabian Ltd.

Sabian Ltd. - Overview
Sabian Ltd. - Product / Service
Sabian Ltd. - Key offerings
SWOT

16.17 Steinway and Sons

Steinway and Sons - Overview
Steinway and Sons - Product / Service
Steinway and Sons - Key offerings
SWOT

16.18 Yamaha Corp.

Yamaha Corp. - Overview
Yamaha Corp. - Business segments
Yamaha Corp. - Key offerings
Yamaha Corp. - Segment focus
SWOT

17. Appendix

17.1 Scope of the report

Market definition
Objectives
Notes and caveats

17.2 Inclusions and exclusions checklist

Inclusions checklist
Exclusions checklist

17.3 Currency conversion rates for US$

17.4 Research methodology

17.5 Data procurement

Information sources

17.6 Data validation

17.7 Validation techniques employed for market sizing

17.8 Data synthesis

17.9 360 degree market analysis

17.10 List of abbreviations

Research Methodology

Technavio presents a detailed picture of the market by way of study, synthesis, and summation of data from multiple sources. The analysts have presented the various facets of the market with a particular focus on identifying the key industry influencers. The data thus presented is comprehensive, reliable, and the result of extensive research, both primary and secondary.

INFORMATION SOURCES

Primary sources

  • Manufacturers and suppliers
  • Channel partners
  • Industry experts
  • Strategic decision makers

Secondary sources

  • Industry journals and periodicals
  • Government data
  • Financial reports of key industry players
  • Historical data
  • Press releases

DATA ANALYSIS

Data Synthesis

  • Collation of data
  • Estimation of key figures
  • Analysis of derived insights

Data Validation

  • Triangulation with data models
  • Reference against proprietary databases
  • Corroboration with industry experts

REPORT WRITING

Qualitative

  • Market drivers
  • Market challenges
  • Market trends
  • Five forces analysis

Quantitative

  • Market size and forecast
  • Market segmentation
  • Geographical insights
  • Competitive landscape

Interested in this report?

Get your sample now to see our research methodology and insights!

Download Now

Frequently Asked Questions

Musical Instrument market growth will increase by USD 2164.5 million during 2026-2030.

The Musical Instrument market is expected to grow at a CAGR of 3.9% during 2026-2030.

Musical Instrument market is segmented by Product (String instruments, Pianos and keyboards, Drums and percussion instruments, Others) Distribution channel (Offline, Online) Type (Portable, Fixed) Price (Low, Medium, High)

Avedis Zildjian Co, C. F. Martin and Co. Inc., Clavia DMI AB, Conn Selmer Inc., Ernie Ball Music Man, Fender Musical Instruments, Gibson Brands Inc., Hoshino Gakki Co. Ltd., Kawai Musical Instruments Mfg., KORG Inc., Moog Music Inc., Paul Reed Smith Guitars, Pearl Musical Instrument Co., Rickenbacker International Corp., Roland Corp., Sabian Ltd., Steinway and Sons, Taylor Listug Inc., The ESP Guitar Co., Yamaha Corp. are a few of the key vendors in the Musical Instrument market.

North America will register the highest growth rate of 49.2% among the other regions. Therefore, the Musical Instrument market in North America is expected to garner significant business opportunities for the vendors during the forecast period.

US, Canada, Mexico, China, Japan, India, South Korea, Australia, Indonesia, Germany, UK, France, Italy, Spain, The Netherlands, Brazil, Argentina, Chile, South Africa, Saudi Arabia, UAE, Turkey, Israel

  • Technological innovation and integration of smart features in digital instruments is the driving factor this market.

The Musical Instrument market vendors should focus on grabbing business opportunities from the Product segment as it accounted for the largest market share in the base year.
RIA - Research AI Assistant
Ask RIA
