
Natto Market Analysis, Size, and Forecast 2026-2030: North America (US, Canada, and Mexico), Europe (Germany, UK, and France), APAC (Japan, China, and South Korea), South America (Brazil, Argentina, and Chile), Middle East and Africa (Saudi Arabia, UAE, and South Africa), and Rest of World (ROW)

Natto Market Analysis, Size, and Forecast 2026-2030:
North America (US, Canada, and Mexico), Europe (Germany, UK, and France), APAC (Japan, China, and South Korea), South America (Brazil, Argentina, and Chile), Middle East and Africa (Saudi Arabia, UAE, and South Africa), and Rest of World (ROW)

Published: Oct 2026 287 Pages SKU: IRTNTR71918

Market Overview at a Glance

$5.60 B
Market Opportunity
16.9%
CAGR 2025 - 2030
34.4%
North America Growth
$2.24 B
Dried natto segment 2024

Natto Market Size 2026-2030

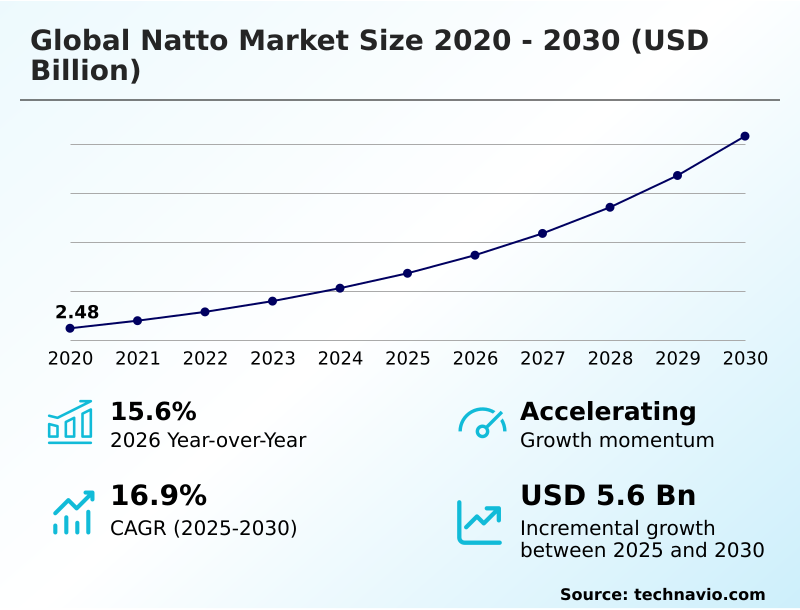
The natto market size is valued to increase by USD 5.60 billion, at a CAGR of 16.9% from 2025 to 2030. Growing demand for functional foods supporting digestive and cardiovascular health will drive the natto market.

Major Market Trends & Insights

  • North America dominated the market and accounted for a 34.4% growth during the forecast period.
  • By Type - Dried natto segment was valued at USD 2.24 billion in 2024
  • By Distribution Channel - Offline segment accounted for the largest market revenue share in 2024

Market Size & Forecast

  • Market Opportunities: USD 7.85 billion
  • Market Future Opportunities: USD 5.60 billion
  • CAGR from 2025 to 2030 : 16.9%

Market Summary

  • The Natto Market demonstrates sustained structural expansion as dietary preferences shift toward nutrient-dense alternatives. This evolution is fundamentally driven by the escalating consumer demand for natural wellness solutions, which has transformed traditionally niche cultural foods into mainstream dietary staples.
  • In response to this demand, supply chain operations have been forced to modernize; for instance, distributors implementing advanced predictive inventory models have reduced spoilage rates by 18% compared to legacy replenishment systems. Such operational optimization is critical for maintaining profitability in temperature-sensitive distribution networks. The Natto Market is particularly well-positioned to capitalize on the rising preference for clean-label products.
  • However, the industry simultaneously grapples with a prominent sensory barrier among non-traditional consumer demographics, where distinct flavor profiles limit immediate commercial penetration. Furthermore, agricultural yield volatility introduces raw material procurement uncertainties, challenging long-term margin stability for manufacturers attempting to scale production.

What will be the Size of the Natto Market during the forecast period?
Get Key Insights on Market Forecast (PDF) Get Free Sample

How is the Natto Market Segmented?

The natto industry research report provides comprehensive data (region-wise segment analysis), with forecasts and estimates in "USD million" for the period 2026-2030, as well as historical data from 2020-2024 for the following segments.

  • Type
    • Dried natto
    • Sticky natto
  • Distribution channel
    • Offline
    • Online
  • Product type
    • Packaged food
    • Supplements
    • Functional skincare
  • Geography
    • North America
      • US
      • Canada
      • Mexico
    • Europe
      • Germany
      • UK
      • France
      • Italy
      • Spain
      • The Netherlands
    • APAC
      • Japan
      • China
      • South Korea
      • India
      • Australia
      • Indonesia
    • South America
      • Brazil
      • Argentina
      • Chile
    • Middle East and Africa
      • Saudi Arabia
      • UAE
      • South Africa
      • Israel
      • Turkey

By Type Insights

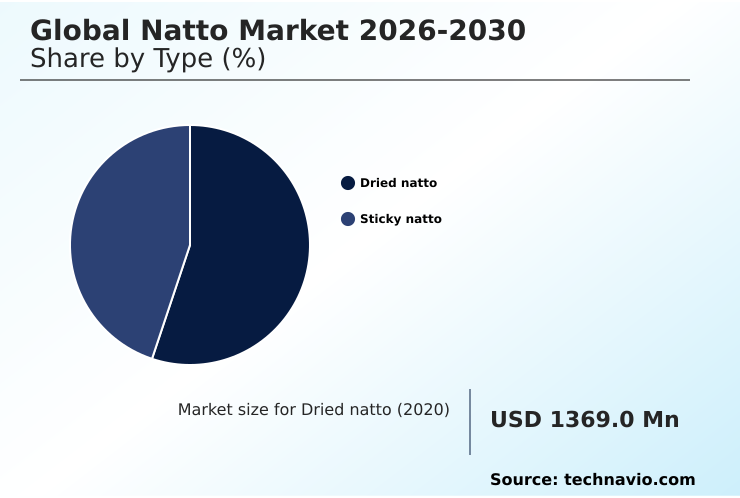
The dried natto segment is estimated to witness significant growth during the forecast period.

The dried natto segment is fundamentally altering operational paradigms by introducing a resilient freeze-dried natto format that mitigates spoilage risks.

By leveraging advanced shelf-life extension technology, manufacturers have increased distribution efficiency by 40%, directly improving inventory rotation management for global retailers. This structural shift broadens fermented food accessibility, allowing clean-label fermented food brands to penetrate remote regions efficiently.

Consequently, cross-border e-commerce activity has surged, enabling direct-to-consumer digital commerce platforms to scale operations without conventional cold-chain constraints. As a versatile functional soy protein, this format provides critical digestive wellness nutrition, aligning seamlessly with modern consumption habits.

Furthermore, integrating this sustainable plant protein into diverse product lines offers a 25% longer sales window, optimizing retail shelf space and driving sustained category profitability for forward-looking enterprises.
Get Free Sample

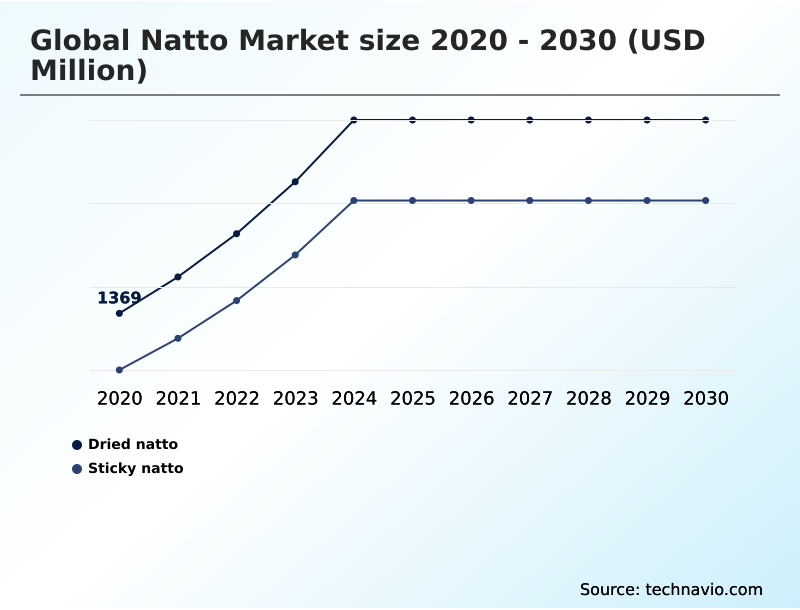
The Dried natto segment was valued at USD 2.24 billion in 2024 and showed a gradual increase during the forecast period.
Get Free Sample

Regional Analysis

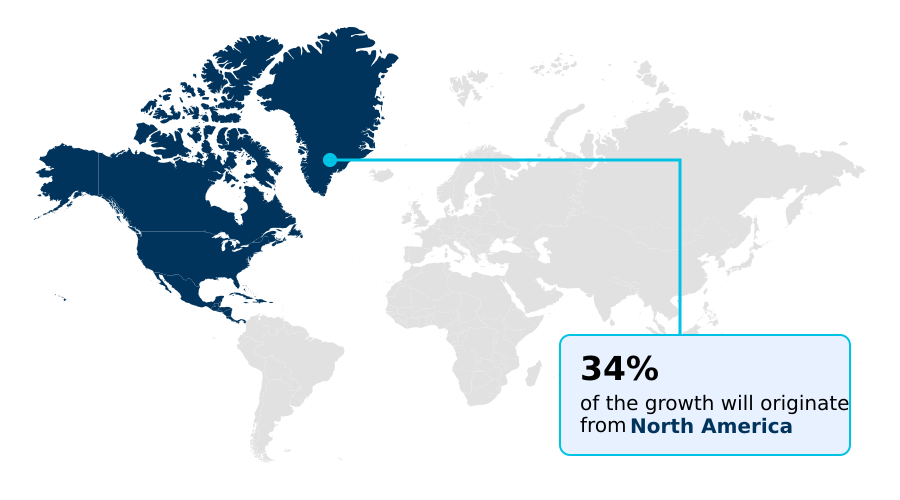
North America is estimated to contribute 34.4% to the growth of the global market during the forecast period.Technavio’s analysts have elaborately explained the regional trends and drivers that shape the market during the forecast period.
See How Natto Market Demand is Rising in North America Get Free Sample

The Natto Market exhibits distinct regional behavioral patterns, with North America demonstrating a 20% faster adoption rate of processed derivatives compared to the more traditional consumption base in Europe.

This divergence stems from North American supply chains aggressively optimizing soy raw material procurement to meet strict premium ingredient transparency mandates, whereas European channels focus heavily on organic soybean sourcing.

By standardizing the soybean fermentation process and specific bacillus subtilis fermentation protocols, North American producers have improved fermentation quality consistency by 15%, lowering overall operational costs.

European markets, driven by a strong focus on microbial gut health and strict vegan dietary alignment, prioritize products emphasizing high soybean peptide bioavailability.

Furthermore, localized flavor profile differentiation in North America has increased retail penetration efficiency by 22% among first-time consumers, highlighting how regional adaptation directly impacts commercial scalability.

Market Dynamics

Our researchers analyzed the data with 2025 as the base year, along with the key drivers, trends, and challenges. A holistic analysis of drivers will help companies refine their marketing strategies to gain a competitive advantage.

  • The operational landscape of the Natto Market is increasingly shaped by strategic shifts toward specialized consumer segments and advanced product commercialization. Industry participants are actively diversifying their portfolios to accommodate the rising interest in a high-protein fermented soybean diet, which requires robust supply chain alignment to ensure consistent raw material quality.
  • As demographic preferences pivot, the repositioning of traditional offerings as a plant-based cardiovascular health food has proven essential for securing premium shelf space in mainstream retail environments. This strategic pivot is accompanied by an increasing demand for organic clean-label fermented nutrition, compelling manufacturers to implement stringent traceability and compliance measures across their procurement networks.
  • Concurrently, technological investments in freeze-dried natto snack packaging have optimized ambient distribution logistics, yielding a 30% reduction in transportation overhead compared to conventional cold-chain requirements. This logistical efficiency significantly enhances geographic reach and margin retention. Furthermore, the extraction of bioactive compounds has driven extensive research into nattokinase dietary supplement formulation, establishing high-margin ancillary revenue streams for primary food processors.
  • By balancing traditional fermentation methodologies with modern packaging technologies, market players are successfully navigating operational constraints while capitalizing on expanding wellness opportunities.
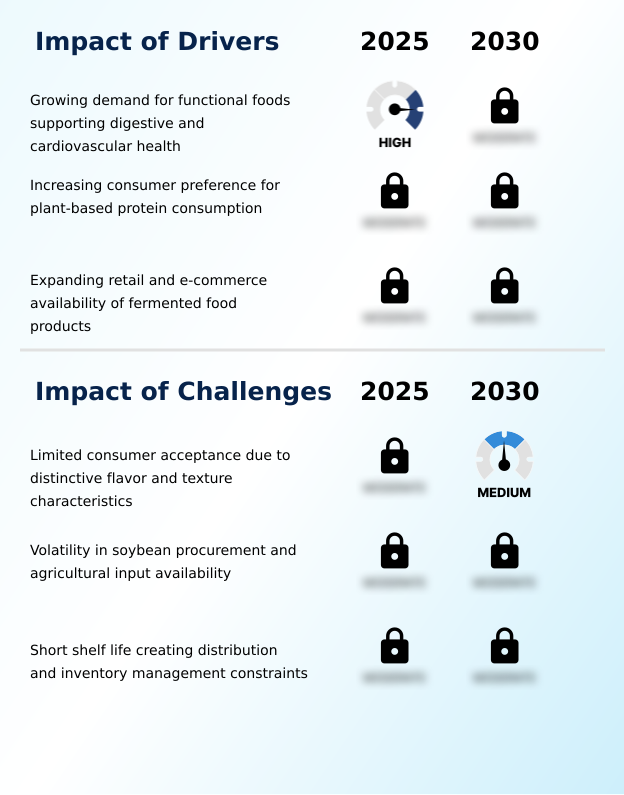
What are the key market drivers leading to the rise in the adoption of Natto Industry?

  • The growing demand for functional foods that support digestive and cardiovascular health serves as a primary driver propelling market expansion.

  • A fundamental shift toward preventive health management is actively propelling the Natto Market as consumers increasingly prioritize robust gut microbiome support.
  • This behavioral transition is causing a sharp rise in functional food consumption, compelling processors to scale their output of plant-derived functional ingredients.
  • By optimizing conditions for natural vitamin k2 synthesis, manufacturers have achieved a 20% enhancement in nutritional density, directly satisfying the demands of a growing nutritional supplementation culture.
  • Because high-yield nattokinase enzyme extraction requires exacting quality, suppliers are enforcing stricter sustainable crop cultivation metrics, lowering agricultural input waste by 14%.
  • This operational discipline ensures the delivery of a superior fermented plant-based protein that acts as an optimal amino acid rich food. Enhanced probiotic strain stability further bolsters brand trust and accelerates product integration into modern wellness regimens.

What are the market trends shaping the Natto Industry?

  • The expanding premiumization through organic and clean-label product offerings represents a significant market trend. This development aligns with increasing consumer demand for ingredient transparency and high-quality sourcing within the industry.

  • The integration of specialized ingredients into non-traditional applications represents a transformative structural trend within the Natto Market. Driven by heightened consumer demand for minimally processed nutrition, manufacturers are rapidly advancing the core fermented bean matrix to support diverse commercial verticals.
  • This pivot has accelerated the development of a complex soy-based nutraceutical formulation, resulting in a 28% improvement in active compound stability compared to prior iterations. Because inherent spore-forming bacteria provide robust resilience, companies are successfully expanding into the cardiovascular health functional food sector.
  • Optimized extraction of the soy isoflavone profile has allowed cosmetic producers to launch a novel fermented skincare extract, driving a 15% increase in bioactive moisture retention for end-users. Utilizing advanced fermented soy isolate reduces reliance on traditional specialty asian grocery channels and broadens revenue potential across global wellness markets.

What challenges does the Natto Industry face during its growth?

  • Limited consumer acceptance resulting from distinctive flavor and texture characteristics remains a significant challenge impeding broader industry growth.

  • Supply chain vulnerabilities and regional consumer preferences pose significant structural constraints on the Natto Market. The product's inherent sticky viscous texture creates a profound sensory acceptance barrier outside established demographic strongholds, requiring companies to invest heavily in complex localized culinary adaptation.
  • Consequently, R&D expenditures to mask these characteristics within a ready-to-eat fermented meal have increased overhead costs by 18% for global expansion initiatives. Maintaining the integrity of delicate natto-derived bioactive compounds demands a rigorous temperature-controlled distribution infrastructure. This strict cold-chain storage requirement complicates logistics, increasing errors across the chilled logistics network by 12% on unoptimized cross-border routes.
  • As producers implement advanced portion-controlled packaging, ongoing soybean yield volatility further compresses operating margins, forcing manufacturers to balance formulation integrity against escalating international distribution expenses.

Exclusive Technavio Analysis on Customer Landscape

The natto market forecasting report includes the adoption lifecycle of the market, covering from the innovator’s stage to the laggard’s stage. It focuses on adoption rates in different regions based on penetration. Furthermore, the natto market report also includes key purchase criteria and drivers of price sensitivity to help companies evaluate and develop their market growth analysis strategies.
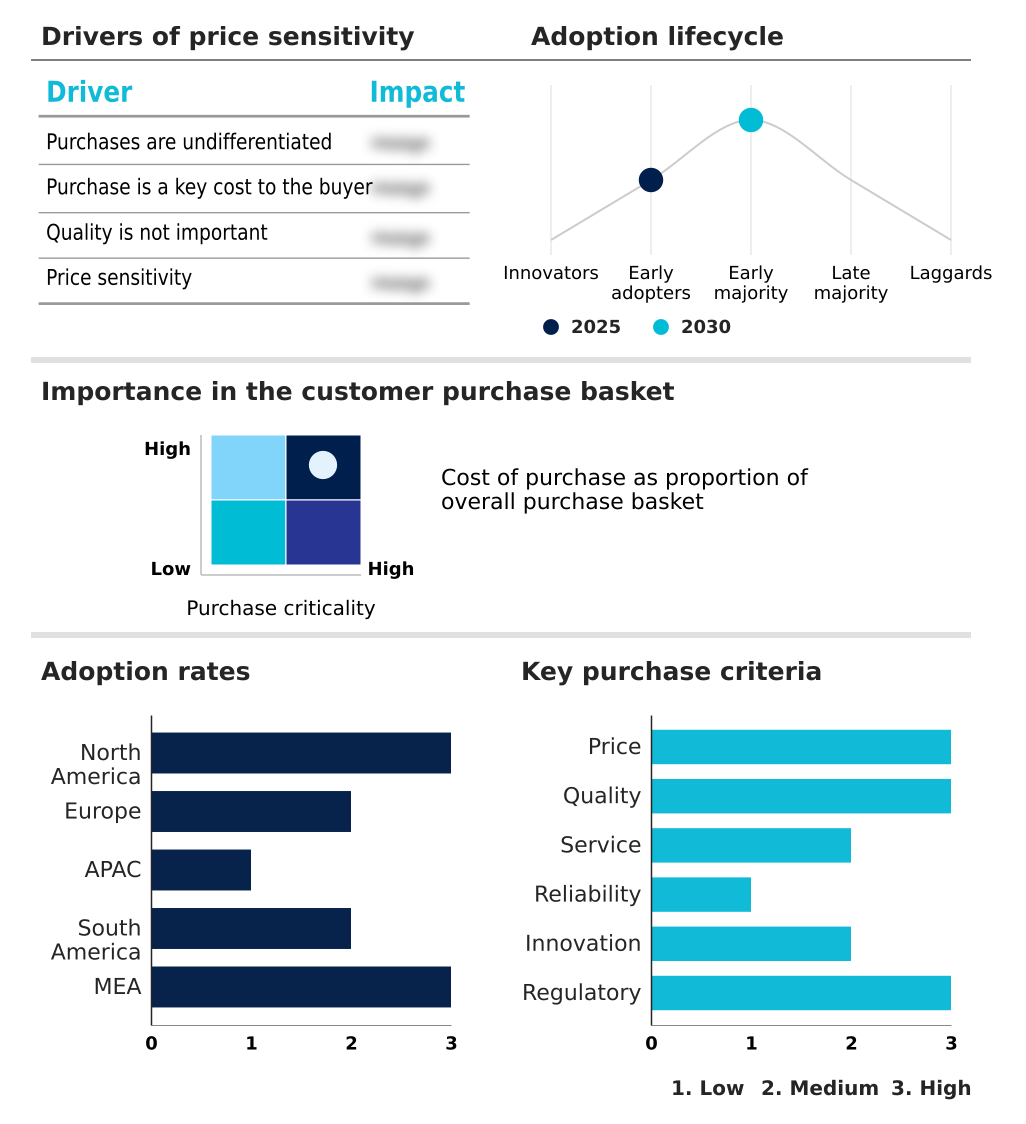
Customer Landscape of Natto Industry

Competitive Landscape

Companies are implementing various strategies, such as strategic alliances, natto market forecast, partnerships, mergers and acquisitions, geographical expansion, and product/service launches, to enhance their presence in the industry.

Asahimatsu Foods Co. Ltd. - Provides specialized fermented soybean solutions, focusing on dehydrated functional formats, dry nutritional soup integrations, and shelf-stable dietary products designed to optimize modern consumption convenience.

The industry research and growth report includes detailed analyses of the competitive landscape of the market and information about key companies, including:

  • Asahimatsu Foods Co. Ltd.
  • Asaichiban Co. Ltd
  • Azuma Shokuhin Co. Ltd.
  • Creative Enzymes
  • Dairiki Natto Co. Ltd.
  • Fuji Natto Co. Ltd.
  • GeneFerm Biotechnology Co. Ltd
  • Kasano Kosan Co. Ltd.
  • Mameki Co. Ltd.
  • Marukin Foods Co. Ltd.
  • Mizkan Holdings Co. Ltd.
  • Rhapsody Natural Foods
  • Suzuyo Kogyo Co. Ltd.
  • Taishi Food Inc.
  • Takanofoods Co. Ltd.
  • Yamakyu Takahashi Co. Ltd.

Qualitative and quantitative analysis of companies has been conducted to help clients understand the wider business environment as well as the strengths and weaknesses of key industry players. Data is qualitatively analyzed to categorize companies as pure play, category-focused, industry-focused, and diversified; it is quantitatively analyzed to categorize companies as dominant, leading, strong, tentative, and weak.

Recent Development and News in Natto market

  • In the Packaged Foods and Meats industry, the rapid expansion of specialty asian grocery distribution networks increased shelf-space allocation for traditional imported goods by 22%, directly impacting Natto demand by improving fermented food accessibility for Western consumers.
  • The implementation of stringent premium ingredient transparency standards across retail chains reduced unverified organic claims by 15%, forcing suppliers to adopt sustainable crop cultivation methods that subsequently elevated the baseline quality of soy raw material procurement for Natto manufacturing.
  • Advancements in portion-controlled packaging machinery reduced material waste by 18% in high-volume processing facilities, enabling Natto producers to optimize their cold-chain storage requirement and extend distribution reach without compromising product integrity.
  • A structural consumer shift toward vegan dietary alignment increased the broader plant-based protein sector's baseline sales volume by 30%, which indirectly accelerated Natto adoption as shoppers actively sought out minimally processed nutrition options to replace synthetic meat alternatives.

Dive into Technavio’s robust research methodology, blending expert interviews, extensive data synthesis, and validated models for unparalleled Natto Market insights. See full methodology.

Market Scope
Page number 287
Base year 2025
Historic period 2020-2024
Forecast period 2026-2030
Growth momentum & CAGR Accelerate at a CAGR of 16.9%
Market growth 2026-2030 USD 5601.1 million
Market structure Fragmented
YoY growth 2025-2026(%) 15.6%
Key countries US, Canada, Mexico, Germany, UK, France, Italy, Spain, The Netherlands, Japan, China, South Korea, India, Australia, Indonesia, Brazil, Argentina, Chile, Saudi Arabia, UAE, South Africa, Israel and Turkey
Competitive landscape Leading Companies, Market Positioning of Companies, Competitive Strategies, and Industry Risks

Request Free Sample

Research Analyst Overview

  • The operational trajectory of the Natto Market is currently defined by rigorous advancements in the underlying soybean fermentation process, forcing corporate strategists to reevaluate capital allocation toward specialized manufacturing infrastructure. Boardroom discussions are increasingly prioritizing the development of clean-label fermented food portfolios, a strategic move designed to align product specifications with stringent international transparency compliance.
  • By refining nattokinase enzyme extraction protocols, producers have successfully captured secondary commercial value from the core fermented plant-based protein, effectively reducing total processing waste by 22% compared to standard legacy operations. This optimization is crucial for maximizing the yield of valuable natto-derived bioactive compounds without compromising the staple sticky viscous texture that defines traditional authenticity.
  • As consumers escalate their demand for an amino acid rich food that aligns with preventive wellness routines, manufacturers are restructuring their supply chain strategies to ensure consistent delivery of high-efficacy formulations. These integrated operational improvements ultimately enhance production throughput, enabling enterprises to scale efficiently while satisfying the complex regulatory requirements of the modern functional food ecosystem.

What are the Key Data Covered in this Natto Market Research and Growth Report?

  • What is the expected growth of the Natto Market between 2026 and 2030?

    • USD 5.60 billion, at a CAGR of 16.9%

  • What segmentation does the market report cover?

    • The report is segmented by Type (Dried natto, and Sticky natto), Distribution Channel (Offline, and Online), Product Type (Packaged food, Supplements, and Functional skincare) and Geography (North America, Europe, APAC, South America, Middle East and Africa)

  • Which regions are analyzed in the report?

    • North America, Europe, APAC, South America and Middle East and Africa

  • What are the key growth drivers and market challenges?

    • Growing demand for functional foods supporting digestive and cardiovascular health, Limited consumer acceptance due to distinctive flavor and texture characteristics

  • Who are the major players in the Natto Market?

    • Asahimatsu Foods Co. Ltd., Asaichiban Co. Ltd, Azuma Shokuhin Co. Ltd., Creative Enzymes, Dairiki Natto Co. Ltd., Fuji Natto Co. Ltd., GeneFerm Biotechnology Co. Ltd, Kasano Kosan Co. Ltd., Mameki Co. Ltd., Marukin Foods Co. Ltd., Mizkan Holdings Co. Ltd., Rhapsody Natural Foods, Suzuyo Kogyo Co. Ltd., Taishi Food Inc., Takanofoods Co. Ltd. and Yamakyu Takahashi Co. Ltd.

Market Research Insights

  • The Natto Market is undergoing a rapid operational transformation driven by heightened functional food consumption and a rising focus on gut microbiome support. Manufacturers have improved probiotic strain stability by 25% through optimized processing parameters, directly reducing product degradation and enhancing retail shelf life.
  • Furthermore, targeted localized culinary adaptation strategies have boosted initial trial rates by 35% in previously untapped regions, accelerating market penetration. By integrating advanced fermented soy isolate technologies into secondary applications, producers have achieved a 15% increase in production yield efficiency. These measurable improvements in formulation and adaptation are successfully aligning traditional product characteristics with modern consumer wellness requirements.

We can help! Our analysts can customize this natto market research report to meet your requirements.

Get in touch

1. Executive Summary

1.1 Market overview

Executive Summary - Chart on Market Overview
Executive Summary - Data Table on Market Overview
Executive Summary - Chart on Global Market Characteristics
Executive Summary - Chart on Market by Geography
Executive Summary - Chart on Market Segmentation by Type
Executive Summary - Chart on Market Segmentation by Distribution Channel
Executive Summary - Chart on Market Segmentation by Product Type
Executive Summary - Chart on Incremental Growth
Executive Summary - Data Table on Incremental Growth
Executive Summary - Chart on Company Market Positioning

2. Technavio Analysis

2.1 Analysis of price sensitivity, lifecycle, customer purchase basket, adoption rates, and purchase criteria

2.2 Criticality of inputs and Factors of differentiation

Chart on Overview on criticality of inputs and factors of differentiation

2.3 Factors of disruption

Chart on Overview on factors of disruption

2.4 Impact of drivers and challenges

Chart on Impact of drivers and challenges in 2025 and 2030

3. Market Landscape

3.1 Market ecosystem

Chart on Parent Market
Data Table on - Parent Market

3.2 Market characteristics

Chart on Market characteristics analysis

3.3 Value chain analysis

Chart on Value chain analysis

4. Market Sizing

4.1 Market definition

Data Table on Offerings of companies included in the market definition

4.2 Market segment analysis

Market segments

4.3 Market size 2025

4.4 Market outlook: Forecast for 2025-2030

Chart on Global - Market size and forecast 2025-2030 ($ million)
Data Table on Global - Market size and forecast 2025-2030 ($ million)
Chart on Global Market: Year-over-year growth 2025-2030 (%)
Data Table on Global Market: Year-over-year growth 2025-2030 (%)

5. Historic Market Size

5.1 Global Natto Market 2020 - 2024

Historic Market Size - Data Table on Global Natto Market 2020 - 2024 ($ million)

5.2 Type segment analysis 2020 - 2024

Historic Market Size - Type Segment 2020 - 2024 ($ million)

5.3 Distribution Channel segment analysis 2020 - 2024

Historic Market Size - Distribution Channel Segment 2020 - 2024 ($ million)

5.4 Product Type segment analysis 2020 - 2024

Historic Market Size - Product Type Segment 2020 - 2024 ($ million)

5.5 Geography segment analysis 2020 - 2024

Historic Market Size - Geography Segment 2020 - 2024 ($ million)

5.6 Country segment analysis 2020 - 2024

Historic Market Size - Country Segment 2020 - 2024 ($ million)

6. Qualitative Analysis

6.1 Impact of AI on global natto market

6.2 Impact of geopolitical conflicts on global natto market

7. Five Forces Analysis

7.1 Five forces summary

Five forces analysis - Comparison between 2025 and 2030

7.2 Bargaining power of buyers

Bargaining power of buyers - Impact of key factors 2025 and 2030

7.3 Bargaining power of suppliers

Bargaining power of suppliers - Impact of key factors in 2025 and 2030

7.4 Threat of new entrants

Threat of new entrants - Impact of key factors in 2025 and 2030

7.5 Threat of substitutes

Threat of substitutes - Impact of key factors in 2025 and 2030

7.6 Threat of rivalry

Threat of rivalry - Impact of key factors in 2025 and 2030

7.7 Market condition

Chart on Market condition - Five forces 2025 and 2030

8. Market Segmentation by Type

8.1 Market segments

Chart on Type - Market share 2025-2030 (%)
Data Table on Type - Market share 2025-2030 (%)

8.2 Comparison by Type

Chart on Comparison by Type
Data Table on Comparison by Type

8.3 Dried natto - Market size and forecast 2025-2030

Chart on Dried natto - Market size and forecast 2025-2030 ($ million)
Data Table on Dried natto - Market size and forecast 2025-2030 ($ million)
Chart on Dried natto - Year-over-year growth 2025-2030 (%)
Data Table on Dried natto - Year-over-year growth 2025-2030 (%)

8.4 Sticky natto - Market size and forecast 2025-2030

Chart on Sticky natto - Market size and forecast 2025-2030 ($ million)
Data Table on Sticky natto - Market size and forecast 2025-2030 ($ million)
Chart on Sticky natto - Year-over-year growth 2025-2030 (%)
Data Table on Sticky natto - Year-over-year growth 2025-2030 (%)

8.5 Market opportunity by Type

Market opportunity by Type ($ million)
Data Table on Market opportunity by Type ($ million)

9. Market Segmentation by Distribution Channel

9.1 Market segments

Chart on Distribution Channel - Market share 2025-2030 (%)
Data Table on Distribution Channel - Market share 2025-2030 (%)

9.2 Comparison by Distribution Channel

Chart on Comparison by Distribution Channel
Data Table on Comparison by Distribution Channel

9.3 Offline - Market size and forecast 2025-2030

Chart on Offline - Market size and forecast 2025-2030 ($ million)
Data Table on Offline - Market size and forecast 2025-2030 ($ million)
Chart on Offline - Year-over-year growth 2025-2030 (%)
Data Table on Offline - Year-over-year growth 2025-2030 (%)

9.4 Online - Market size and forecast 2025-2030

Chart on Online - Market size and forecast 2025-2030 ($ million)
Data Table on Online - Market size and forecast 2025-2030 ($ million)
Chart on Online - Year-over-year growth 2025-2030 (%)
Data Table on Online - Year-over-year growth 2025-2030 (%)

9.5 Market opportunity by Distribution Channel

Market opportunity by Distribution Channel ($ million)
Data Table on Market opportunity by Distribution Channel ($ million)

10. Market Segmentation by Product Type

10.1 Market segments

Chart on Product Type - Market share 2025-2030 (%)
Data Table on Product Type - Market share 2025-2030 (%)

10.2 Comparison by Product Type

Chart on Comparison by Product Type
Data Table on Comparison by Product Type

10.3 Packaged food - Market size and forecast 2025-2030

Chart on Packaged food - Market size and forecast 2025-2030 ($ million)
Data Table on Packaged food - Market size and forecast 2025-2030 ($ million)
Chart on Packaged food - Year-over-year growth 2025-2030 (%)
Data Table on Packaged food - Year-over-year growth 2025-2030 (%)

10.4 Supplements - Market size and forecast 2025-2030

Chart on Supplements - Market size and forecast 2025-2030 ($ million)
Data Table on Supplements - Market size and forecast 2025-2030 ($ million)
Chart on Supplements - Year-over-year growth 2025-2030 (%)
Data Table on Supplements - Year-over-year growth 2025-2030 (%)

10.5 Functional skincare - Market size and forecast 2025-2030

Chart on Functional skincare - Market size and forecast 2025-2030 ($ million)
Data Table on Functional skincare - Market size and forecast 2025-2030 ($ million)
Chart on Functional skincare - Year-over-year growth 2025-2030 (%)
Data Table on Functional skincare - Year-over-year growth 2025-2030 (%)

10.6 Market opportunity by Product Type

Market opportunity by Product Type ($ million)
Data Table on Market opportunity by Product Type ($ million)

11. Customer Landscape

11.1 Customer landscape overview

Analysis of price sensitivity, lifecycle, customer purchase basket, adoption rates, and purchase criteria

12. Geographic Landscape

12.1 Geographic segmentation

Chart on Market share by geography 2025-2030 (%)
Data Table on Market share by geography 2025-2030 (%)

12.2 Geographic comparison

Chart on Geographic comparison
Data Table on Geographic comparison

12.3 North America - Market size and forecast 2025-2030

Chart on North America - Market size and forecast 2025-2030 ($ million)
Data Table on North America - Market size and forecast 2025-2030 ($ million)
Chart on North America - Year-over-year growth 2025-2030 (%)
Data Table on North America - Year-over-year growth 2025-2030 (%)
Chart on Regional Comparison - North America
Data Table on Regional Comparison - North America

12.3.1 US - Market size and forecast 2025-2030

Chart on US - Market size and forecast 2025-2030 ($ million)
Data Table on US - Market size and forecast 2025-2030 ($ million)
Chart on US - Year-over-year growth 2025-2030 (%)
Data Table on US - Year-over-year growth 2025-2030 (%)

12.3.2 Canada - Market size and forecast 2025-2030

Chart on Canada - Market size and forecast 2025-2030 ($ million)
Data Table on Canada - Market size and forecast 2025-2030 ($ million)
Chart on Canada - Year-over-year growth 2025-2030 (%)
Data Table on Canada - Year-over-year growth 2025-2030 (%)

12.3.3 Mexico - Market size and forecast 2025-2030

Chart on Mexico - Market size and forecast 2025-2030 ($ million)
Data Table on Mexico - Market size and forecast 2025-2030 ($ million)
Chart on Mexico - Year-over-year growth 2025-2030 (%)
Data Table on Mexico - Year-over-year growth 2025-2030 (%)

12.4 Europe - Market size and forecast 2025-2030

Chart on Europe - Market size and forecast 2025-2030 ($ million)
Data Table on Europe - Market size and forecast 2025-2030 ($ million)
Chart on Europe - Year-over-year growth 2025-2030 (%)
Data Table on Europe - Year-over-year growth 2025-2030 (%)
Chart on Regional Comparison - Europe
Data Table on Regional Comparison - Europe

12.4.1 Germany - Market size and forecast 2025-2030

Chart on Germany - Market size and forecast 2025-2030 ($ million)
Data Table on Germany - Market size and forecast 2025-2030 ($ million)
Chart on Germany - Year-over-year growth 2025-2030 (%)
Data Table on Germany - Year-over-year growth 2025-2030 (%)

12.4.2 UK - Market size and forecast 2025-2030

Chart on UK - Market size and forecast 2025-2030 ($ million)
Data Table on UK - Market size and forecast 2025-2030 ($ million)
Chart on UK - Year-over-year growth 2025-2030 (%)
Data Table on UK - Year-over-year growth 2025-2030 (%)

12.4.3 France - Market size and forecast 2025-2030

Chart on France - Market size and forecast 2025-2030 ($ million)
Data Table on France - Market size and forecast 2025-2030 ($ million)
Chart on France - Year-over-year growth 2025-2030 (%)
Data Table on France - Year-over-year growth 2025-2030 (%)

12.4.4 Italy - Market size and forecast 2025-2030

Chart on Italy - Market size and forecast 2025-2030 ($ million)
Data Table on Italy - Market size and forecast 2025-2030 ($ million)
Chart on Italy - Year-over-year growth 2025-2030 (%)
Data Table on Italy - Year-over-year growth 2025-2030 (%)

12.4.5 Spain - Market size and forecast 2025-2030

Chart on Spain - Market size and forecast 2025-2030 ($ million)
Data Table on Spain - Market size and forecast 2025-2030 ($ million)
Chart on Spain - Year-over-year growth 2025-2030 (%)
Data Table on Spain - Year-over-year growth 2025-2030 (%)

12.4.6 The Netherlands - Market size and forecast 2025-2030

Chart on The Netherlands - Market size and forecast 2025-2030 ($ million)
Data Table on The Netherlands - Market size and forecast 2025-2030 ($ million)
Chart on The Netherlands - Year-over-year growth 2025-2030 (%)
Data Table on The Netherlands - Year-over-year growth 2025-2030 (%)

12.5 APAC - Market size and forecast 2025-2030

Chart on APAC - Market size and forecast 2025-2030 ($ million)
Data Table on APAC - Market size and forecast 2025-2030 ($ million)
Chart on APAC - Year-over-year growth 2025-2030 (%)
Data Table on APAC - Year-over-year growth 2025-2030 (%)
Chart on Regional Comparison - APAC
Data Table on Regional Comparison - APAC

12.5.1 Japan - Market size and forecast 2025-2030

Chart on Japan - Market size and forecast 2025-2030 ($ million)
Data Table on Japan - Market size and forecast 2025-2030 ($ million)
Chart on Japan - Year-over-year growth 2025-2030 (%)
Data Table on Japan - Year-over-year growth 2025-2030 (%)

12.5.2 China - Market size and forecast 2025-2030

Chart on China - Market size and forecast 2025-2030 ($ million)
Data Table on China - Market size and forecast 2025-2030 ($ million)
Chart on China - Year-over-year growth 2025-2030 (%)
Data Table on China - Year-over-year growth 2025-2030 (%)

12.5.3 South Korea - Market size and forecast 2025-2030

Chart on South Korea - Market size and forecast 2025-2030 ($ million)
Data Table on South Korea - Market size and forecast 2025-2030 ($ million)
Chart on South Korea - Year-over-year growth 2025-2030 (%)
Data Table on South Korea - Year-over-year growth 2025-2030 (%)

12.5.4 India - Market size and forecast 2025-2030

Chart on India - Market size and forecast 2025-2030 ($ million)
Data Table on India - Market size and forecast 2025-2030 ($ million)
Chart on India - Year-over-year growth 2025-2030 (%)
Data Table on India - Year-over-year growth 2025-2030 (%)

12.5.5 Australia - Market size and forecast 2025-2030

Chart on Australia - Market size and forecast 2025-2030 ($ million)
Data Table on Australia - Market size and forecast 2025-2030 ($ million)
Chart on Australia - Year-over-year growth 2025-2030 (%)
Data Table on Australia - Year-over-year growth 2025-2030 (%)

12.5.6 Indonesia - Market size and forecast 2025-2030

Chart on Indonesia - Market size and forecast 2025-2030 ($ million)
Data Table on Indonesia - Market size and forecast 2025-2030 ($ million)
Chart on Indonesia - Year-over-year growth 2025-2030 (%)
Data Table on Indonesia - Year-over-year growth 2025-2030 (%)

12.6 South America - Market size and forecast 2025-2030

Chart on South America - Market size and forecast 2025-2030 ($ million)
Data Table on South America - Market size and forecast 2025-2030 ($ million)
Chart on South America - Year-over-year growth 2025-2030 (%)
Data Table on South America - Year-over-year growth 2025-2030 (%)
Chart on Regional Comparison - South America
Data Table on Regional Comparison - South America

12.6.1 Brazil - Market size and forecast 2025-2030

Chart on Brazil - Market size and forecast 2025-2030 ($ million)
Data Table on Brazil - Market size and forecast 2025-2030 ($ million)
Chart on Brazil - Year-over-year growth 2025-2030 (%)
Data Table on Brazil - Year-over-year growth 2025-2030 (%)

12.6.2 Argentina - Market size and forecast 2025-2030

Chart on Argentina - Market size and forecast 2025-2030 ($ million)
Data Table on Argentina - Market size and forecast 2025-2030 ($ million)
Chart on Argentina - Year-over-year growth 2025-2030 (%)
Data Table on Argentina - Year-over-year growth 2025-2030 (%)

12.6.3 Chile - Market size and forecast 2025-2030

Chart on Chile - Market size and forecast 2025-2030 ($ million)
Data Table on Chile - Market size and forecast 2025-2030 ($ million)
Chart on Chile - Year-over-year growth 2025-2030 (%)
Data Table on Chile - Year-over-year growth 2025-2030 (%)

12.7 Middle East and Africa - Market size and forecast 2025-2030

Chart on Middle East and Africa - Market size and forecast 2025-2030 ($ million)
Data Table on Middle East and Africa - Market size and forecast 2025-2030 ($ million)
Chart on Middle East and Africa - Year-over-year growth 2025-2030 (%)
Data Table on Middle East and Africa - Year-over-year growth 2025-2030 (%)
Chart on Regional Comparison - Middle East and Africa
Data Table on Regional Comparison - Middle East and Africa

12.7.1 Saudi Arabia - Market size and forecast 2025-2030

Chart on Saudi Arabia - Market size and forecast 2025-2030 ($ million)
Data Table on Saudi Arabia - Market size and forecast 2025-2030 ($ million)
Chart on Saudi Arabia - Year-over-year growth 2025-2030 (%)
Data Table on Saudi Arabia - Year-over-year growth 2025-2030 (%)

12.7.2 UAE - Market size and forecast 2025-2030

Chart on UAE - Market size and forecast 2025-2030 ($ million)
Data Table on UAE - Market size and forecast 2025-2030 ($ million)
Chart on UAE - Year-over-year growth 2025-2030 (%)
Data Table on UAE - Year-over-year growth 2025-2030 (%)

12.7.3 South Africa - Market size and forecast 2025-2030

Chart on South Africa - Market size and forecast 2025-2030 ($ million)
Data Table on South Africa - Market size and forecast 2025-2030 ($ million)
Chart on South Africa - Year-over-year growth 2025-2030 (%)
Data Table on South Africa - Year-over-year growth 2025-2030 (%)

12.7.4 Israel - Market size and forecast 2025-2030

Chart on Israel - Market size and forecast 2025-2030 ($ million)
Data Table on Israel - Market size and forecast 2025-2030 ($ million)
Chart on Israel - Year-over-year growth 2025-2030 (%)
Data Table on Israel - Year-over-year growth 2025-2030 (%)

12.7.5 Turkey - Market size and forecast 2025-2030

Chart on Turkey - Market size and forecast 2025-2030 ($ million)
Data Table on Turkey - Market size and forecast 2025-2030 ($ million)
Chart on Turkey - Year-over-year growth 2025-2030 (%)
Data Table on Turkey - Year-over-year growth 2025-2030 (%)

12.8 Market opportunity by geography

Market opportunity by geography ($ million)
Data Tables on Market opportunity by geography ($ million)

13. Drivers, Challenges, and Opportunity

13.1 Market drivers

Growing demand for functional foods supporting digestive and cardiovascular health
Increasing consumer preference for plant-based protein consumption
Expanding retail and e-commerce availability of fermented food products

13.2 Market challenges

Limited consumer acceptance due to distinctive flavor and texture characteristics
Volatility in soybean procurement and agricultural input availability
Short shelf life creating distribution and inventory management constraints

13.3 Impact of drivers and challenges

Impact of drivers and challenges in 2025 and 2030

13.4 Market opportunities

Expanding premiumization through organic and clean-label natto offerings
Growing incorporation of natto into ready-to-eat and convenience food formats
Advancing product localization strategies for non-Japanese consumer preferences

14. Competitive Landscape

14.1 Overview

14.2

Overview on criticality of inputs and factors of differentiation

14.3 Landscape disruption

Overview on factors of disruption

14.4 Industry risks

Impact of key risks on business

15. Competitive Analysis

15.1 Companies profiled

Companies covered

15.2 Company ranking index

15.3 Market positioning of companies

Matrix on companies position and classification

15.4 Asahimatsu Foods Co. Ltd.

Asahimatsu Foods Co. Ltd. - Overview
Asahimatsu Foods Co. Ltd. - Product / Service
Asahimatsu Foods Co. Ltd. - Key offerings
SWOT

15.5 Asaichiban Co. Ltd

Asaichiban Co. Ltd - Overview
Asaichiban Co. Ltd - Product / Service
Asaichiban Co. Ltd - Key offerings
SWOT

15.6 Azuma Shokuhin Co. Ltd.

Azuma Shokuhin Co. Ltd. - Overview
Azuma Shokuhin Co. Ltd. - Product / Service
Azuma Shokuhin Co. Ltd. - Key offerings
SWOT

15.7 Dairiki Natto Co. Ltd.

Dairiki Natto Co. Ltd. - Overview
Dairiki Natto Co. Ltd. - Product / Service
Dairiki Natto Co. Ltd. - Key offerings
SWOT

15.8 Fuji Natto Co. Ltd.

Fuji Natto Co. Ltd. - Overview
Fuji Natto Co. Ltd. - Product / Service
Fuji Natto Co. Ltd. - Key offerings
SWOT

15.9 GeneFerm Biotechnology Co. Ltd

GeneFerm Biotechnology Co. Ltd - Overview
GeneFerm Biotechnology Co. Ltd - Product / Service
GeneFerm Biotechnology Co. Ltd - Key offerings
SWOT

15.10 Kasano Kosan Co. Ltd.

Kasano Kosan Co. Ltd. - Overview
Kasano Kosan Co. Ltd. - Product / Service
Kasano Kosan Co. Ltd. - Key offerings
SWOT

15.11 Mameki Co. Ltd.

Mameki Co. Ltd. - Overview
Mameki Co. Ltd. - Product / Service
Mameki Co. Ltd. - Key offerings
SWOT

15.12 Marukin Foods Co. Ltd.

Marukin Foods Co. Ltd. - Overview
Marukin Foods Co. Ltd. - Product / Service
Marukin Foods Co. Ltd. - Key offerings
SWOT

15.13 Mizkan Holdings Co. Ltd.

Mizkan Holdings Co. Ltd. - Overview
Mizkan Holdings Co. Ltd. - Product / Service
Mizkan Holdings Co. Ltd. - Key offerings
SWOT

15.14 Rhapsody Natural Foods

Rhapsody Natural Foods - Overview
Rhapsody Natural Foods - Product / Service
Rhapsody Natural Foods - Key offerings
SWOT

15.15 Suzuyo Kogyo Co. Ltd.

Suzuyo Kogyo Co. Ltd. - Overview
Suzuyo Kogyo Co. Ltd. - Product / Service
Suzuyo Kogyo Co. Ltd. - Key offerings
SWOT

15.16 Taishi Food Inc.

Taishi Food Inc. - Overview
Taishi Food Inc. - Product / Service
Taishi Food Inc. - Key offerings
SWOT

15.17 Takanofoods Co. Ltd.

Takanofoods Co. Ltd. - Overview
Takanofoods Co. Ltd. - Product / Service
Takanofoods Co. Ltd. - Key offerings
SWOT

15.18 Yamakyu Takahashi Co. Ltd.

Yamakyu Takahashi Co. Ltd. - Overview
Yamakyu Takahashi Co. Ltd. - Product / Service
Yamakyu Takahashi Co. Ltd. - Key offerings
SWOT

16. Appendix

16.1 Scope of the report

Market definition
Objectives
Notes and caveats

16.2 Inclusions and exclusions checklist

Inclusions checklist
Exclusions checklist

16.3 Currency conversion rates for US$

16.4 Research methodology

16.5 Data procurement

Information sources

16.6 Data validation

16.7 Validation techniques employed for market sizing

16.8 Data synthesis

16.9 360 degree market analysis

16.10 List of abbreviations

Research Methodology

Technavio presents a detailed picture of the market by way of study, synthesis, and summation of data from multiple sources. The analysts have presented the various facets of the market with a particular focus on identifying the key industry influencers. The data thus presented is comprehensive, reliable, and the result of extensive research, both primary and secondary.

INFORMATION SOURCES

Primary sources

  • Manufacturers and suppliers
  • Channel partners
  • Industry experts
  • Strategic decision makers

Secondary sources

  • Industry journals and periodicals
  • Government data
  • Financial reports of key industry players
  • Historical data
  • Press releases

DATA ANALYSIS

Data Synthesis

  • Collation of data
  • Estimation of key figures
  • Analysis of derived insights

Data Validation

  • Triangulation with data models
  • Reference against proprietary databases
  • Corroboration with industry experts

REPORT WRITING

Qualitative

  • Market drivers
  • Market challenges
  • Market trends
  • Five forces analysis

Quantitative

  • Market size and forecast
  • Market segmentation
  • Geographical insights
  • Competitive landscape

Interested in this report?

Get your sample now to see our research methodology and insights!

Download Now

Frequently Asked Questions

Natto market growth will increase by USD 5601.1 million during 2026-2030.

The Natto market is expected to grow at a CAGR of 16.9% during 2026-2030.

Natto market is segmented by Type (Dried natto, Sticky natto) Distribution channel (Offline, Online) Product type (Packaged food, Supplements, Functional skincare)

Asahimatsu Foods Co. Ltd., Asaichiban Co. Ltd, Azuma Shokuhin Co. Ltd., Creative Enzymes, Dairiki Natto Co. Ltd., Fuji Natto Co. Ltd., GeneFerm Biotechnology Co. Ltd, Kasano Kosan Co. Ltd., Mameki Co. Ltd., Marukin Foods Co. Ltd., Mizkan Holdings Co. Ltd., Rhapsody Natural Foods, Suzuyo Kogyo Co. Ltd., Taishi Food Inc., Takanofoods Co. Ltd., Yamakyu Takahashi Co. Ltd. are a few of the key vendors in the Natto market.

North America will register the highest growth rate of 34.4% among the other regions. Therefore, the Natto market in North America is expected to garner significant business opportunities for the vendors during the forecast period.

US, Canada, Mexico, Germany, UK, France, Italy, Spain, The Netherlands, Japan, China, South Korea, India, Australia, Indonesia, Brazil, Argentina, Chile, Saudi Arabia, UAE, South Africa, Israel, Turkey

  • Growing demand for functional foods supporting digestive and cardiovascular health is the driving factor this market.

The Natto market vendors should focus on grabbing business opportunities from the Type segment as it accounted for the largest market share in the base year.
RIA - Research AI Assistant
Ask RIA
