Neural Processor Market Analysis, Size, and Forecast 2026-2030: North America (US, Canada, and Mexico), APAC (China, Japan, and India), Europe (Germany, UK, and France), Middle East and Africa (UAE, Israel, and Saudi Arabia), South America (Brazil, Argentina, and Colombia), and Rest of World (ROW)

Neural Processor Market Analysis, Size, and Forecast 2026-2030:
North America (US, Canada, and Mexico), APAC (China, Japan, and India), Europe (Germany, UK, and France), Middle East and Africa (UAE, Israel, and Saudi Arabia), South America (Brazil, Argentina, and Colombia), and Rest of World (ROW)

Published: May 2026 313 Pages SKU: IRTNTR81399

Market Overview at a Glance

$272.06 Mn
Market Opportunity
20.2%
CAGR 2025 - 2030
32.6%
APAC Growth
$89.65 Mn
Cloud based processing segment 2024

Neural Processor Market Size and Growth Forecast 2026-2030

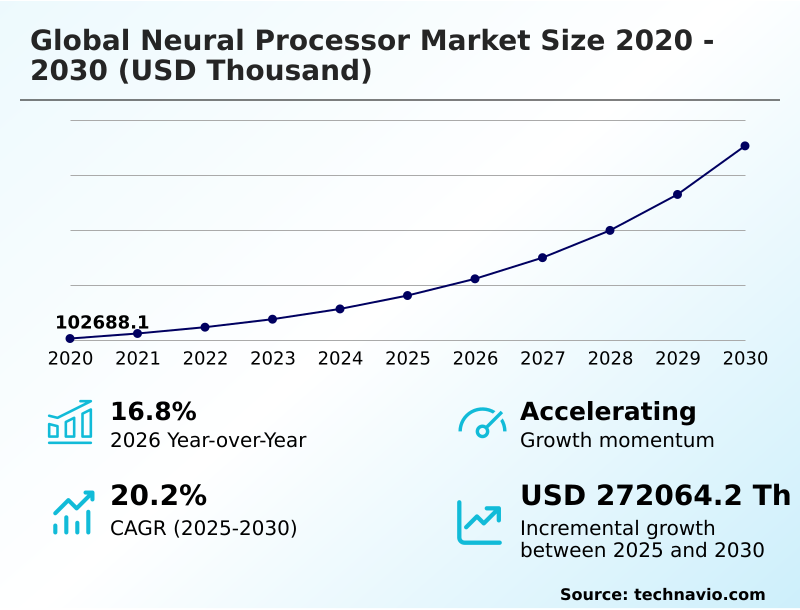
The Neural Processor Market size was valued at USD 180.87 million in 2025 growing at a CAGR of 20.2% during the forecast period 2026-2030.

APAC accounts for 32.6% of incremental growth during the forecast period. The Cloud based processing segment by Deployment was valued at USD 89.65 million in 2024, while the Consumer electronics segment holds the largest revenue share by End-user.

The market is projected to grow by from 2020 to 2030, with USD 272.06 million of the growth expected during the forecast period of 2025 to 2030.

Get Key Insights on Market Forecast (PDF) Request Free Sample

Neural Processor Market Overview

The neural processor market is defined by a rapid shift toward specialized hardware acceleration, driven by the escalating complexity of AI workloads. With a year-over-year growth of 16.8%, the demand for efficient parallel computing paradigms is reshaping enterprise and consumer technology. This expansion is not uniform; North America continues to lead in deployment, but APAC is the fastest-growing region, commanding nearly 33% of the incremental growth. In a practical application, an automotive manufacturing plant deploys computer vision hardware at the end of its assembly line. This system, powered by dedicated neural network processors, performs real-time data interpretation to inspect for microscopic paint defects, reducing the manual inspection error rate and scrap costs. This level of on-device AI processing relies on sophisticated system on chip design to function without cloud latency, showcasing the market's move toward intelligent, decentralized data processing. This trend is further supported by innovations in low-latency processing and edge AI hardware, which are critical for mission-critical industrial automation.

Drivers, Trends, and Challenges in the Neural Processor Market

Strategic decisions regarding the adoption of neural processors hinge on a complex analysis that balances performance against total cost of ownership. The high cost of custom AI chip design is a significant barrier for many organizations, prompting a closer evaluation of off-the-shelf application specific integrated circuits versus developing proprietary hardware.

For instance, in a large hospital deploying an AI-powered diagnostics platform, the choice of neural processor architecture for LLMs used to analyze clinical notes is critical. The platform must adhere to strict HIPAA regulations, pushing processing to the edge. The low latency in edge computing devices is non-negotiable for real-time analysis of medical imagery.

Simultaneously, the facility must manage the energy consumption of AI hardware to comply with its ISO 50001 certification, a challenge when deploying powerful systems. This same trade-off analysis mirrors the one used for selecting a neural processor for autonomous driving, where computational power must be balanced against stringent power, thermal, and safety constraints.

The market's 20.2% growth momentum is accelerating as more industries navigate these complex hardware decisions to unlock the value of their data.

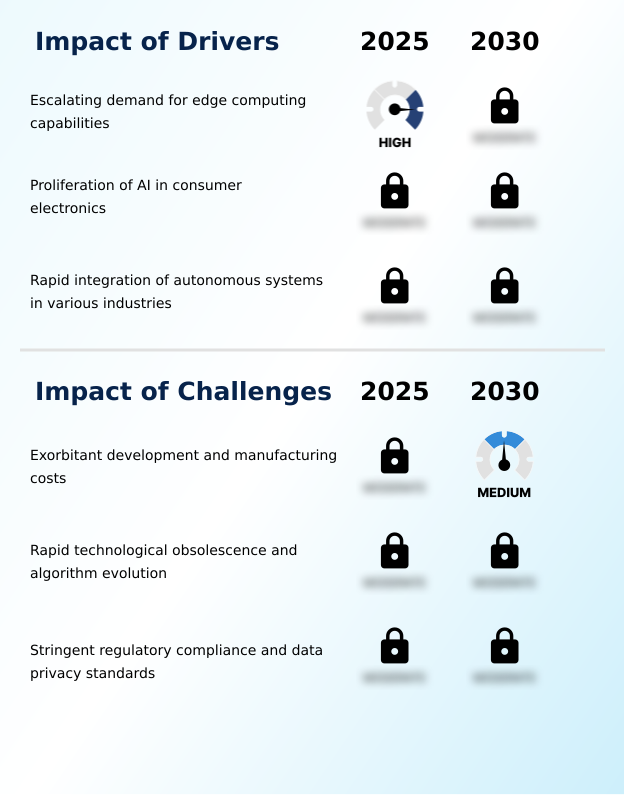
Primary Growth Driver: The escalating demand for low-latency processing in edge computing applications is a primary driver fueling market expansion.

Market growth is fundamentally driven by the proliferation of AI into latency-sensitive and power-constrained environments.

The escalating demand for edge AI hardware is a direct response to the limitations of cloud computing, enabling real-time data interpretation for industrial predictive maintenance models and smart city infrastructure.

This is amplified by the widespread integration of on-device AI processing in consumer electronics, where features like computational photography and voice recognition depend on efficient system on chip design.

Furthermore, the rapid advancement of autonomous systems navigation in the automotive sector, which contributed 32.6% to incremental growth, relies on sophisticated sensor fusion algorithms running on dedicated neural network processors.

These drivers collectively push the industry toward more powerful, efficient, and decentralized data processing capabilities.

Emerging Market Trend: A key market trend is the accelerated adoption of neuromorphic engineering and brain-inspired designs. This move toward energy-proportional architectures addresses the power and thermal limitations of conventional processors.

The market is evolving beyond raw performance, with significant trends emerging around architectural innovation and application-specific designs. An accelerated adoption of neuromorphic engineering is underway, driven by the need for more energy-efficient computing that mimics biological neural pathways, offering a solution to the thermal limitations of traditional data centers.

In parallel, the deployment of photonic neural networks is gaining momentum to address data transfer bottlenecks, using silicon photonics to enable ultra-low-latency processing for high-frequency algorithmic trading acceleration and telecommunications.

This is complemented by a surge in demand from the healthcare sector, where specialized deep learning accelerators are being integrated into medical devices for AI-powered diagnostics, fundamentally changing how clinical data is analyzed and interpreted while adhering to strict privacy mandates.

Key Industry Challenge: Exorbitant research, development, and fabrication costs for advanced process nodes represent a significant challenge to market growth and technological accessibility.

Significant challenges constrain the market's full potential, primarily stemming from economic and technological volatility. The exorbitant cost of custom silicon development and manufacturing at advanced nodes creates a high barrier to entry and inflates end-product prices.

This financial pressure is compounded by the rapid pace of algorithmic evolution; a processor optimized for today's models may be inefficient for tomorrow's generative AI workloads, leading to rapid technological obsolescence. Navigating this is further complicated by a fragmented and stringent regulatory landscape.

Companies must ensure their hardware and AI software ecosystem comply with diverse data privacy standards like GDPR in Europe and HIPAA in the US, adding significant complexity and cost to the design and validation of any hardware intended for decentralized data processing.

Explore Full Market Dynamics Analysis Request Free Sample

Neural Processor Market Segmentation

The neural processor industry research report provides comprehensive data including region-wise segment analysis, with forecasts and analysis for the period 2026-2030, as well as historical data from 2020-2024 for the following segments.

Market Segment by Deployment
  • Cloud based processing
  • Edge based processing
  • On device processing
Market Segment by End-user
  • Consumer electronics
  • Automotive
  • IT and telecom
  • Industrial automation
  • Healthcare
Market Segment by Application
  • Computer vision
  • Natural language processing
  • Autonomous systems
  • Speech recognition
Market Segment by Geography
North America
US, Canada, Mexico
APAC
China, Japan, India, South Korea, Australia, Indonesia
Europe
Germany, UK, France, Italy, Spain, The Netherlands
Middle East and Africa
UAE, Israel, Saudi Arabia, South Africa, Turkey
South America
Brazil, Argentina, Colombia

Deployment Segment Analysis

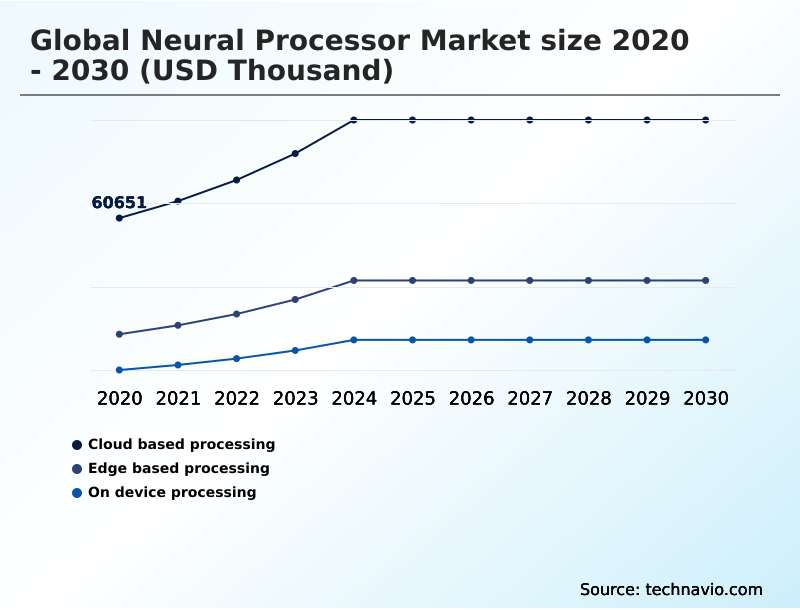
The cloud based processing segment is estimated to witness significant growth during the forecast period.

Cloud-based processing remains the dominant deployment segment, accounting for over 56% of the market, driven by the intense computational demands of training large-scale AI models.

Hyperscale data centers leverage vast arrays of AI training accelerators and tensor processing units to power their cloud AI services, enabling enterprises to execute complex generative AI workloads without massive upfront capital expenditure.

This centralization facilitates data center optimization and allows for the deployment of sophisticated predictive maintenance models. However, the reliance on remote hardware introduces latency, a critical consideration for real-time applications.

The architecture of these cloud deployments is engineered for maximum throughput, utilizing high-bandwidth memory integration and advanced packaging techniques to handle petabyte-scale datasets for deep learning tasks.

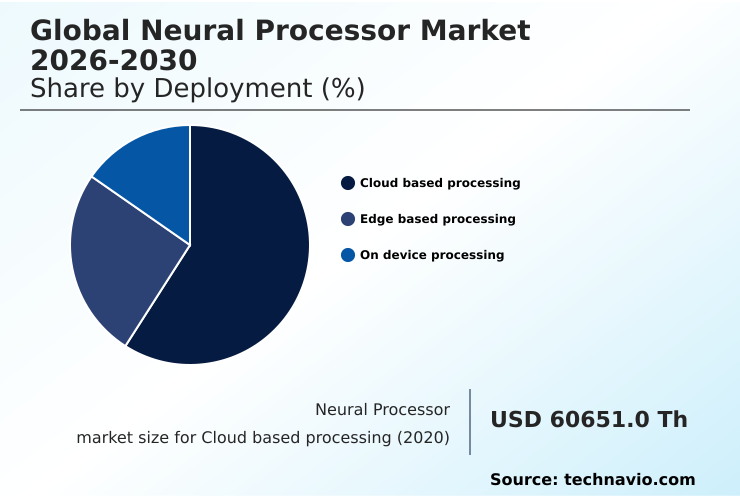
The Cloud based processing segment was valued at USD 89.65 million in 2024 and showed a gradual increase during the forecast period.

Neural Processor Market by Region: APAC Leads with 32.6% Growth Share

APAC is estimated to contribute 32.6% to the growth of the global market during the forecast period.

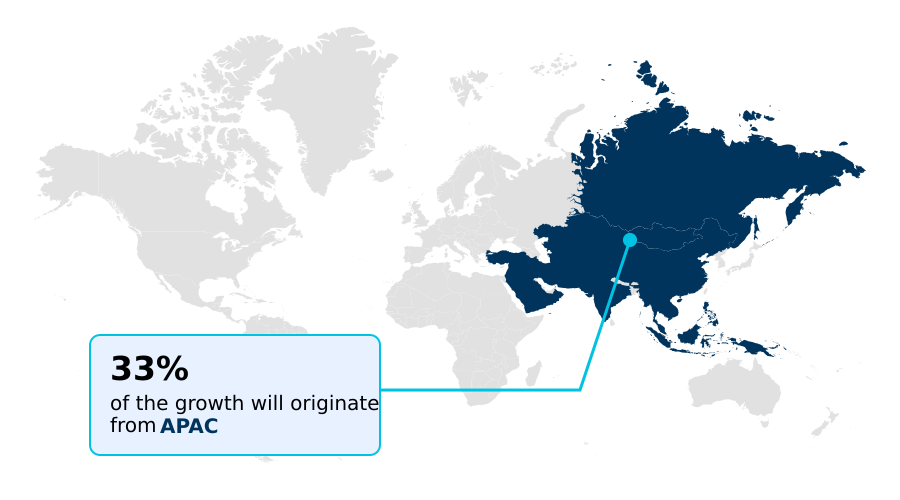
The geographic landscape of the neural processor market is characterized by a dual-centric structure, with North America leading in design and application while APAC dominates manufacturing and shows the fastest growth, projected at a CAGR of 21.8%.

North America's market, driven by hyperscale data centers and advanced research, focuses on custom silicon development for complex AI training accelerators.

In contrast, APAC's ecosystem is the hub for high-volume production of hardware for consumer electronics and automotive-grade silicon, essential for system on chip design. This regional specialization creates a complex global supply chain.

Emerging projects in the Middle East, such as smart city infrastructure, are creating new demand hotspots for edge AI hardware and IoT device integration, diversifying the market beyond its traditional strongholds and pushing innovation in energy-efficient computing.

Customer Landscape Analysis for the Neural Processor Market

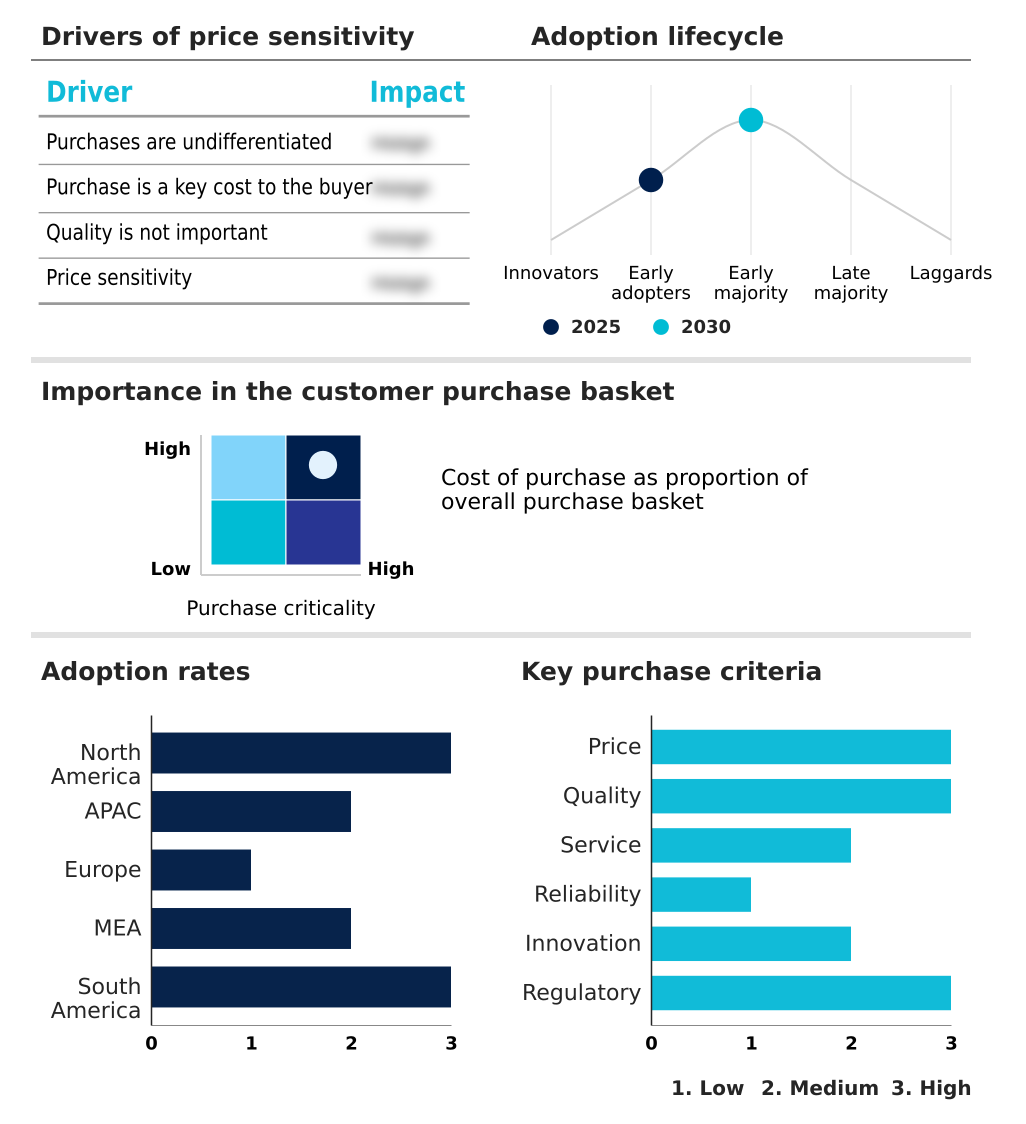
The neural processor market forecasting report includes the adoption lifecycle of the market, covering from the innovator’s stage to the laggard’s stage. It focuses on adoption rates in different regions based on penetration. Furthermore, the neural processor market report also includes key purchase criteria and drivers of price sensitivity to help companies evaluate and develop their market growth analysis strategies.

Competitive Landscape of the Neural Processor Market

Companies are implementing various strategies, such as strategic alliances, partnerships, mergers and acquisitions, geographical expansion, and product/service launches, to enhance their presence in the neural processor market industry.

Advanced Micro Devices Inc. - Key offerings include specialized silicon such as ASICs and SoCs designed to accelerate deep learning and machine learning workloads across cloud, edge, and on-device deployments.

The industry research and growth report includes detailed analyses of the competitive landscape of the market and information about key companies, including:

  • Advanced Micro Devices Inc.
  • Amazon.com Inc.
  • Apple Inc.
  • Arm Ltd.
  • Broadcom Inc.
  • Cerebras Systems Inc.
  • Google LLC
  • Groq Inc.
  • Hailo Technologies Ltd.
  • Huawei Technologies Co. Ltd.
  • Intel Corp.
  • Marvell Technology Inc.
  • MediaTek Inc.
  • Meta Platforms Inc.
  • Microsoft Corp.
  • NVIDIA Corp.
  • Qualcomm Inc.
  • SambaNova Systems Inc.
  • Samsung Electronics Co. Ltd.
  • Tenstorrent Inc.

Qualitative and quantitative analysis of companies has been conducted to help clients understand the wider business environment as well as the strengths and weaknesses of key industry players. Data is qualitatively analyzed to categorize companies as pure play, category-focused, industry-focused, and diversified; it is quantitatively analyzed to categorize companies as dominant, leading, strong, tentative, and weak.

Recent Developments in the Neural Processor Market

  • In January 2025, Advanced Micro Devices Inc. introduced its Ryzen AI 300 series processors, integrating the second-generation XDNA architecture to deliver over 50 TOPS of AI compute for AI-enabled laptops.
  • In January 2025, at the Consumer Electronics Show, Intel Corp. introduced its Core Ultra Series 3 processors, the first commercial platform built on its 18A process node, marking a major advancement in US-based semiconductor manufacturing.
  • In March 2025, Advanced Micro Devices Inc. expanded its strategic cooperation with South Korean AI lab Upstage to deploy Instinct MI355 GPUs, aiming to scale next-generation AI model training for sovereign AI initiatives.
  • In April 2025, Fujitsu Ltd. announced its plan to develop a next-generation AI processor based on an advanced 1.4-nanometer fabrication process, with manufacturing to be handled domestically by Rapidus to strengthen Japan's semiconductor independence.

Research Analyst Overview: Neural Processor Market

Boardroom decisions are increasingly focused on the strategic trade-offs between leveraging third-party cloud AI services and investing in proprietary custom silicon development. This choice is complicated by the high capital expenditure and specialized expertise required for creating application specific integrated circuits, which can offer significant performance-per-watt advantages for specific generative AI workloads.

While a wafer-scale engine provides unparalleled power for training foundational models, the risk of rapid algorithmic evolution can render such specialized hardware obsolete. Therefore, many organizations are adopting a hybrid strategy, utilizing reconfigurable dataflow unit architectures and flexible AI inference chip solutions for edge AI hardware deployments.

Compliance with data regulations like GDPR further influences architecture, favoring on-device AI processing to minimize data transfer. This complex decision matrix, balancing cost, performance, and regulatory risk, is the central challenge for enterprises aiming to maintain a competitive edge through hardware acceleration and advanced packaging techniques.

Dive into Technavio’s robust research methodology, blending expert interviews, extensive data synthesis, and validated models for unparalleled Neural Processor Market insights. See full methodology.

Request Free Sample

Market Scope
Page number 313
Base year 2025
Historic period 2020-2024
Forecast period 2026-2030
Growth momentum & CAGR Accelerate at a CAGR of 20.2%
Market growth 2026-2030 USD 272064.2 thousand
Market structure Fragmented
YoY growth 2025-2026(%) 16.8%
Key countries US, Canada, Mexico, China, Japan, India, South Korea, Australia, Indonesia, Germany, UK, France, Italy, Spain, The Netherlands, UAE, Israel, Saudi Arabia, South Africa, Turkey, Brazil, Argentina and Colombia
Competitive landscape Leading Companies, Market Positioning of Companies, Competitive Strategies, and Industry Risks

Neural Processor Market: Key Questions Answered in This Report

  • What is the expected growth of the Neural Processor Market between 2026 and 2030?

    • The Neural Processor Market is expected to grow by USD 272.06 million during 2026-2030, registering a CAGR of 20.2%. Year-over-year growth in 2026 is estimated at 16.8%%. This acceleration is shaped by escalating demand for edge computing capabilities, which is intensifying demand across multiple end-use verticals covered in the report.

  • What segmentation does the market report cover?

    • The report is segmented by Deployment (Cloud based processing, Edge based processing, and On device processing), End-user (Consumer electronics, Automotive, IT and telecom, Industrial automation, and Healthcare), Application (Computer vision, Natural language processing, Autonomous systems, and Speech recognition) and Geography (North America, APAC, Europe, Middle East and Africa, South America). Among these, the Cloud based processing segment is estimated to witness significant growth during the forecast period, driven by rising adoption across key application areas. Each segment includes detailed qualitative and quantitative analysis, along with historical data from 2020-2024 and forecasts through 2030 with year-over-year growth rates.

  • Which regions are analyzed in the report?

    • The report covers North America, APAC, Europe, Middle East and Africa and South America. APAC is estimated to contribute 32.6% to market growth during the forecast period. Country-level analysis includes US, Canada, Mexico, China, Japan, India, South Korea, Australia, Indonesia, Germany, UK, France, Italy, Spain, The Netherlands, UAE, Israel, Saudi Arabia, South Africa, Turkey, Brazil, Argentina and Colombia, with dedicated market size tables and year-over-year growth for each.

  • What are the key growth drivers and market challenges?

    • The primary driver is escalating demand for edge computing capabilities, which is accelerating investment and industry demand. The main challenge is exorbitant development and manufacturing costs, creating operational barriers for key market participants. The report quantifies the impact of each driver and challenge across 2026 and 2030 with comparative analysis.

  • Who are the major players in the Neural Processor Market?

    • Key vendors include Advanced Micro Devices Inc., Amazon.com Inc., Apple Inc., Arm Ltd., Broadcom Inc., Cerebras Systems Inc., Google LLC, Groq Inc., Hailo Technologies Ltd., Huawei Technologies Co. Ltd., Intel Corp., Marvell Technology Inc., MediaTek Inc., Meta Platforms Inc., Microsoft Corp., NVIDIA Corp., Qualcomm Inc., SambaNova Systems Inc., Samsung Electronics Co. Ltd. and Tenstorrent Inc.. The report provides qualitative and quantitative analysis categorizing companies as dominant, leading, strong, tentative, and weak based on their market positioning. Company profiles include business segment analysis, SWOT assessment, key offerings, and recent strategic developments.

Neural Processor Market Research Insights

Market dynamics are increasingly shaped by the architectural trade-offs between centralized cloud deployments and decentralized edge AI hardware. While cloud-based processing constitutes the largest market segment, the imperative for real-time data interpretation in applications like industrial robotics and autonomous systems navigation is fueling growth in edge and on-device AI processing.

This shift is compounded by stringent data sovereignty and privacy regulations, such as the GDPR in Europe, which mandate that sensitive personal information be handled locally. Consequently, industries like healthcare are investing in on-premise AI-powered diagnostics that rely on localized deep learning accelerators.

This trend forces a re-evaluation of data center optimization strategies, balancing the raw power of the cloud with the security and responsiveness of localized heterogeneous computing architecture.

We can help! Our analysts can customize this neural processor market research report to meet your requirements.

Get in touch

1. Executive Summary

1.1 Market overview

Executive Summary - Chart on Market Overview
Executive Summary - Data Table on Market Overview
Executive Summary - Chart on Global Market Characteristics
Executive Summary - Chart on Market by Geography
Executive Summary - Chart on Market Segmentation by Deployment
Executive Summary - Chart on Market Segmentation by End-user
Executive Summary - Chart on Market Segmentation by Application
Executive Summary - Chart on Incremental Growth
Executive Summary - Data Table on Incremental Growth
Executive Summary - Chart on Company Market Positioning

2. Technavio Analysis

2.1 Analysis of price sensitivity, lifecycle, customer purchase basket, adoption rates, and purchase criteria

2.2 Criticality of inputs and Factors of differentiation

Chart on Overview on criticality of inputs and factors of differentiation

2.3 Factors of disruption

Chart on Overview on factors of disruption

2.4 Impact of drivers and challenges

Chart on Impact of drivers and challenges in 2025 and 2030

3. Market Landscape

3.1 Market ecosystem

Chart on Parent Market
Data Table on - Parent Market

3.2 Market characteristics

Chart on Market characteristics analysis

3.3 Value chain analysis

Chart on Value chain analysis

4. Market Sizing

4.1 Market definition

Data Table on Offerings of companies included in the market definition

4.2 Market segment analysis

Market segments

4.3 Market size 2025

4.4 Market outlook: Forecast for 2025-2030

Chart on Global - Market size and forecast 2025-2030 ($ thousand)
Data Table on Global - Market size and forecast 2025-2030 ($ thousand)
Chart on Global Market: Year-over-year growth 2025-2030 (%)
Data Table on Global Market: Year-over-year growth 2025-2030 (%)

5. Historic Market Size

5.1 Global Neural Processor Market 2020 - 2024

Historic Market Size - Data Table on Global Neural Processor Market 2020 - 2024 ($ thousand)

5.2 Deployment segment analysis 2020 - 2024

Historic Market Size - Deployment Segment 2020 - 2024 ($ thousand)

5.3 End-user segment analysis 2020 - 2024

Historic Market Size - End-user Segment 2020 - 2024 ($ thousand)

5.4 Application segment analysis 2020 - 2024

Historic Market Size - Application Segment 2020 - 2024 ($ thousand)

5.5 Geography segment analysis 2020 - 2024

Historic Market Size - Geography Segment 2020 - 2024 ($ thousand)

5.6 Country segment analysis 2020 - 2024

Historic Market Size - Country Segment 2020 - 2024 ($ thousand)

6. Qualitative Analysis

6.1 Impact of AI on Global Neural Processor Market

6.2 Impact of Geopolitical Conflicts on Global Neural Processor Market

7. Five Forces Analysis

7.1 Five forces summary

Five forces analysis - Comparison between 2025 and 2030

7.2 Bargaining power of buyers

Bargaining power of buyers - Impact of key factors 2025 and 2030

7.3 Bargaining power of suppliers

Bargaining power of suppliers - Impact of key factors in 2025 and 2030

7.4 Threat of new entrants

Threat of new entrants - Impact of key factors in 2025 and 2030

7.5 Threat of substitutes

Threat of substitutes - Impact of key factors in 2025 and 2030

7.6 Threat of rivalry

Threat of rivalry - Impact of key factors in 2025 and 2030

7.7 Market condition

Chart on Market condition - Five forces 2025 and 2030

8. Market Segmentation by Deployment

8.1 Market segments

Chart on Deployment - Market share 2025-2030 (%)
Data Table on Deployment - Market share 2025-2030 (%)

8.2 Comparison by Deployment

Chart on Comparison by Deployment
Data Table on Comparison by Deployment

8.3 Cloud based processing - Market size and forecast 2025-2030

Chart on Cloud based processing - Market size and forecast 2025-2030 ($ thousand)
Data Table on Cloud based processing - Market size and forecast 2025-2030 ($ thousand)
Chart on Cloud based processing - Year-over-year growth 2025-2030 (%)
Data Table on Cloud based processing - Year-over-year growth 2025-2030 (%)

8.4 Edge based processing - Market size and forecast 2025-2030

Chart on Edge based processing - Market size and forecast 2025-2030 ($ thousand)
Data Table on Edge based processing - Market size and forecast 2025-2030 ($ thousand)
Chart on Edge based processing - Year-over-year growth 2025-2030 (%)
Data Table on Edge based processing - Year-over-year growth 2025-2030 (%)

8.5 On device processing - Market size and forecast 2025-2030

Chart on On device processing - Market size and forecast 2025-2030 ($ thousand)
Data Table on On device processing - Market size and forecast 2025-2030 ($ thousand)
Chart on On device processing - Year-over-year growth 2025-2030 (%)
Data Table on On device processing - Year-over-year growth 2025-2030 (%)

8.6 Market opportunity by Deployment

Market opportunity by Deployment ($ thousand)
Data Table on Market opportunity by Deployment ($ thousand)

9. Market Segmentation by End-user

9.1 Market segments

Chart on End-user - Market share 2025-2030 (%)
Data Table on End-user - Market share 2025-2030 (%)

9.2 Comparison by End-user

Chart on Comparison by End-user
Data Table on Comparison by End-user

9.3 Consumer electronics - Market size and forecast 2025-2030

Chart on Consumer electronics - Market size and forecast 2025-2030 ($ thousand)
Data Table on Consumer electronics - Market size and forecast 2025-2030 ($ thousand)
Chart on Consumer electronics - Year-over-year growth 2025-2030 (%)
Data Table on Consumer electronics - Year-over-year growth 2025-2030 (%)

9.4 Automotive - Market size and forecast 2025-2030

Chart on Automotive - Market size and forecast 2025-2030 ($ thousand)
Data Table on Automotive - Market size and forecast 2025-2030 ($ thousand)
Chart on Automotive - Year-over-year growth 2025-2030 (%)
Data Table on Automotive - Year-over-year growth 2025-2030 (%)

9.5 IT and telecom - Market size and forecast 2025-2030

Chart on IT and telecom - Market size and forecast 2025-2030 ($ thousand)
Data Table on IT and telecom - Market size and forecast 2025-2030 ($ thousand)
Chart on IT and telecom - Year-over-year growth 2025-2030 (%)
Data Table on IT and telecom - Year-over-year growth 2025-2030 (%)

9.6 Industrial automation - Market size and forecast 2025-2030

Chart on Industrial automation - Market size and forecast 2025-2030 ($ thousand)
Data Table on Industrial automation - Market size and forecast 2025-2030 ($ thousand)
Chart on Industrial automation - Year-over-year growth 2025-2030 (%)
Data Table on Industrial automation - Year-over-year growth 2025-2030 (%)

9.7 Healthcare - Market size and forecast 2025-2030

Chart on Healthcare - Market size and forecast 2025-2030 ($ thousand)
Data Table on Healthcare - Market size and forecast 2025-2030 ($ thousand)
Chart on Healthcare - Year-over-year growth 2025-2030 (%)
Data Table on Healthcare - Year-over-year growth 2025-2030 (%)

9.8 Market opportunity by End-user

Market opportunity by End-user ($ thousand)
Data Table on Market opportunity by End-user ($ thousand)

10. Market Segmentation by Application

10.1 Market segments

Chart on Application - Market share 2025-2030 (%)
Data Table on Application - Market share 2025-2030 (%)

10.2 Comparison by Application

Chart on Comparison by Application
Data Table on Comparison by Application

10.3 Computer vision - Market size and forecast 2025-2030

Chart on Computer vision - Market size and forecast 2025-2030 ($ thousand)
Data Table on Computer vision - Market size and forecast 2025-2030 ($ thousand)
Chart on Computer vision - Year-over-year growth 2025-2030 (%)
Data Table on Computer vision - Year-over-year growth 2025-2030 (%)

10.4 Natural language processing - Market size and forecast 2025-2030

Chart on Natural language processing - Market size and forecast 2025-2030 ($ thousand)
Data Table on Natural language processing - Market size and forecast 2025-2030 ($ thousand)
Chart on Natural language processing - Year-over-year growth 2025-2030 (%)
Data Table on Natural language processing - Year-over-year growth 2025-2030 (%)

10.5 Autonomous systems - Market size and forecast 2025-2030

Chart on Autonomous systems - Market size and forecast 2025-2030 ($ thousand)
Data Table on Autonomous systems - Market size and forecast 2025-2030 ($ thousand)
Chart on Autonomous systems - Year-over-year growth 2025-2030 (%)
Data Table on Autonomous systems - Year-over-year growth 2025-2030 (%)

10.6 Speech recognition - Market size and forecast 2025-2030

Chart on Speech recognition - Market size and forecast 2025-2030 ($ thousand)
Data Table on Speech recognition - Market size and forecast 2025-2030 ($ thousand)
Chart on Speech recognition - Year-over-year growth 2025-2030 (%)
Data Table on Speech recognition - Year-over-year growth 2025-2030 (%)

10.7 Market opportunity by Application

Market opportunity by Application ($ thousand)
Data Table on Market opportunity by Application ($ thousand)

11. Customer Landscape

11.1 Customer landscape overview

Analysis of price sensitivity, lifecycle, customer purchase basket, adoption rates, and purchase criteria

12. Geographic Landscape

12.1 Geographic segmentation

Chart on Market share by geography 2025-2030 (%)
Data Table on Market share by geography 2025-2030 (%)

12.2 Geographic comparison

Chart on Geographic comparison
Data Table on Geographic comparison

12.3 North America - Market size and forecast 2025-2030

Chart on North America - Market size and forecast 2025-2030 ($ thousand)
Data Table on North America - Market size and forecast 2025-2030 ($ thousand)
Chart on North America - Year-over-year growth 2025-2030 (%)
Data Table on North America - Year-over-year growth 2025-2030 (%)
Chart on Regional Comparison - North America
Data Table on Regional Comparison - North America

12.3.1 US - Market size and forecast 2025-2030

Chart on US - Market size and forecast 2025-2030 ($ thousand)
Data Table on US - Market size and forecast 2025-2030 ($ thousand)
Chart on US - Year-over-year growth 2025-2030 (%)
Data Table on US - Year-over-year growth 2025-2030 (%)

12.3.2 Canada - Market size and forecast 2025-2030

Chart on Canada - Market size and forecast 2025-2030 ($ thousand)
Data Table on Canada - Market size and forecast 2025-2030 ($ thousand)
Chart on Canada - Year-over-year growth 2025-2030 (%)
Data Table on Canada - Year-over-year growth 2025-2030 (%)

12.3.3 Mexico - Market size and forecast 2025-2030

Chart on Mexico - Market size and forecast 2025-2030 ($ thousand)
Data Table on Mexico - Market size and forecast 2025-2030 ($ thousand)
Chart on Mexico - Year-over-year growth 2025-2030 (%)
Data Table on Mexico - Year-over-year growth 2025-2030 (%)

12.4 APAC - Market size and forecast 2025-2030

Chart on APAC - Market size and forecast 2025-2030 ($ thousand)
Data Table on APAC - Market size and forecast 2025-2030 ($ thousand)
Chart on APAC - Year-over-year growth 2025-2030 (%)
Data Table on APAC - Year-over-year growth 2025-2030 (%)
Chart on Regional Comparison - APAC
Data Table on Regional Comparison - APAC

12.4.1 China - Market size and forecast 2025-2030

Chart on China - Market size and forecast 2025-2030 ($ thousand)
Data Table on China - Market size and forecast 2025-2030 ($ thousand)
Chart on China - Year-over-year growth 2025-2030 (%)
Data Table on China - Year-over-year growth 2025-2030 (%)

12.4.2 Japan - Market size and forecast 2025-2030

Chart on Japan - Market size and forecast 2025-2030 ($ thousand)
Data Table on Japan - Market size and forecast 2025-2030 ($ thousand)
Chart on Japan - Year-over-year growth 2025-2030 (%)
Data Table on Japan - Year-over-year growth 2025-2030 (%)

12.4.3 India - Market size and forecast 2025-2030

Chart on India - Market size and forecast 2025-2030 ($ thousand)
Data Table on India - Market size and forecast 2025-2030 ($ thousand)
Chart on India - Year-over-year growth 2025-2030 (%)
Data Table on India - Year-over-year growth 2025-2030 (%)

12.4.4 South Korea - Market size and forecast 2025-2030

Chart on South Korea - Market size and forecast 2025-2030 ($ thousand)
Data Table on South Korea - Market size and forecast 2025-2030 ($ thousand)
Chart on South Korea - Year-over-year growth 2025-2030 (%)
Data Table on South Korea - Year-over-year growth 2025-2030 (%)

12.4.5 Australia - Market size and forecast 2025-2030

Chart on Australia - Market size and forecast 2025-2030 ($ thousand)
Data Table on Australia - Market size and forecast 2025-2030 ($ thousand)
Chart on Australia - Year-over-year growth 2025-2030 (%)
Data Table on Australia - Year-over-year growth 2025-2030 (%)

12.4.6 Indonesia - Market size and forecast 2025-2030

Chart on Indonesia - Market size and forecast 2025-2030 ($ thousand)
Data Table on Indonesia - Market size and forecast 2025-2030 ($ thousand)
Chart on Indonesia - Year-over-year growth 2025-2030 (%)
Data Table on Indonesia - Year-over-year growth 2025-2030 (%)

12.5 Europe - Market size and forecast 2025-2030

Chart on Europe - Market size and forecast 2025-2030 ($ thousand)
Data Table on Europe - Market size and forecast 2025-2030 ($ thousand)
Chart on Europe - Year-over-year growth 2025-2030 (%)
Data Table on Europe - Year-over-year growth 2025-2030 (%)
Chart on Regional Comparison - Europe
Data Table on Regional Comparison - Europe

12.5.1 Germany - Market size and forecast 2025-2030

Chart on Germany - Market size and forecast 2025-2030 ($ thousand)
Data Table on Germany - Market size and forecast 2025-2030 ($ thousand)
Chart on Germany - Year-over-year growth 2025-2030 (%)
Data Table on Germany - Year-over-year growth 2025-2030 (%)

12.5.2 UK - Market size and forecast 2025-2030

Chart on UK - Market size and forecast 2025-2030 ($ thousand)
Data Table on UK - Market size and forecast 2025-2030 ($ thousand)
Chart on UK - Year-over-year growth 2025-2030 (%)
Data Table on UK - Year-over-year growth 2025-2030 (%)

12.5.3 France - Market size and forecast 2025-2030

Chart on France - Market size and forecast 2025-2030 ($ thousand)
Data Table on France - Market size and forecast 2025-2030 ($ thousand)
Chart on France - Year-over-year growth 2025-2030 (%)
Data Table on France - Year-over-year growth 2025-2030 (%)

12.5.4 Italy - Market size and forecast 2025-2030

Chart on Italy - Market size and forecast 2025-2030 ($ thousand)
Data Table on Italy - Market size and forecast 2025-2030 ($ thousand)
Chart on Italy - Year-over-year growth 2025-2030 (%)
Data Table on Italy - Year-over-year growth 2025-2030 (%)

12.5.5 Spain - Market size and forecast 2025-2030

Chart on Spain - Market size and forecast 2025-2030 ($ thousand)
Data Table on Spain - Market size and forecast 2025-2030 ($ thousand)
Chart on Spain - Year-over-year growth 2025-2030 (%)
Data Table on Spain - Year-over-year growth 2025-2030 (%)

12.5.6 The Netherlands - Market size and forecast 2025-2030

Chart on The Netherlands - Market size and forecast 2025-2030 ($ thousand)
Data Table on The Netherlands - Market size and forecast 2025-2030 ($ thousand)
Chart on The Netherlands - Year-over-year growth 2025-2030 (%)
Data Table on The Netherlands - Year-over-year growth 2025-2030 (%)

12.6 Middle East and Africa - Market size and forecast 2025-2030

Chart on Middle East and Africa - Market size and forecast 2025-2030 ($ thousand)
Data Table on Middle East and Africa - Market size and forecast 2025-2030 ($ thousand)
Chart on Middle East and Africa - Year-over-year growth 2025-2030 (%)
Data Table on Middle East and Africa - Year-over-year growth 2025-2030 (%)
Chart on Regional Comparison - Middle East and Africa
Data Table on Regional Comparison - Middle East and Africa

12.6.1 UAE - Market size and forecast 2025-2030

Chart on UAE - Market size and forecast 2025-2030 ($ thousand)
Data Table on UAE - Market size and forecast 2025-2030 ($ thousand)
Chart on UAE - Year-over-year growth 2025-2030 (%)
Data Table on UAE - Year-over-year growth 2025-2030 (%)

12.6.2 Israel - Market size and forecast 2025-2030

Chart on Israel - Market size and forecast 2025-2030 ($ thousand)
Data Table on Israel - Market size and forecast 2025-2030 ($ thousand)
Chart on Israel - Year-over-year growth 2025-2030 (%)
Data Table on Israel - Year-over-year growth 2025-2030 (%)

12.6.3 Saudi Arabia - Market size and forecast 2025-2030

Chart on Saudi Arabia - Market size and forecast 2025-2030 ($ thousand)
Data Table on Saudi Arabia - Market size and forecast 2025-2030 ($ thousand)
Chart on Saudi Arabia - Year-over-year growth 2025-2030 (%)
Data Table on Saudi Arabia - Year-over-year growth 2025-2030 (%)

12.6.4 South Africa - Market size and forecast 2025-2030

Chart on South Africa - Market size and forecast 2025-2030 ($ thousand)
Data Table on South Africa - Market size and forecast 2025-2030 ($ thousand)
Chart on South Africa - Year-over-year growth 2025-2030 (%)
Data Table on South Africa - Year-over-year growth 2025-2030 (%)

12.6.5 Turkey - Market size and forecast 2025-2030

Chart on Turkey - Market size and forecast 2025-2030 ($ thousand)
Data Table on Turkey - Market size and forecast 2025-2030 ($ thousand)
Chart on Turkey - Year-over-year growth 2025-2030 (%)
Data Table on Turkey - Year-over-year growth 2025-2030 (%)

12.7 South America - Market size and forecast 2025-2030

Chart on South America - Market size and forecast 2025-2030 ($ thousand)
Data Table on South America - Market size and forecast 2025-2030 ($ thousand)
Chart on South America - Year-over-year growth 2025-2030 (%)
Data Table on South America - Year-over-year growth 2025-2030 (%)
Chart on Regional Comparison - South America
Data Table on Regional Comparison - South America

12.7.1 Brazil - Market size and forecast 2025-2030

Chart on Brazil - Market size and forecast 2025-2030 ($ thousand)
Data Table on Brazil - Market size and forecast 2025-2030 ($ thousand)
Chart on Brazil - Year-over-year growth 2025-2030 (%)
Data Table on Brazil - Year-over-year growth 2025-2030 (%)

12.7.2 Argentina - Market size and forecast 2025-2030

Chart on Argentina - Market size and forecast 2025-2030 ($ thousand)
Data Table on Argentina - Market size and forecast 2025-2030 ($ thousand)
Chart on Argentina - Year-over-year growth 2025-2030 (%)
Data Table on Argentina - Year-over-year growth 2025-2030 (%)

12.7.3 Colombia - Market size and forecast 2025-2030

Chart on Colombia - Market size and forecast 2025-2030 ($ thousand)
Data Table on Colombia - Market size and forecast 2025-2030 ($ thousand)
Chart on Colombia - Year-over-year growth 2025-2030 (%)
Data Table on Colombia - Year-over-year growth 2025-2030 (%)

12.8 Market opportunity by geography

Market opportunity by geography ($ thousand)
Data Tables on Market opportunity by geography ($ thousand)

13. Drivers, Challenges, and Opportunity

13.1 Market drivers

Escalating demand for edge computing capabilities
Proliferation of AI in consumer electronics
Rapid integration of autonomous systems in various industries

13.2 Market challenges

Exorbitant development and manufacturing costs
Rapid technological obsolescence and algorithm evolution
Stringent regulatory compliance and data privacy standards

13.3 Impact of drivers and challenges

Impact of drivers and challenges in 2025 and 2030

13.4 Market opportunities

Accelerated adoption of neuromorphic engineering and energy proportional architectures
Deployment of neural processors in advanced healthcare diagnostics
Emergence of photonic neural networks and optical interconnects

14. Competitive Landscape

14.1 Overview

14.2

Overview on criticality of inputs and factors of differentiation

14.3 Landscape disruption

Overview on factors of disruption

14.4 Industry risks

Impact of key risks on business

15. Competitive Analysis

15.1 Companies profiled

Companies covered

15.2 Company ranking index

15.3 Market positioning of companies

Matrix on companies position and classification

15.4 Advanced Micro Devices Inc.

Advanced Micro Devices Inc. - Overview
Advanced Micro Devices Inc. - Business segments
Advanced Micro Devices Inc. - Key news
Advanced Micro Devices Inc. - Key offerings
Advanced Micro Devices Inc. - Segment focus
SWOT

15.5 Amazon.com Inc.

Amazon.com Inc. - Overview
Amazon.com Inc. - Business segments
Amazon.com Inc. - Key news
Amazon.com Inc. - Key offerings
Amazon.com Inc. - Segment focus
SWOT

15.6 Apple Inc.

Apple Inc. - Overview
Apple Inc. - Business segments
Apple Inc. - Key news
Apple Inc. - Key offerings
Apple Inc. - Segment focus
SWOT

15.7 Arm Ltd.

Arm Ltd. - Overview
Arm Ltd. - Product / Service
Arm Ltd. - Key offerings
SWOT

15.8 Broadcom Inc.

Broadcom Inc. - Overview
Broadcom Inc. - Business segments
Broadcom Inc. - Key offerings
Broadcom Inc. - Segment focus
SWOT

15.9 Cerebras Systems Inc.

Cerebras Systems Inc. - Overview
Cerebras Systems Inc. - Product / Service
Cerebras Systems Inc. - Key offerings
SWOT

15.10 Google LLC

Google LLC - Overview
Google LLC - Product / Service
Google LLC - Key offerings
SWOT

15.11 Groq Inc.

Groq Inc. - Overview
Groq Inc. - Product / Service
Groq Inc. - Key offerings
SWOT

15.12 Huawei Technologies Co. Ltd.

Huawei Technologies Co. Ltd. - Overview
Huawei Technologies Co. Ltd. - Product / Service
Huawei Technologies Co. Ltd. - Key offerings
SWOT

15.13 Intel Corp.

Intel Corp. - Overview
Intel Corp. - Business segments
Intel Corp. - Key news
Intel Corp. - Key offerings
Intel Corp. - Segment focus
SWOT

15.14 Meta Platforms Inc.

Meta Platforms Inc. - Overview
Meta Platforms Inc. - Business segments
Meta Platforms Inc. - Key offerings
Meta Platforms Inc. - Segment focus
SWOT

15.15 Microsoft Corp.

Microsoft Corp. - Overview
Microsoft Corp. - Business segments
Microsoft Corp. - Key news
Microsoft Corp. - Key offerings
Microsoft Corp. - Segment focus
SWOT

15.16 NVIDIA Corp.

NVIDIA Corp. - Overview
NVIDIA Corp. - Business segments
NVIDIA Corp. - Key news
NVIDIA Corp. - Key offerings
NVIDIA Corp. - Segment focus
SWOT

15.17 Qualcomm Inc.

Qualcomm Inc. - Overview
Qualcomm Inc. - Business segments
Qualcomm Inc. - Key news
Qualcomm Inc. - Key offerings
Qualcomm Inc. - Segment focus
SWOT

15.18 Samsung Electronics Co. Ltd.

Samsung Electronics Co. Ltd. - Overview
Samsung Electronics Co. Ltd. - Business segments
Samsung Electronics Co. Ltd. - Key news
Samsung Electronics Co. Ltd. - Key offerings
Samsung Electronics Co. Ltd. - Segment focus
SWOT

16. Appendix

16.1 Scope of the report

Market definition
Objectives
Notes and caveats

16.2 Inclusions and exclusions checklist

Inclusions checklist
Exclusions checklist

16.3 Currency conversion rates for US$

16.4 Research methodology

16.5 Data procurement

Information sources

16.6 Data validation

16.7 Validation techniques employed for market sizing

16.8 Data synthesis

16.9 360 degree market analysis

16.10 List of abbreviations

Research Methodology

Technavio presents a detailed picture of the market by way of study, synthesis, and summation of data from multiple sources. The analysts have presented the various facets of the market with a particular focus on identifying the key industry influencers. The data thus presented is comprehensive, reliable, and the result of extensive research, both primary and secondary.

INFORMATION SOURCES

Primary sources

  • Manufacturers and suppliers
  • Channel partners
  • Industry experts
  • Strategic decision makers

Secondary sources

  • Industry journals and periodicals
  • Government data
  • Financial reports of key industry players
  • Historical data
  • Press releases

DATA ANALYSIS

Data Synthesis

  • Collation of data
  • Estimation of key figures
  • Analysis of derived insights

Data Validation

  • Triangulation with data models
  • Reference against proprietary databases
  • Corroboration with industry experts

REPORT WRITING

Qualitative

  • Market drivers
  • Market challenges
  • Market trends
  • Five forces analysis

Quantitative

  • Market size and forecast
  • Market segmentation
  • Geographical insights
  • Competitive landscape

Interested in this report?

Get your sample now to see our research methodology and insights!

Download Now

Frequently Asked Questions

Neural Processor market growth will increase by USD 272064.2 thousand thousand during 2026-2030.

The Neural Processor market is expected to grow at a CAGR of 20.2% during 2026-2030.

Neural Processor market is segmented by Deployment (Cloud based processing, Edge based processing, On device processing) End-user (Consumer electronics, Automotive, IT and telecom, Industrial automation, Healthcare) Application (Computer vision, Natural language processing, Autonomous systems, Speech recognition)

Advanced Micro Devices Inc., Amazon.com Inc., Apple Inc., Arm Ltd., Broadcom Inc., Cerebras Systems Inc., Google LLC, Groq Inc., Hailo Technologies Ltd., Huawei Technologies Co. Ltd., Intel Corp., Marvell Technology Inc., MediaTek Inc., Meta Platforms Inc., Microsoft Corp., NVIDIA Corp., Qualcomm Inc., SambaNova Systems Inc., Samsung Electronics Co. Ltd., Tenstorrent Inc. are a few of the key vendors in the Neural Processor market.

APAC will register the highest growth rate of 32.6% among the other regions. Therefore, the Neural Processor market in APAC is expected to garner significant business opportunities for the vendors during the forecast period.

US, Canada, Mexico, China, Japan, India, South Korea, Australia, Indonesia, Germany, UK, France, Italy, Spain, The Netherlands, UAE, Israel, Saudi Arabia, South Africa, Turkey, Brazil, Argentina, Colombia

  • Escalating demand for edge computing capabilities is the driving factor this market.

The Neural Processor market vendors should focus on grabbing business opportunities from the Deployment segment as it accounted for the largest market share in the base year.
RIA - Research AI Assistant
Ask RIA