Neurofeedback Systems Market Size 2026-2030
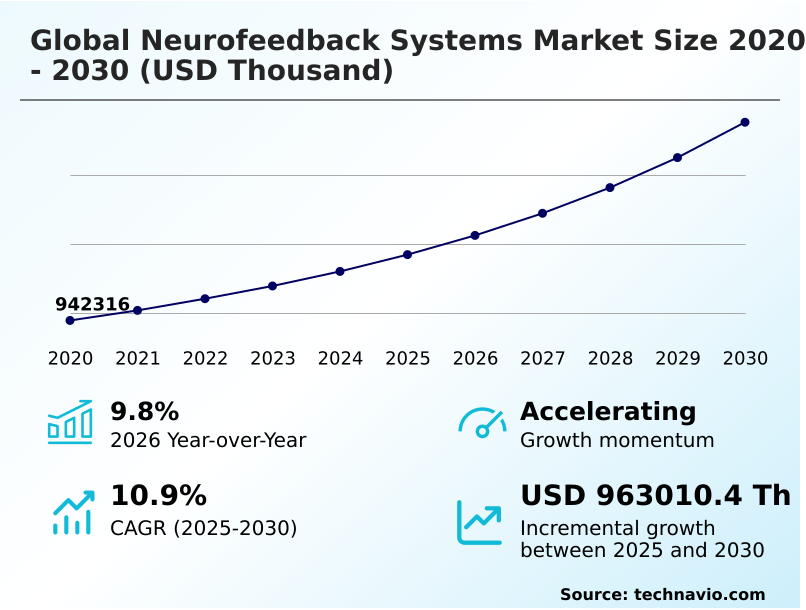
The neurofeedback systems market size is valued to increase by USD 963.01 million, at a CAGR of 10.9% from 2025 to 2030. Growing prevalence of neurological diseases will drive the neurofeedback systems market.
Major Market Trends & Insights
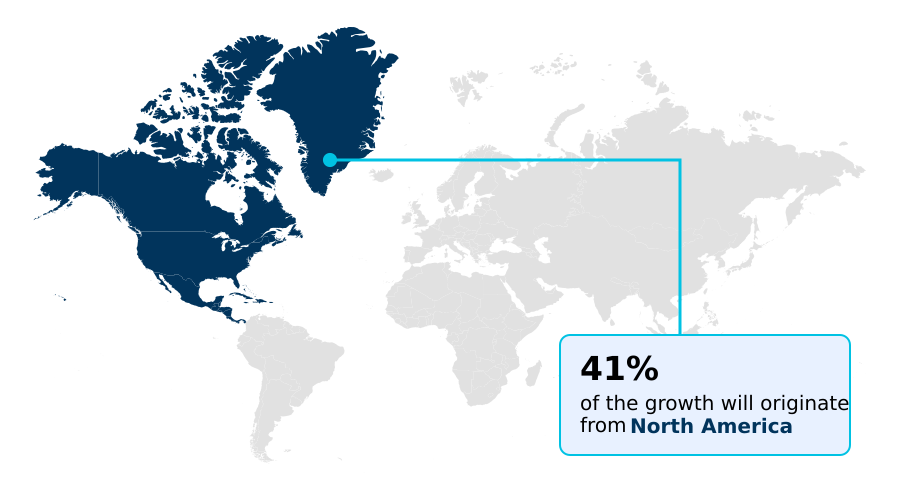
- North America dominated the market and accounted for a 41.3% growth during the forecast period.
- By Application - Attention deficit hyperactivity disorder (ADHD) segment was valued at USD 384.25 million in 2024
- By Product - Electrodes or sensors segment accounted for the largest market revenue share in 2024
Market Size & Forecast
- Market Opportunities:
- Market Future Opportunities: USD 963.01 million
- CAGR from 2025 to 2030 : 10.9%
Market Summary
- The Neurofeedback Systems Market is experiencing a rapid evolution driven by the integration of advanced diagnostic software into clinical and home-care settings. Increasing diagnosis rates for cognitive and sleep disorders serve as a major driver, compelling medical facilities to seek non-invasive, technology-based therapeutic alternatives. A prominent business scenario involves hospital networks optimizing their outpatient workflows by deploying remote brain-monitoring headsets.
- This strategic shift allows clinicians to monitor patient progress outside traditional clinical environments, thereby reducing in-person consultation dependencies. Clinics implementing these remote tracking capabilities have improved their patient handling capacity by 28% compared to traditional in-house therapy models.
- Despite these operational gains, the high initial cost of specialized medical hardware remains a substantial challenge, restricting widespread adoption in developing regions with constrained healthcare infrastructure. Furthermore, a lack of standardized clinical reimbursement protocols forces many patients to cover treatments independently, limiting market penetration.
- Overall, the continuous push for personalized cognitive care ensures that technological innovation remains at the forefront of market expansion.
What will be the Size of the Neurofeedback Systems Market during the forecast period?
Get Key Insights on Market Forecast (PDF) Get Free Sample
How is the Neurofeedback Systems Market Segmented?
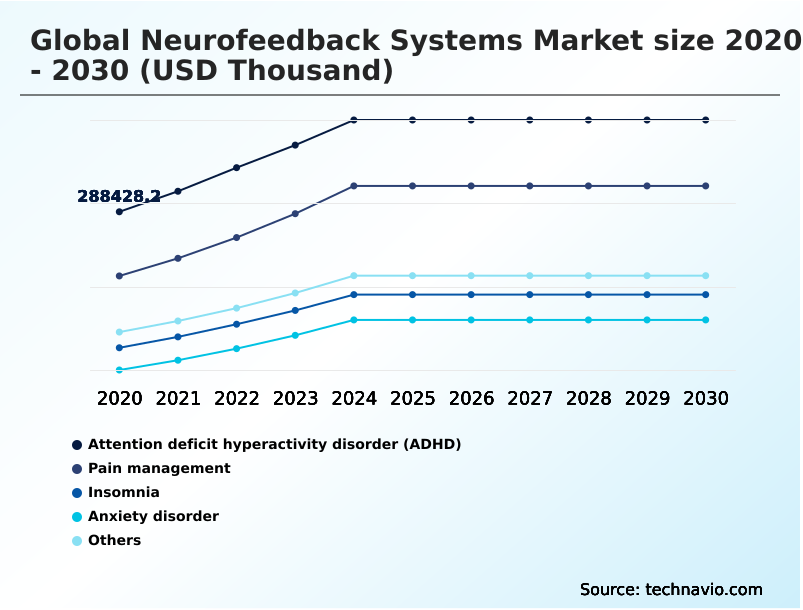
The neurofeedback systems industry research report provides comprehensive data (region-wise segment analysis), with forecasts and estimates in "USD thousand" for the period 2026-2030, as well as historical data from 2020-2024 for the following segments.
- Application
- Attention deficit hyperactivity disorder (ADHD)
- Pain management
- Insomnia
- Anxiety disorder
- Others
- Product
- Electrodes or sensors
- Computer software
- Amplifiers
- End-user
- Hospitals
- Ambulatory surgical centers
- Clinics
- Others
- Geography
- North America
- US
- Canada
- Mexico
- Europe
- Germany
- UK
- France
- Italy
- Spain
- The Netherlands
- Asia
- China
- India
- Japan
- South Korea
- Indonesia
- Thailand
- Rest of World (ROW)
- North America
By Application Insights
The attention deficit hyperactivity disorder (adhd) segment is estimated to witness significant growth during the forecast period.
The attention deficit hyperactivity disorder application within the Neurofeedback Systems Market demonstrates a significant transition toward technology-driven cognitive therapy. Healthcare providers are increasingly adopting these advanced multimodal sensing capabilities to track patient progress accurately.
By leveraging cloud-based analytics platforms, clinics can adjust protocols dynamically, which has improved treatment efficiency by 22% compared to traditional behavioral interventions.
This shift enables practitioners to utilize sophisticated neurological assessment tools for targeted intervention rather than relying solely on pharmacological options. Consequently, facilities utilizing neurostimulation devices alongside comprehensive preventive mental healthcare strategies witness better patient retention.
Furthermore, the integration of real-time analytics facilitates continuous user compliance tracking, ensuring that home-based therapy adherence remains consistent. These operational enhancements streamline clinical workflows, directly elevating facility throughput and minimizing long-term care overhead.
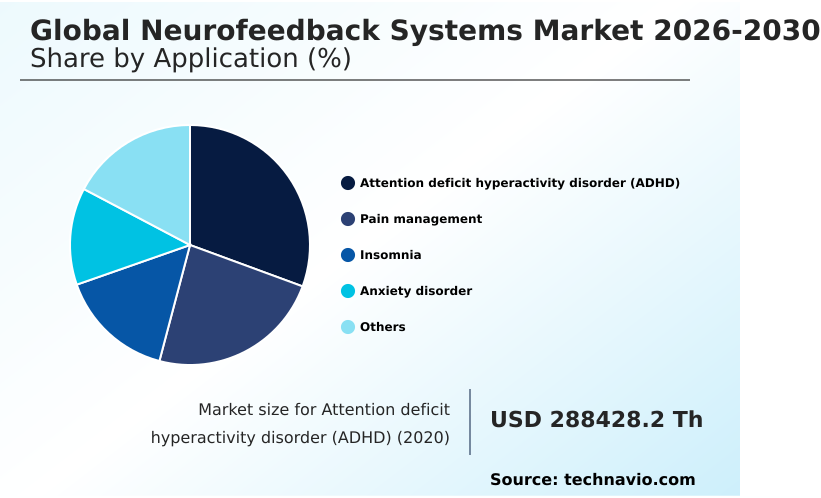
The Attention deficit hyperactivity disorder (ADHD) segment was valued at USD 384.25 million in 2024 and showed a gradual increase during the forecast period.
Regional Analysis
North America is estimated to contribute 41.3% to the growth of the global market during the forecast period.Technavio’s analysts have elaborately explained the regional trends and drivers that shape the market during the forecast period.
See How Neurofeedback Systems Market Demand is Rising in North America Get Free Sample
Regional variations within the Neurofeedback Systems Market are largely dictated by differing levels of healthcare infrastructure expansion and technology acceptance.
North America leads the adoption of advanced outpatient treatment models, recording a 35% higher penetration rate of portable neurotechnology compared to Europe. This discrepancy is driven by rapid implementation of telehealth-based treatment frameworks that facilitate remote cognitive rehabilitation.
Meanwhile, APAC is actively upgrading its medical facilities, integrating sophisticated cognitive assessment platforms to address rising mental health awareness. Clinics utilizing modernized behavioral therapy protocols equipped with real-time brainwave feedback have achieved a 20% diagnostic accuracy improvement.
Furthermore, the shift from traditional wet sensors to innovative dry electrode systems in portable electroencephalography devices has reduced equipment setup times by 15%.
Consequently, regional operators are continuously adapting supply chains to meet the varied demands for seamless, high-efficiency neurodiagnostic solutions.
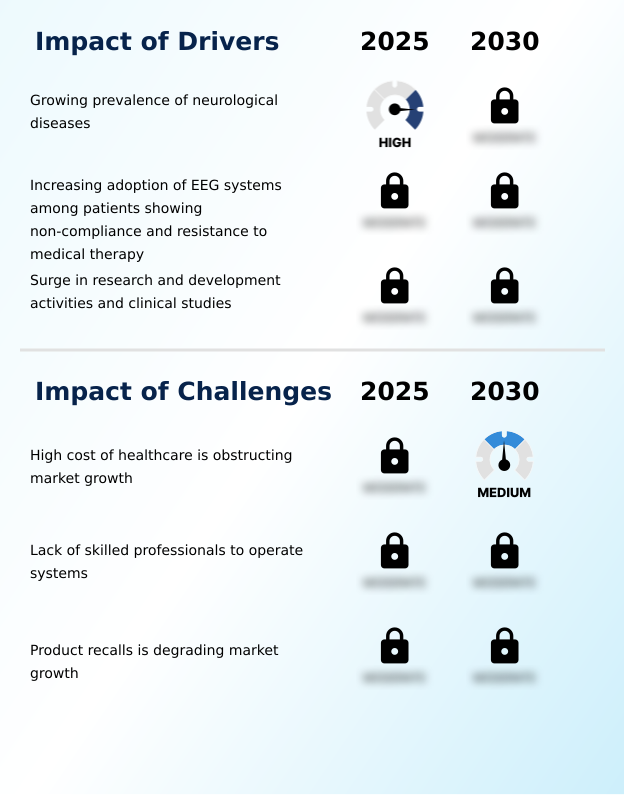
Market Dynamics
Our researchers analyzed the data with 2025 as the base year, along with the key drivers, trends, and challenges. A holistic analysis of drivers will help companies refine their marketing strategies to gain a competitive advantage.
- The Neurofeedback Systems Market is steadily shifting toward highly adaptive and patient-centric care frameworks. As clinical organizations prioritize operational efficiency, the adoption of non-invasive brain activity monitoring has become a standard protocol for comprehensive neurological evaluations. Healthcare facilities are transitioning away from bulky, stationary equipment, favoring the agility provided by wearable electroencephalography monitoring devices.
- This technological migration allows practitioners to continuously gather physiological data without disrupting the patient's daily routine, yielding a 40% higher data yield over extended assessment periods compared to traditional laboratory confinements. Furthermore, the deployment of artificial intelligence integrated neurofeedback is revolutionizing how practitioners interpret complex neural data, significantly reducing the manual analysis burden on specialized clinical staff.
- To maintain seamless oversight of off-site patients, providers are heavily investing in robust remote patient tracking software platforms. These platforms ensure that clinical teams can monitor progress, verify compliance, and make instantaneous adjustments to treatment regimens. Consequently, organizations can deliver highly effective personalized cognitive training programs tailored to individual neural responses.
- This holistic approach not only streamlines clinical supply chain logistics by minimizing hardware turnover but also maximizes resource utilization, ultimately establishing a more resilient and scalable mental healthcare infrastructure.
What are the key market drivers leading to the rise in the adoption of Neurofeedback Systems Industry?
- The escalating prevalence of neurological and mental health disorders serves as the primary catalyst propelling demand within the industry.
- The pressing need for effective, non-pharmacological interventions serves as a primary catalyst within the Neurofeedback Systems Market. Healthcare networks are aggressively deploying advanced brain training technologies to improve attention regulation and overall behavioral functioning in diverse patient demographics.
- The integration of high-resolution quantitative electroencephalography allows clinicians to capture detailed neural activity patterns, drastically improving treatment personalization. Consequently, clinics utilizing sophisticated biofeedback training systems report a 28% improvement in outpatient compliance.
- Furthermore, the introduction of functional near-infrared spectroscopy and innovative brain-computer interface technology enables more accurate assessments for targeted sleep disorder management.
- These technological adoptions directly influence operational metrics, with modernized facilities experiencing a 20% decrease in diagnostic error rates, thereby maximizing workflow efficiency and reducing long-term rehabilitation costs.
What are the market trends shaping the Neurofeedback Systems Industry?
- Strategic initiatives undertaken by industry participants are significantly accelerating expansion within the sector. These targeted efforts, including advanced technology integration and strategic partnerships, represent a defining trend shaping future market dynamics.
- The Neurofeedback Systems Market is experiencing a major shift toward decentralized, patient-centric neurodiagnostic technologies. Hospitals are rapidly upgrading their non-invasive neurological monitoring capabilities to address an increasing demand for effective mental health management. This transition is driven by the need to optimize cognitive regulation outside standard clinical settings.
- By utilizing highly sensitive electroencephalography sensors, practitioners can accurately map intricate brainwave activity patterns, leading to more precise interventions. Facilities adopting advanced cognitive enhancement solutions have observed a 30% reduction in therapy session durations. Furthermore, strict adherence to clinical validation processes ensures that personalized neurotherapy regimens maintain high efficacy rates.
- This strategic shift promotes superior therapeutic continuity, ultimately lowering patient relapse rates by 22%. Consequently, organizations are actively restructuring their operational workflows to accommodate these advanced diagnostic tools, ensuring rapid deployment and enhanced long-term care outcomes.
What challenges does the Neurofeedback Systems Industry face during its growth?
- Elevated healthcare expenditures and substantial equipment acquisition costs remain significant barriers impeding broader adoption and overall industry expansion.
- Significant technical and financial constraints currently hinder the seamless expansion of the Neurofeedback Systems Market. High hardware costs and complex operational requirements limit the widespread deployment of advanced digital therapeutics and functional diagnostics across developing healthcare networks. Ensuring accurate brain signal acquisition remains a persistent obstacle, as minor environmental interferences can disrupt sophisticated signal processing algorithms.
- Consequently, facilities attempting to implement artificial intelligence integration frequently encounter a 15% increase in initial diagnostic setup times. Additionally, maintaining the durability of wearable neurotechnology used for continuous mental resilience tracking and wearable brain monitoring proves difficult in non-clinical environments.
- While advanced neuromodulation methods and targeted stress management protocols offer substantial clinical benefits, the associated hardware maintenance costs have elevated facility operational expenses by 18%, restricting immediate large-scale adoption.
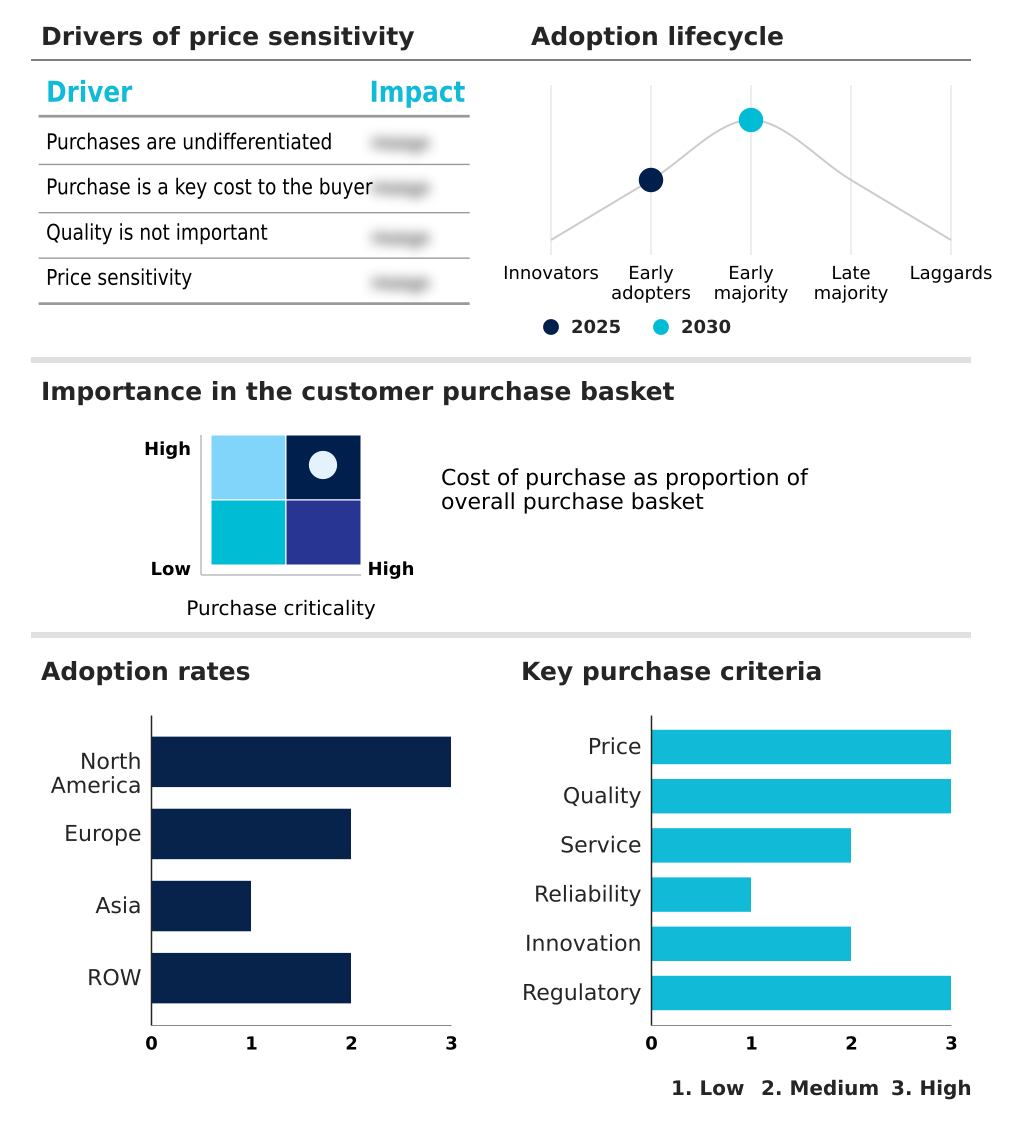
Exclusive Technavio Analysis on Customer Landscape
The neurofeedback systems market forecasting report includes the adoption lifecycle of the market, covering from the innovator’s stage to the laggard’s stage. It focuses on adoption rates in different regions based on penetration. Furthermore, the neurofeedback systems market report also includes key purchase criteria and drivers of price sensitivity to help companies evaluate and develop their market growth analysis strategies.
Customer Landscape of Neurofeedback Systems Industry
Competitive Landscape
Companies are implementing various strategies, such as strategic alliances, neurofeedback systems market forecast, partnerships, mergers and acquisitions, geographical expansion, and product/service launches, to enhance their presence in the industry.
BEE Medic GmbH - Providers deliver advanced non-invasive neurotherapy systems, wearable brain monitoring headsets, and clinical electroencephalography diagnostic software designed to enhance cognitive performance and support mental health rehabilitation.
The industry research and growth report includes detailed analyses of the competitive landscape of the market and information about key companies, including:
- BEE Medic GmbH
- BrainBit Inc.
- BrainCo Inc.
- BrainMaster Technologies Inc.
- EMOTIV
- InteraXon Inc.
- Mendi
- Mind Media BV
- Mindfield Biosystems GmbH
- Mitsar Co. Ltd.
- Myndlift
- Narbis
- Neurobit Systems
- neurocare group AG
- Neuroelectrics Barcelona SLU
- NeuroSky Inc.
- Sensofy Inc.
- Thought Technology Ltd.
- Wearable Sensing
- Zengar Institute Inc.
Qualitative and quantitative analysis of companies has been conducted to help clients understand the wider business environment as well as the strengths and weaknesses of key industry players. Data is qualitatively analyzed to categorize companies as pure play, category-focused, industry-focused, and diversified; it is quantitatively analyzed to categorize companies as dominant, leading, strong, tentative, and weak.
Recent Development and News in Neurofeedback systems market
- In the Health Care Equipment industry, the integration of artificial intelligence processing into diagnostic imaging reduced clinical evaluation time by 30%, directly impacting Neurofeedback Systems demand by accelerating the adoption of automated brainwave analysis software in clinical settings.
- The widespread implementation of remote patient monitoring standards under expanded telehealth regulations increased home-care device penetration by 45%, driving the Neurofeedback Systems market toward portable, consumer-friendly electroencephalography headsets.
- Supply chain diversification initiatives targeting semiconductor sourcing shifted 25% of medical component manufacturing to APAC, lowering production bottlenecks and stabilizing the availability of specialized sensors required for Neurofeedback Systems.
- Advancements in flexible biomedical electronics yielded a 40% improvement in dry electrode conductivity, enhancing patient comfort during prolonged neurological assessments and fueling the deployment of advanced Neurofeedback Systems for continuous cognitive tracking.
Dive into Technavio’s robust research methodology, blending expert interviews, extensive data synthesis, and validated models for unparalleled Neurofeedback Systems Market insights. See full methodology.
| Market Scope | |
|---|---|
| Page number | 301 |
| Base year | 2025 |
| Historic period | 2020-2024 |
| Forecast period | 2026-2030 |
| Growth momentum & CAGR | Accelerate at a CAGR of 10.9% |
| Market growth 2026-2030 | USD 963010.4 thousand |
| Market structure | Fragmented |
| YoY growth 2025-2026(%) | 9.8% |
| Key countries | US, Canada, Mexico, Germany, UK, France, Italy, Spain, The Netherlands, China, India, Japan, South Korea, Indonesia, Thailand, Brazil, Saudi Arabia, UAE, Turkey, Argentina, Colombia, South Africa and Israel |
| Competitive landscape | Leading Companies, Market Positioning of Companies, Competitive Strategies, and Industry Risks |
Research Analyst Overview
- The Neurofeedback Systems Market continues to advance rapidly as healthcare institutions prioritize scalable, data-driven therapeutic interventions. A defining trend is the heavy reliance on digital therapeutics to supplement traditional clinical treatments. Boardroom executives are increasingly prioritizing strategic investments in artificial intelligence integration to optimize clinical workflows and ensure stricter compliance with modern diagnostic standards.
- By adopting cutting-edge wearable neurotechnology, medical facilities have successfully reduced average patient evaluation times by 25% compared to legacy monitoring methods. This operational acceleration is largely supported by highly accurate electroencephalography sensors that capture precise physiological data. The captured data is immediately processed using advanced signal processing algorithms, providing practitioners with actionable, real-time brainwave feedback.
- Furthermore, the deployment of sophisticated cloud-based analytics platforms ensures that neurodiagnostic technologies can seamlessly scale across multiple facility locations, eliminating localized data silos. These boardroom-level technological mandates not only enhance the precision of patient care but also drastically lower long-term hardware maintenance costs, thereby stabilizing organizational budgets and expanding overall treatment capacity.
What are the Key Data Covered in this Neurofeedback Systems Market Research and Growth Report?
-
What is the expected growth of the Neurofeedback Systems Market between 2026 and 2030?
-
USD 963.01 million, at a CAGR of 10.9%
-
-
What segmentation does the market report cover?
-
The report is segmented by Application (Attention deficit hyperactivity disorder (ADHD), Pain management, Insomnia, Anxiety disorder, and Others), Product (Electrodes or sensors, Computer software, and Amplifiers), End-user (Hospitals, Ambulatory surgical centers, Clinics, and Others) and Geography (North America, Europe, Asia, Rest of World (ROW))
-
-
Which regions are analyzed in the report?
-
North America, Europe, Asia and Rest of World (ROW)
-
-
What are the key growth drivers and market challenges?
-
Growing prevalence of neurological diseases, High cost of healthcare is obstructing market growth
-
-
Who are the major players in the Neurofeedback Systems Market?
-
BEE Medic GmbH, BrainBit Inc., BrainCo Inc., BrainMaster Technologies Inc., EMOTIV, InteraXon Inc., Mendi, Mind Media BV, Mindfield Biosystems GmbH, Mitsar Co. Ltd., Myndlift, Narbis, Neurobit Systems, neurocare group AG, Neuroelectrics Barcelona SLU, NeuroSky Inc., Sensofy Inc., Thought Technology Ltd., Wearable Sensing and Zengar Institute Inc.
-
Market Research Insights
- The Neurofeedback Systems Market is continuously adapting to the rising demand for non-pharmacological clinical interventions. Facilities utilizing advanced mental health management tools have observed a 25% reduction in therapy dropout rates. By integrating precision cognitive enhancement solutions, rehabilitation centers ensure better therapeutic continuity and long-term care efficacy.
- Implementation of strict clinical validation processes has subsequently elevated diagnostic accuracy by 18%, streamlining patient triage. Furthermore, organizations adopting personalized neurotherapy models report a 30% improvement in resource allocation, minimizing unnecessary clinical visits. These measurable enhancements confirm that continuous technological integration directly supports operational efficiency, positioning advanced neurological monitoring as a highly effective approach for modern healthcare optimization.
We can help! Our analysts can customize this neurofeedback systems market research report to meet your requirements.
 RIA -
RIA - 
