Next Generation Sequencing Data Analysis Market Analysis North America, Europe, Asia, Rest of World (ROW) - US, Germany, Canada, China, UK - Size and Forecast 2024-2028

Next Generation Sequencing Data Analysis Market Analysis North America, Europe, Asia, Rest of World (ROW) - US, Germany, Canada, China, UK - Size and Forecast 2024-2028

Published: Jul 2024 178 Pages SKU: IRTNTR75844

Market Overview at a Glance

$1.90 B
Market Opportunity
22.58%
CAGR
21.89
YoY growth 2023-2024(%)

Next Generation Sequencing Data Analysis Market Size 2024-2028

The global next generation sequencing data analysis market size is estimated to grow by USD 1.90 billion at a CAGR of 22.58% between 2023 and 2028. The market's growth hinges on several factors, including the escalating demand for personalized medicine, the increasing need for early diagnosis of genetic disorders, and the expanding applications in genomics research. Personalized medicine, tailored to individual genetic makeup, is gaining traction for its targeted and more effective treatment approach. The emphasis on early diagnosis of genetic disorders is driving the demand for advanced genetic testing technologies. Moreover, the broadening applications in genomics research, particularly in understanding genetic mechanisms and disease pathways, are fueling market expansion. These trends collectively highlight the growing significance of genetic testing and personalized medicine in healthcare, underscoring the market's growth trajectory.

What will be the Size of the Next Generation Sequencing Data Analysis Market During the Forecast Period?

Next Generation Sequencing Data Analysis Market Size

To learn more about this report, Request Free Sample

Key Companies & Market Insights

Companies are implementing various strategies, such as strategic alliances, partnerships, mergers and acquisitions, geographical expansion, and product/service launches, to enhance their presence in the market. The report also includes detailed analyses of the competitive landscape of the market and information about key companies, including:

Agilent Technologies Inc., Alphabet Inc., BGI Genomics Co. Ltd., Bio Rad Laboratories Inc., Bionivid Technology Pvt. Ltd., Congenica Ltd., Corewell Health, DNAnexus Inc., DNASTAR Inc., Eurofins Scientific SE, F. Hoffmann La Roche Ltd., Fabric Genomics Inc., Golden Helix Inc., HiberCell Inc., Illumina Inc., Invitae Corp., Macrogen Inc., Oxford Nanopore Technologies plc, Pacific Biosciences of California Inc., Partek Inc., PierianDx Inc., QIAGEN NV, SciGenom Labs Pvt. Ltd., Takara Bio Inc., Thermo Fisher Scientific Inc., and Vela Diagnostics

Qualitative and quantitative analysis of companies has been conducted to help clients understand the wider business environment as well as the strengths and weaknesses of key market players. Data is qualitatively analyzed to categorize companies as pure play, category-focused, industry-focused, and diversified; it is quantitatively analyzed to categorize companies as dominant, leading, strong, tentative, and weak.

Market Segmentation 

By End-user

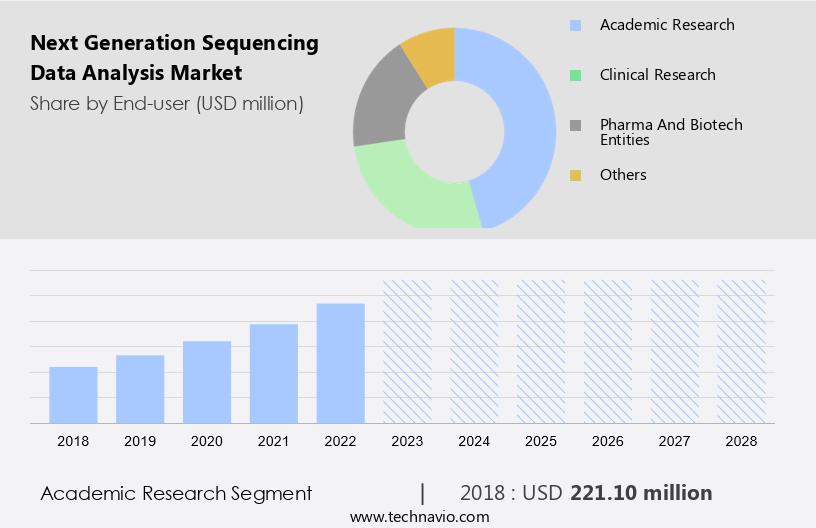
The market share growth by the academic research segment will be significant during the forecast period. The market encompasses DNA sequencing technologies used in genomic science, academic research, and clinical diagnostics. Academic institutions utilize NGS for various applications, such as drug discovery, personalized medicine, and clinical diagnostics.

Next Generation Sequencing Data Analysis Market Size

Get a glance at the market contribution of various segments Download PDF Sample

The academic research segment was valued at USD 221.1 million in 2018. Key drivers include decreasing sequencing costs, user-friendly software, and the demand for precision medicine. NGS enables the analysis of genomic patterns, epigenetics, and biological processes through sequence analysis tools and algorithms. Applications include oncology, genetic research, and tumor genotyping. NGS protocols aid in identifying somatic driver mutations, germline mutations, and resistance mutations. Cancer-related illnesses, financial irregularities, and healthcare professionals benefit from these tools, machine learning techniques, and cloud-based solutions. Additionally, NGS is applied in agriculture, forensics, and genomic studies. Key technologies include Whole-Genome Sequencing, array-based technologies, and clinical. Hence, these factors are expected to drive the market during the forecast period.

By Product 

Services play an important role in the market, providing specialized expertise and support to users in analyzing and interpreting their NGS data. The market encompasses various services for Exome Sequencing, Targeted Resequencing, De Novo Sequencing, and Methyl Sequencing. Biotechnology and pharmaceutical companies, along with contract research organizations, utilize these services to analyze and interpret their NGS data. The process involves raw data preprocessing, alignment, variant calling, and annotation, employing advanced tools and algorithms. Service providers ensure accuracy and reliability through quality control measures and optimization of parameters. Technologies like Synthesis (SBS) are integral part. Hence, these factors are expected to drive the growth of the services segment in the market during the forecast period.

Regional Analysis

Next Generation Sequencing Data Analysis Market Share by Geography

For more insights about the market share of various regions Download PDF Sample

North America is estimated to contribute 49% to the growth of the global market during the forecast period. Technavio's analysts have elaborately explained the regional trends and drivers will shape the market during the forecast period.

The market is primarily driven by advancements in DNA sequencing technology and its applications in various sectors. In 2022, North America led the market due to increased demand for early diagnosis of diseases, particularly cancer, and the presence of major players like Illumina, Thermo Fisher Scientific, and PerkinElmer. NGS has revolutionized genomic science by decreasing the cost of sequencing, and enabling research in rare diseases, epigenetics, and genomic patterns. Clinical diagnostics, bioinformatics pipelines, and cloud computing solutions are essential components. Sequence analysis tools and algorithms are used to interpret somatic driver mutations, germline mutations, and resistance mutations in biological systems. NGS protocols are crucial in oncology, precise medicine, and genetic research. Cancer-related illnesses, financial irregularities, and healthcare professionals are significant end-users. Technology operators, agriculture, forensics, and genomic studies also utilize these tools, including machine learning techniques and cloud-based solutions. Array-based technologies and clinical data are integral to Whole-Genome Sequencing.

Buy Full Report Now

Market Dynamics and Customer Landscape

StartFragment

The market is experiencing significant growth due to the increasing demand for clinical diagnosis and precision medicine in various sectors, including Oncology, Pharma and Biotech, Hospitals and Clinics, and Academic Research. The market is driven by the availability of genomic and proteomic information, which requires advanced Cloud-based software, Algorithms and processing capabilities for tertiary and secondary data analysis. NGS commercial software is essential for DNA sequencing techniques such as Long Read Sequencing and Short Read Sequencing, enabling the identification of genomic patterns and epigenetics in breast cancers and rare diseases. The integration of NGS with cloud computing solutions facilitates the efficient analysis of large datasets, making sequence analysis tools indispensable for genomic research and personalized medicine applications. Oncology precision medicine relies on genomic information for patient treatment, utilizing very long read sequencing for detailed genetic analysis. Tertiary data analysis is typically conducted in-house to derive meaningful insights from the vast amount of genomic data generated. Our researchers analyzed the data with 2022 as the base year, along with the key drivers, trends, and challenges. 

Key Market Drivers

The adaptation of personalized medicine is a significant driver in the market. The market is experiencing growth due to the increasing need for personalized medicine. Biotechnology and pharmaceutical companies, as well as contract research organizations, are utilizing these for exome sequencing, targeted resequencing, de novo sequencing, and methyl sequencing. Synthesis technology, such as SBS, facilitates the cost-effective and timely analysis of an individual's genome or specific gene regions. These enables the identification of disease-associated variants, including germline and somatic mutations, providing more precise and effective treatment strategies. Thus, the increasing demand for personalized medicine is one of the major drivers that is expected to boost the growth of the market during the forecast period.

Significant Market Trends

Growing advances in NGS techniques is the major trend driving the market growth and forecasting. This is a crucial segment in the biotechnology industry, driven by advancements in Exome Sequencing, Targeted Resequencing, De Novo Sequencing, and Methyl Sequencing. These techniques have revolutionized the diagnostic and therapeutic landscape in clinical environments, particularly in cancer research. Synthesis (SBS) Technology is the backbone of NGS, enabling Pharmaceutical Companies and Contract Research Organizations to decipher the genetic makeup of diseases and identify potential treatments. The application of NGS in various fields has significantly reduced the cost of sequencing, making it accessible to smaller laboratories. Overall, it is a dynamic and evolving market that continues to shape the future of personalized medicine and research. Hence, these factors are expected to boost the growth of the market during the forecast period.

Major Market Challenges

Challenges in implementing NGS workflow is the major challenge that impedes the market growth analysis. Next Generation Sequencing (NGS) is a groundbreaking technology in the fields of biotechnology, pharmaceutical companies, and contract research organizations. It facilitates multiple high-throughput molecular profiling assays, including Exome Sequencing, Targeted Resequencing, De Novo Sequencing, and Methyl Sequencing. Despite its advantages, such as shorter turnaround time and lower costs, NGS encounters challenges. These include the need for expertly chosen analytical software tools for workflows, the development of automation strategies, data storage solutions for the vast amounts of generated data, and ethical and legal considerations. The Synthesis (SBS) Technology underpins NGS, enabling simultaneous sequencing of millions of DNA fragments. Therefore, these factors are expected to impede the growth of the market during the forecast period.

Market Customer Landscape

The market forecast report includes the adoption lifecycle of the market, covering from the innovator's stage to the laggard's stage. It focuses on adoption rates in different regions based on penetration. Furthermore, the market report also includes key purchase criteria and drivers of price sensitivity to help companies evaluate and develop their market forecasting and growth strategies.

Next Generation Sequencing Data Analysis Market Share by Geography

 Customer Landscape

Segment Overview

The market research report provides comprehensive data (region-wise segment analysis), with forecasts and estimates in "USD billion " for the period 2024-2028, as well as historical data from 2018 - 2022 for the following segments.

  • End-user Outlook 
    • Academic research
    • Clinical research
    • Pharma and biotech entities
    • Hospitals and clinics and others
  • Product Outlook 
    • Services
    • NGS commercial software
  • Region Outlook 
    • North America
      • The U.S.
      • Canada
    • Europe
      • U.K.
      • Germany
      • France
      • Rest of Europe
    • Asia
      • China
      • India
    • Rest of the world (ROW)
      • Argentina 
      • Brazil 
      • Australia

You may also be interested in:

Market Analyst Overview

The market is a significant and growing field in the genomic research industry. The use of NGS technology has revolutionized the way genetic information is analyzed, leading to advancements in various sectors such as diagnostics, research, and personalized medicine. NGS data analysis involves the processing and interpretation of massive amounts of genetic data to identify genetic variations and mutations. The market for NGS data analysis is driven by factors such as increasing demand for personalized medicine, growing research in genomics, and technological advancements in NGS technology. The market is expected to grow at a steady pace due to the increasing adoption of NGS technology in various applications.

Furthermore, the market is highly competitive, with key players including companies such as Genomic Health, Illumina, Thermo Fisher Scientific, and Qiagen. These companies are investing heavily in research and development to offer innovative solutions for NGS data analysis. The market for NGS data analysis is expected to grow significantly in the coming years due to the increasing demand for accurate and efficient analysis of genetic data. The market is also expected to be influenced by factors such as regulatory approvals, collaborations, and partnerships between companies. The market is a growing and dynamic field that is expected to continue its growth trajectory in the coming years. The market is driven by various factors such as technological advancements, increasing demand for personalized medicine, and growing research in genomics. The market is highly competitive, with key players investing heavily in research and development to offer innovative solutions for NGS data analysis.

Next Generation Sequencing Data Analysis Market Scope

Report Coverage

Details

Page number

178

Base year

2023

Historic period

2018 - 2022

Forecast period

2024-2028

Growth momentum & CAGR

Accelerate at a CAGR of 22.58%

Market growth 2024-2028

USD 1.9 billion

Market structure

Fragmented

YoY growth 2023-2024(%)

21.89

Regional analysis

North America, Europe, Asia, and Rest of World (ROW)

Performing market contribution

North America at 49%

Key countries

US, Germany, Canada, China, and UK

Competitive landscape

Leading Vendors, Market Positioning of Vendors, Competitive Strategies, and Industry Risks

Key companies profiled

Agilent Technologies Inc., Alphabet Inc., BGI Genomics Co. Ltd., Bio Rad Laboratories Inc., Bionivid Technology Pvt. Ltd., Congenica Ltd., Corewell Health, DNAnexus Inc., DNASTAR Inc., Eurofins Scientific SE, F. Hoffmann La Roche Ltd., Fabric Genomics Inc., Golden Helix Inc., HiberCell Inc., Illumina Inc., Invitae Corp., Macrogen Inc., Oxford Nanopore Technologies plc, Pacific Biosciences of California Inc., Partek Inc., PierianDx Inc., QIAGEN NV, SciGenom Labs Pvt. Ltd., Takara Bio Inc., Thermo Fisher Scientific Inc., and Vela Diagnostics

Market dynamics

Parent market analysis, Market growth inducers and obstacles, Fast-growing and slow-growing segment analysis, COVID-19 impact and recovery analysis and future consumer dynamics, Market condition analysis for forecast period.

Customization purview

If our market report has not included the data that you are looking for, you can reach out to our analysts and get segments customized.

Download Sample PDF at your Fingertips

What are the Key Data Covered in this Market Research and Growth Report?

  • CAGR of the market during the forecast period
  • Detailed information on factors that will drive the growth of the between 2024 and 2028
  • Precise estimation of the size of the market and its contribution in focus to the parent market
  • Detailed analysis of customer landscape covering diver of price sensitivity, adoption of the lifecycle, and key purchase criteria 
  • Companies landscape comparing criticality of inputs and factors of differentiation
  • Exclusive Matrix on companies position and classification
  • Accurate predictions about upcoming trends and changes in consumer behavior
  • Growth of the market across North America, Europe, Asia, and Rest of World (ROW)
  • Thorough analysis of the market's competitive landscape and detailed information about companies
  • Comprehensive analysis of factors that will challenge the growth of companies

1 Executive Summary

  • 1.1 Market overview
    • Executive Summary - Chart on Market Overview
    • Executive Summary - Data Table on Market Overview
    • Executive Summary - Chart on Global Market Characteristics
    • Executive Summary - Chart on Market by Geography
    • Executive Summary - Chart on Market Segmentation by End-user
    • Executive Summary - Chart on Market Segmentation by Product
    • Executive Summary - Chart on Incremental Growth
    • Executive Summary - Data Table on Incremental Growth
    • Executive Summary - Chart on Company Market Positioning

2 Market Landscape

  • 2.1 Market ecosystem
    • Parent Market
    • Data Table on - Parent Market
  • 2.2 Market characteristics
    • Market characteristics analysis
  • 2.3 Value chain analysis
    • Value Chain Analysis

3 Market Sizing

  • 3.1 Market definition
    • Offerings of companies included in the market definition
  • 3.2 Market segment analysis
    • Market segments
  • 3.3 Market size 2023
    • 3.4 Market outlook: Forecast for 2023-2028
      • Chart on Global - Market size and forecast 2023-2028 ($ million)
      • Data Table on Global - Market size and forecast 2023-2028 ($ million)
      • Chart on Global Market: Year-over-year growth 2023-2028 (%)
      • Data Table on Global Market: Year-over-year growth 2023-2028 (%)

    4 Historic Market Size

    • 4.1 Global Next Generation Sequencing Data Analysis Market 2018 - 2022
      • Historic Market Size - Data Table on Global Next Generation Sequencing Data Analysis Market 2018 - 2022 ($ million)
    • 4.2 End-user segment analysis 2018 - 2022
      • Historic Market Size - End-user Segment 2018 - 2022 ($ million)
    • 4.3 Product segment analysis 2018 - 2022
      • Historic Market Size - Product Segment 2018 - 2022 ($ million)
    • 4.4 Geography segment analysis 2018 - 2022
      • Historic Market Size - Geography Segment 2018 - 2022 ($ million)
    • 4.5 Country segment analysis 2018 - 2022
      • Historic Market Size - Country Segment 2018 - 2022 ($ million)

    5 Five Forces Analysis

    • 5.1 Five forces summary
      • Five forces analysis - Comparison between 2023 and 2028
    • 5.2 Bargaining power of buyers
      • Bargaining power of buyers - Impact of key factors 2023 and 2028
    • 5.3 Bargaining power of suppliers
      • Bargaining power of suppliers - Impact of key factors in 2023 and 2028
    • 5.4 Threat of new entrants
      • Threat of new entrants - Impact of key factors in 2023 and 2028
    • 5.5 Threat of substitutes
      • Threat of substitutes - Impact of key factors in 2023 and 2028
    • 5.6 Threat of rivalry
      • Threat of rivalry - Impact of key factors in 2023 and 2028
    • 5.7 Market condition
      • Chart on Market condition - Five forces 2023 and 2028

    6 Market Segmentation by End-user

    • 6.1 Market segments
      • Chart on End-user - Market share 2023-2028 (%)
      • Data Table on End-user - Market share 2023-2028 (%)
    • 6.2 Comparison by End-user
      • Chart on Comparison by End-user
      • Data Table on Comparison by End-user
    • 6.3 Academic research - Market size and forecast 2023-2028
      • Chart on Academic research - Market size and forecast 2023-2028 ($ million)
      • Data Table on Academic research - Market size and forecast 2023-2028 ($ million)
      • Chart on Academic research - Year-over-year growth 2023-2028 (%)
      • Data Table on Academic research - Year-over-year growth 2023-2028 (%)
    • 6.4 Clinical research - Market size and forecast 2023-2028
      • Chart on Clinical research - Market size and forecast 2023-2028 ($ million)
      • Data Table on Clinical research - Market size and forecast 2023-2028 ($ million)
      • Chart on Clinical research - Year-over-year growth 2023-2028 (%)
      • Data Table on Clinical research - Year-over-year growth 2023-2028 (%)
    • 6.5 Pharma and biotech entities - Market size and forecast 2023-2028
      • Chart on Pharma and biotech entities - Market size and forecast 2023-2028 ($ million)
      • Data Table on Pharma and biotech entities - Market size and forecast 2023-2028 ($ million)
      • Chart on Pharma and biotech entities - Year-over-year growth 2023-2028 (%)
      • Data Table on Pharma and biotech entities - Year-over-year growth 2023-2028 (%)
    • 6.6 Others - Market size and forecast 2023-2028
      • Chart on Others - Market size and forecast 2023-2028 ($ million)
      • Data Table on Others - Market size and forecast 2023-2028 ($ million)
      • Chart on Others - Year-over-year growth 2023-2028 (%)
      • Data Table on Others - Year-over-year growth 2023-2028 (%)
    • 6.7 Market opportunity by End-user
      • Market opportunity by End-user ($ million)
      • Data Table on Market opportunity by End-user ($ million)

    7 Market Segmentation by Product

    • 7.1 Market segments
      • Chart on Product - Market share 2023-2028 (%)
      • Data Table on Product - Market share 2023-2028 (%)
    • 7.2 Comparison by Product
      • Chart on Comparison by Product
      • Data Table on Comparison by Product
    • 7.3 Services - Market size and forecast 2023-2028
      • Chart on Services - Market size and forecast 2023-2028 ($ million)
      • Data Table on Services - Market size and forecast 2023-2028 ($ million)
      • Chart on Services - Year-over-year growth 2023-2028 (%)
      • Data Table on Services - Year-over-year growth 2023-2028 (%)
    • 7.4 NGS commercial software - Market size and forecast 2023-2028
      • Chart on NGS commercial software - Market size and forecast 2023-2028 ($ million)
      • Data Table on NGS commercial software - Market size and forecast 2023-2028 ($ million)
      • Chart on NGS commercial software - Year-over-year growth 2023-2028 (%)
      • Data Table on NGS commercial software - Year-over-year growth 2023-2028 (%)
    • 7.5 Market opportunity by Product
      • Market opportunity by Product ($ million)
      • Data Table on Market opportunity by Product ($ million)

    8 Customer Landscape

    • 8.1 Customer landscape overview
      • Analysis of price sensitivity, lifecycle, customer purchase basket, adoption rates, and purchase criteria

    9 Geographic Landscape

    • 9.1 Geographic segmentation
      • Chart on Market share by geography 2023-2028 (%)
      • Data Table on Market share by geography 2023-2028 (%)
    • 9.2 Geographic comparison
      • Chart on Geographic comparison
      • Data Table on Geographic comparison
    • 9.3 North America - Market size and forecast 2023-2028
      • Chart on North America - Market size and forecast 2023-2028 ($ million)
      • Data Table on North America - Market size and forecast 2023-2028 ($ million)
      • Chart on North America - Year-over-year growth 2023-2028 (%)
      • Data Table on North America - Year-over-year growth 2023-2028 (%)
    • 9.4 Europe - Market size and forecast 2023-2028
      • Chart on Europe - Market size and forecast 2023-2028 ($ million)
      • Data Table on Europe - Market size and forecast 2023-2028 ($ million)
      • Chart on Europe - Year-over-year growth 2023-2028 (%)
      • Data Table on Europe - Year-over-year growth 2023-2028 (%)
    • 9.5 Asia - Market size and forecast 2023-2028
      • Chart on Asia - Market size and forecast 2023-2028 ($ million)
      • Data Table on Asia - Market size and forecast 2023-2028 ($ million)
      • Chart on Asia - Year-over-year growth 2023-2028 (%)
      • Data Table on Asia - Year-over-year growth 2023-2028 (%)
    • 9.6 Rest of World (ROW) - Market size and forecast 2023-2028
      • Chart on Rest of World (ROW) - Market size and forecast 2023-2028 ($ million)
      • Data Table on Rest of World (ROW) - Market size and forecast 2023-2028 ($ million)
      • Chart on Rest of World (ROW) - Year-over-year growth 2023-2028 (%)
      • Data Table on Rest of World (ROW) - Year-over-year growth 2023-2028 (%)
    • 9.7 US - Market size and forecast 2023-2028
      • Chart on US - Market size and forecast 2023-2028 ($ million)
      • Data Table on US - Market size and forecast 2023-2028 ($ million)
      • Chart on US - Year-over-year growth 2023-2028 (%)
      • Data Table on US - Year-over-year growth 2023-2028 (%)
    • 9.8 Germany - Market size and forecast 2023-2028
      • Chart on Germany - Market size and forecast 2023-2028 ($ million)
      • Data Table on Germany - Market size and forecast 2023-2028 ($ million)
      • Chart on Germany - Year-over-year growth 2023-2028 (%)
      • Data Table on Germany - Year-over-year growth 2023-2028 (%)
    • 9.9 Canada - Market size and forecast 2023-2028
      • Chart on Canada - Market size and forecast 2023-2028 ($ million)
      • Data Table on Canada - Market size and forecast 2023-2028 ($ million)
      • Chart on Canada - Year-over-year growth 2023-2028 (%)
      • Data Table on Canada - Year-over-year growth 2023-2028 (%)
    • 9.10 China - Market size and forecast 2023-2028
      • Chart on China - Market size and forecast 2023-2028 ($ million)
      • Data Table on China - Market size and forecast 2023-2028 ($ million)
      • Chart on China - Year-over-year growth 2023-2028 (%)
      • Data Table on China - Year-over-year growth 2023-2028 (%)
    • 9.11 UK - Market size and forecast 2023-2028
      • Chart on UK - Market size and forecast 2023-2028 ($ million)
      • Data Table on UK - Market size and forecast 2023-2028 ($ million)
      • Chart on UK - Year-over-year growth 2023-2028 (%)
      • Data Table on UK - Year-over-year growth 2023-2028 (%)
    • 9.12 Market opportunity by geography
      • Market opportunity by geography ($ million)
      • Data Tables on Market opportunity by geography ($ million)

    10 Drivers, Challenges, and Opportunity/Restraints

    • 10.1 Market drivers
      • 10.2 Market challenges
        • 10.3 Impact of drivers and challenges
          • Impact of drivers and challenges in 2023 and 2028
        • 10.4 Market opportunities/restraints

          11 Competitive Landscape

          • 11.1 Overview
            • 11.2 Competitive Landscape
              • Overview on criticality of inputs and factors of differentiation
            • 11.3 Landscape disruption
              • Overview on factors of disruption
            • 11.4 Industry risks
              • Impact of key risks on business

            12 Competitive Analysis

            • 12.1 Companies profiled
              • Companies covered
            • 12.2 Market positioning of companies
              • Matrix on companies position and classification
            • 12.3 Agilent Technologies Inc.
              • Agilent Technologies Inc. - Overview
              • Agilent Technologies Inc. - Business segments
              • Agilent Technologies Inc. - Key news
              • Agilent Technologies Inc. - Key offerings
              • Agilent Technologies Inc. - Segment focus
            • 12.4 Bio Rad Laboratories Inc.
              • Bio Rad Laboratories Inc. - Overview
              • Bio Rad Laboratories Inc. - Business segments
              • Bio Rad Laboratories Inc. - Key news
              • Bio Rad Laboratories Inc. - Key offerings
              • Bio Rad Laboratories Inc. - Segment focus
            • 12.5 Congenica Ltd.
              • Congenica Ltd. - Overview
              • Congenica Ltd. - Product / Service
              • Congenica Ltd. - Key offerings
            • 12.6 DNAnexus Inc.
              • DNAnexus Inc. - Overview
              • DNAnexus Inc. - Product / Service
              • DNAnexus Inc. - Key offerings
            • 12.7 DNASTAR Inc.
              • DNASTAR Inc. - Overview
              • DNASTAR Inc. - Product / Service
              • DNASTAR Inc. - Key offerings
            • 12.8 Eurofins Scientific SE
              • Eurofins Scientific SE - Overview
              • Eurofins Scientific SE - Business segments
              • Eurofins Scientific SE - Key news
              • Eurofins Scientific SE - Key offerings
              • Eurofins Scientific SE - Segment focus
            • 12.9 F. Hoffmann La Roche Ltd.
              • F. Hoffmann La Roche Ltd. - Overview
              • F. Hoffmann La Roche Ltd. - Business segments
              • F. Hoffmann La Roche Ltd. - Key news
              • F. Hoffmann La Roche Ltd. - Key offerings
              • F. Hoffmann La Roche Ltd. - Segment focus
            • 12.10 Fabric Genomics Inc.
              • Fabric Genomics Inc. - Overview
              • Fabric Genomics Inc. - Product / Service
              • Fabric Genomics Inc. - Key offerings
            • 12.11 Golden Helix Inc.
              • Golden Helix Inc. - Overview
              • Golden Helix Inc. - Product / Service
              • Golden Helix Inc. - Key offerings
            • 12.12 Illumina Inc.
              • Illumina Inc. - Overview
              • Illumina Inc. - Business segments
              • Illumina Inc. - Key news
              • Illumina Inc. - Key offerings
              • Illumina Inc. - Segment focus
            • 12.13 Pacific Biosciences of California Inc.
              • Pacific Biosciences of California Inc. - Overview
              • Pacific Biosciences of California Inc. - Product / Service
              • Pacific Biosciences of California Inc. - Key news
              • Pacific Biosciences of California Inc. - Key offerings
            • 12.14 Partek Inc.
              • Partek Inc. - Overview
              • Partek Inc. - Product / Service
              • Partek Inc. - Key offerings
            • 12.15 QIAGEN NV
              • QIAGEN NV - Overview
              • QIAGEN NV - Product / Service
              • QIAGEN NV - Key news
              • QIAGEN NV - Key offerings
            • 12.16 SciGenom Labs Pvt. Ltd.
              • SciGenom Labs Pvt. Ltd. - Overview
              • SciGenom Labs Pvt. Ltd. - Product / Service
              • SciGenom Labs Pvt. Ltd. - Key offerings
            • 12.17 Thermo Fisher Scientific Inc.
              • Thermo Fisher Scientific Inc. - Overview
              • Thermo Fisher Scientific Inc. - Business segments
              • Thermo Fisher Scientific Inc. - Key news
              • Thermo Fisher Scientific Inc. - Key offerings
              • Thermo Fisher Scientific Inc. - Segment focus

            13 Appendix

            • 13.1 Scope of the report
              • 13.2 Inclusions and exclusions checklist
                • Inclusions checklist
                • Exclusions checklist
              • 13.3 Currency conversion rates for US$
                • Currency conversion rates for US$
              • 13.4 Research methodology
                • Research methodology
              • 13.5 Data procurement
                • Information sources
              • 13.6 Data validation
                • Data validation
              • 13.7 Validation techniques employed for market sizing
                • Validation techniques employed for market sizing
              • 13.8 Data synthesis
                • Data synthesis
              • 360 degree market analysis
                • 360 degree market analysis
              • 13.10 List of abbreviations
                • List of abbreviations

              Research Methodology

              Technavio presents a detailed picture of the market by way of study, synthesis, and summation of data from multiple sources. The analysts have presented the various facets of the market with a particular focus on identifying the key industry influencers. The data thus presented is comprehensive, reliable, and the result of extensive research, both primary and secondary.

              INFORMATION SOURCES

              Primary sources

              • Manufacturers and suppliers
              • Channel partners
              • Industry experts
              • Strategic decision makers

              Secondary sources

              • Industry journals and periodicals
              • Government data
              • Financial reports of key industry players
              • Historical data
              • Press releases

              DATA ANALYSIS

              Data Synthesis

              • Collation of data
              • Estimation of key figures
              • Analysis of derived insights

              Data Validation

              • Triangulation with data models
              • Reference against proprietary databases
              • Corroboration with industry experts

              REPORT WRITING

              Qualitative

              • Market drivers
              • Market challenges
              • Market trends
              • Five forces analysis

              Quantitative

              • Market size and forecast
              • Market segmentation
              • Geographical insights
              • Competitive landscape

              Interested in this report?

              Get your sample now to see our research methodology and insights!

              Download Now

              Frequently Asked Questions

              Next Generation Sequencing Data Analysis market growth will increase by $ 1902.3 mn during 2024-2028.

              The Next Generation Sequencing Data Analysis market is expected to grow at a CAGR of 22.58% during 2024-2028.

              Next Generation Sequencing Data Analysis market is segmented by End-user( Academic research, Clinical research, Pharma and biotech entities, Others) Product( Services, NGS commercial software)

              Agilent Technologies Inc., Alphabet Inc., BGI Genomics Co. Ltd., Bio Rad Laboratories Inc., Bionivid Technology Pvt. Ltd., Congenica Ltd., Corewell Health, DNAnexus Inc., DNASTAR Inc., Eurofins Scientific SE, F. Hoffmann La Roche Ltd., Fabric Genomics Inc., Golden Helix Inc., HiberCell Inc., Illumina Inc., Invitae Corp., Macrogen Inc., Oxford Nanopore Technologies plc, Pacific Biosciences of California Inc., Partek Inc., PierianDx Inc., QIAGEN NV, SciGenom Labs Pvt. Ltd., Takara Bio Inc., Thermo Fisher Scientific Inc., Vela Diagnostics are a few of the key vendors in the Next Generation Sequencing Data Analysis market.

              North America will register the highest growth rate of 49% among the other regions. Therefore, the Next Generation Sequencing Data Analysis market in North America is expected to garner significant business opportunities for the vendors during the forecast period.

              US, Germany, Canada, China, UK

              • Increase in number of strategic partnerships among market vendors to develop NGS data analysis solutionsThe rising demand for personalized medicine is a significant driver in the global NGS data analysis market. Personalized medicine aims to provide tailored healthcare based on an individual's genetic makeup is the driving factor this market.
              • offering more precise and effective treatment strategies. NGS data analysis plays a crucial role in this paradigm shift by enabling the identification of genetic variations that impact disease susceptibility is the driving factor this market.
              • drug response is the driving factor this market.
              • and treatment outcomes. With the advent of NGS technology is the driving factor this market.
              • it has become feasible to sequence and analyze an individual's entire genome or specific gene regions at a relatively affordable cost and within a reasonable timeframe. NGS data analysis allows for the identification of disease-associated variants is the driving factor this market.
              • including both germline and somatic mutations. By analyzing an individual's genetic profile is the driving factor this market.
              • healthcare professionals can better understand their predisposition to certain diseases is the driving factor this market.
              • assess their risk levels is the driving factor this market.
              • and customize preventive measures. Additionally is the driving factor this market.
              • NGS data analysis aids in identifying biomarkers that can predict disease progression or treatment response is the driving factor this market.
              • assisting in selecting the most suitable treatment options for individual patients. Furthermore is the driving factor this market.
              • NGS data analysis contributes to the advancement of rare disease diagnosis and management. By analyzing the entire exome or genome is the driving factor this market.
              • it becomes possible to detect rare genetic variants responsible for various genetic disorders. This assists in shortening diagnostic odysseys and provides families with accurate diagnoses is the driving factor this market.
              • appropriate counseling is the driving factor this market.
              • and potential treatment options. Thus is the driving factor this market.
              • the rising demand for personalized medicine is one of the major drivers which is expected to drive the growth of the market in focus during the forecast period. is the driving factor this market.

              The Next Generation Sequencing Data Analysis market vendors should focus on grabbing business opportunities from the Academic research segment as it accounted for the largest market share in the base year.