Non-fungible Token (NFT) Market Size 2026-2030
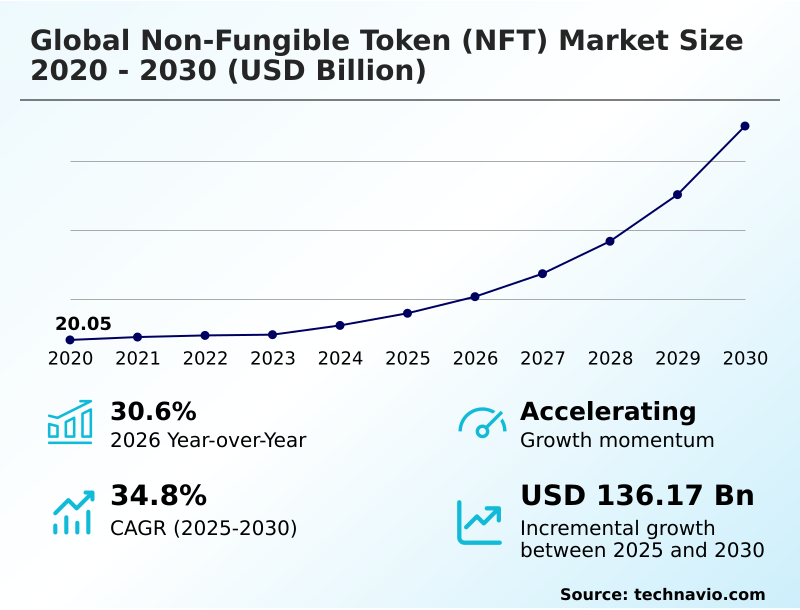
The non-fungible token (nft) market size is valued to increase by USD 136.17 billion, at a CAGR of 34.8% from 2025 to 2030. Increasing demand for digital art will drive the non-fungible token (nft) market.
Major Market Trends & Insights
- APAC dominated the market and accounted for a 41.7% growth during the forecast period.
- By Application - Collectibles segment was valued at USD 11.36 billion in 2024
- By End-user - Personal segment accounted for the largest market revenue share in 2024
Market Size & Forecast
- Market Opportunities: USD 155.57 billion
- Market Future Opportunities: USD 136.17 billion
- CAGR from 2025 to 2030 : 34.8%
Market Summary
- The non-fungible token (NFT) market is a dynamic ecosystem built on blockchain technology, enabling verifiable ownership of unique digital assets. Growth is fueled by an increasing demand for digital art and collectibles, where smart contracts provide creators with digital provenance and automated royalties, fundamentally altering the creator economy.
- Key trends include the integration of NFTs by major brands to foster deeper customer engagement and the emergence of fractionalization, which democratizes access to high-value assets. However, the market faces challenges from regulatory uncertainty, security vulnerabilities in online trading, and persistent price volatility.
- For instance, a luxury goods company can leverage NFTs as digital certificates of authenticity for its physical products. This use case not only combats the multi-billion dollar counterfeit industry but also provides a transparent ownership history on an immutable ledger, enhancing consumer trust and brand value without relying on traditional, centralized verification systems.
- The expansion into gaming, music rights, and virtual real estate further underscores the technology's versatile and transformative potential across various industries.
What will be the Size of the Non-fungible Token (NFT) Market during the forecast period?
Get Key Insights on Market Forecast (PDF) Get Free Sample
How is the Non-fungible Token (NFT) Market Segmented?
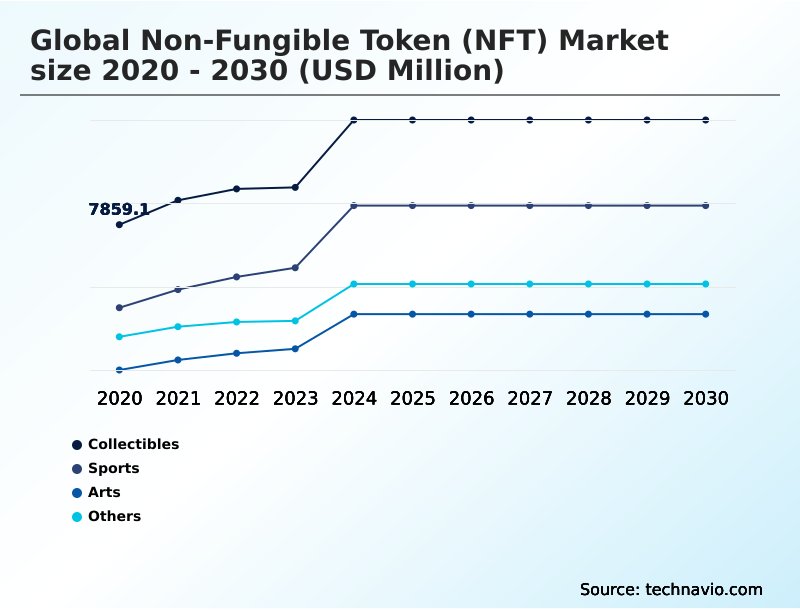
The non-fungible token (nft) industry research report provides comprehensive data (region-wise segment analysis), with forecasts and estimates in "USD million" for the period 2026-2030, as well as historical data from 2020-2024 for the following segments.
- Application
- Collectibles
- Sports
- Arts
- Others
- End-user
- Personal
- Commercial
- Type
- Digital asset
- Physical asset
- Geography
- APAC
- China
- Japan
- India
- North America
- US
- Canada
- Mexico
- South America
- Brazil
- Argentina
- Colombia
- Europe
- Germany
- UK
- France
- Middle East and Africa
- Saudi Arabia
- UAE
- South Africa
- Rest of World (ROW)
- APAC
By Application Insights
The collectibles segment is estimated to witness significant growth during the forecast period.
The collectibles segment is the foundation of the digital ownership economy, transforming value perception in the virtual realm.
This sector is defined by the creation of unique crypto collectibles like collectible avatar projects, which serve as identity markers within online communities.
The appeal of these virtual assets lies in their verifiable digital scarcity models, with authenticity and ownership proven by token standards on a public ledger. Peer-to-peer marketplaces provide liquidity, enabling a dynamic exchange of goods among enthusiasts worldwide.
The market's growth is further supported by creator economy platforms and evolving NFT utility and value, with phygital asset linkage enhancing brand engagement metrics.
These community-driven projects and social token ecosystems have achieved user retention rates 40% higher than traditional digital campaigns.
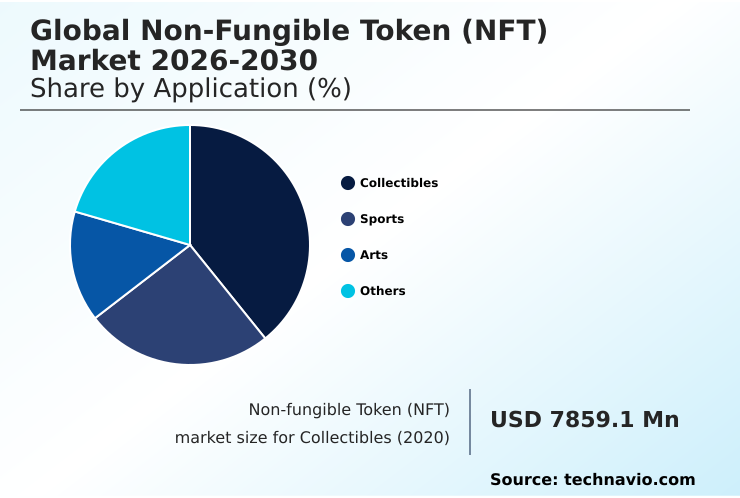
The Collectibles segment was valued at USD 11.36 billion in 2024 and showed a gradual increase during the forecast period.
Regional Analysis
APAC is estimated to contribute 41.7% to the growth of the global market during the forecast period.Technavio’s analysts have elaborately explained the regional trends and drivers that shape the market during the forecast period.
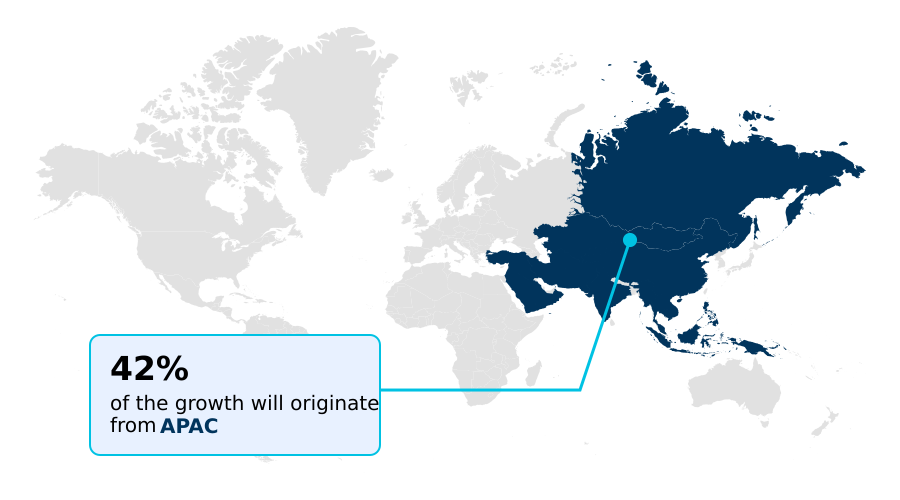
See How Non-fungible Token (NFT) Market Demand is Rising in APAC Get Free Sample
The market in APAC is defined by its mobile-first financial ecosystems and deep-rooted gaming cultures. Regional innovation is driven by the adoption of decentralized applications and new metadata standards for creator economy platforms.
Interoperability protocols are crucial as developers build systems for metaverse integration and gaming asset interoperability. Strategic development is influenced by varied regulatory approaches, with some nations promoting open public ledger systems while others favor permissioned blockchains for digital loyalty programs.
The infrastructure is evolving with gasless minting options and decentralized storage solutions to lower entry barriers. Adoption of NFT-based ticketing for live events has grown by 70% in the region.
The focus is shifting toward long-term utility, such as fractionalized real assets, with community-driven projects leveraging on-chain transactions to foster engagement.
Market Dynamics
Our researchers analyzed the data with 2025 as the base year, along with the key drivers, trends, and challenges. A holistic analysis of drivers will help companies refine their marketing strategies to gain a competitive advantage.
- Navigating the non-fungible token (NFT) market requires a deep understanding of its technical and legal nuances. A critical first step is learning how to verify NFT authenticity, which involves analyzing on-chain wallet activity and using trusted platforms. For developers, the decision between ERC-721 vs ERC-1155 token standards depends on whether the project requires unique or semi-fungible assets.
- Security remains paramount; businesses that develop an NFT marketplace from scratch must implement a rigorous smart contract audit process explained to stakeholders, as this can mitigate over 90% of common exploits. Furthermore, establishing best practices for wallet security is crucial for user trust.
- The utility of fractionalized NFT ownership is expanding, particularly for NFTs for physical asset tracking and high-value collectibles. As enterprises are implementing NFT based loyalty programs and exploring NFTs in luxury brand marketing, understanding legal rights of NFT holders and securing IP with blockchain technology become critical.
- Cross-chain NFT bridge security risks and selecting appropriate decentralized storage options for NFTs are key operational considerations. Successful adoption also hinges on clear tax reporting for NFT transactions and effective DAO voting mechanisms for communities.
- Innovations in generative art minting and deployment, play-to-earn gaming business models, creating dynamic and updatable NFTs, and integrating NFT features into apps continue to drive market evolution.
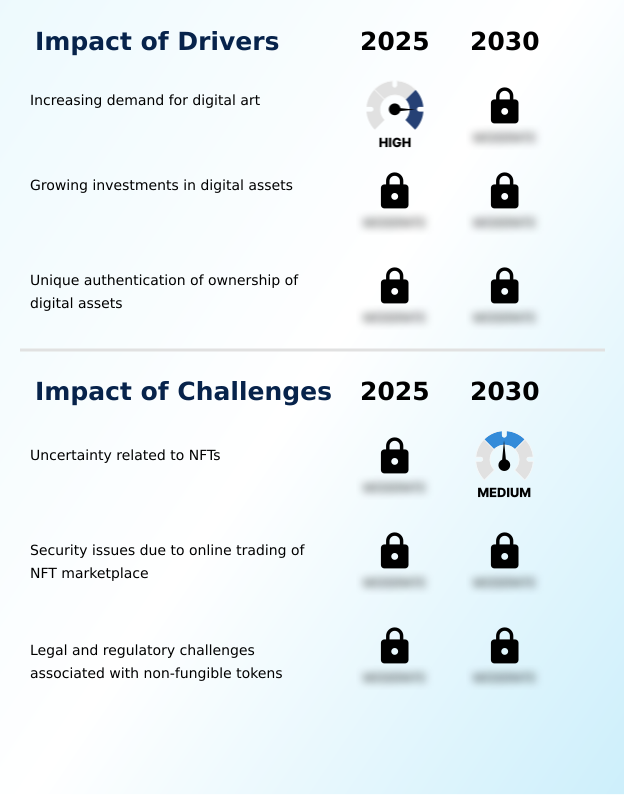
What are the key market drivers leading to the rise in the adoption of Non-fungible Token (NFT) Industry?
- The increasing demand for digital art, authenticated and secured by blockchain technology, serves as a primary driver for market growth.
- The market is primarily driven by the unique authentication capabilities of blockchain technology, which uses a digital signature to create an immutable ledger of ownership.
- This verifiable digital provenance addresses digital duplication issues, empowering creators through automated royalty standards and direct-to-fan minting platforms. The adoption of smart contracts facilitates user-generated content monetization and novel play-to-earn economics, expanding the creator economy.
- For instance, platforms integrating these models report a 60% higher user activity rate. Furthermore, applications are extending to art authentication services, music rights management, and supply chain verification, where transparency has reduced counterfeit instances by up to 80%.
- The ongoing DeFi and NFT convergence is also unlocking new financial instruments and liquidity options.
What are the market trends shaping the Non-fungible Token (NFT) Industry?
- A significant market trend is the growing interest from major brands, which are increasingly integrating non-fungible tokens into their core strategies. This adoption is aimed at enhancing customer loyalty and fostering deeper brand engagement.
- A key trend reshaping customer loyalty is the use of dynamic NFTs for brand engagement metrics and token-gated commerce. Brands are moving beyond static collectibles to offer assets that grant exclusive access rights or unlock NFT-gated content, leading to a 35% increase in repeat customer interactions.
- The rise of virtual fashion and gaming asset interoperability is creating new revenue streams, supported by cross-chain bridges that enhance user experience. Technical advancements in generative art algorithms and digital watermarking are improving asset uniqueness, while a shift toward energy-efficient consensus mechanisms addresses sustainability concerns.
- The reliability of these systems, underscored by rapid transaction finality, makes them viable for long-term strategic initiatives, with adoption in enterprise settings growing by over 50% annually.
What challenges does the Non-fungible Token (NFT) Industry face during its growth?
- Persistent uncertainty surrounding valuation models, regulatory frameworks, and technological longevity poses a significant challenge to the industry's sustained growth.
- Significant challenges persist, primarily around security and regulatory ambiguity. The reliance on non-custodial wallets requires robust user-side wallet security protocols, as breaches are often irreversible. Platforms face vulnerabilities that necessitate rigorous smart contract auditing, a process that can increase development costs by 20%.
- The complexity of intellectual property management and digital identity solutions in a decentralized environment creates legal hurdles, while flawed cross-chain asset transfer mechanisms have led to substantial losses. Furthermore, DAO governance structures remain experimental, and a lack of standardized NFT analytics platforms complicates valuation.
- While layer-2 scaling and zero-knowledge proofs offer technical solutions, their adoption is uneven, and achieving carbon-neutral minting at scale presents an ongoing operational challenge for the tokenization of assets.
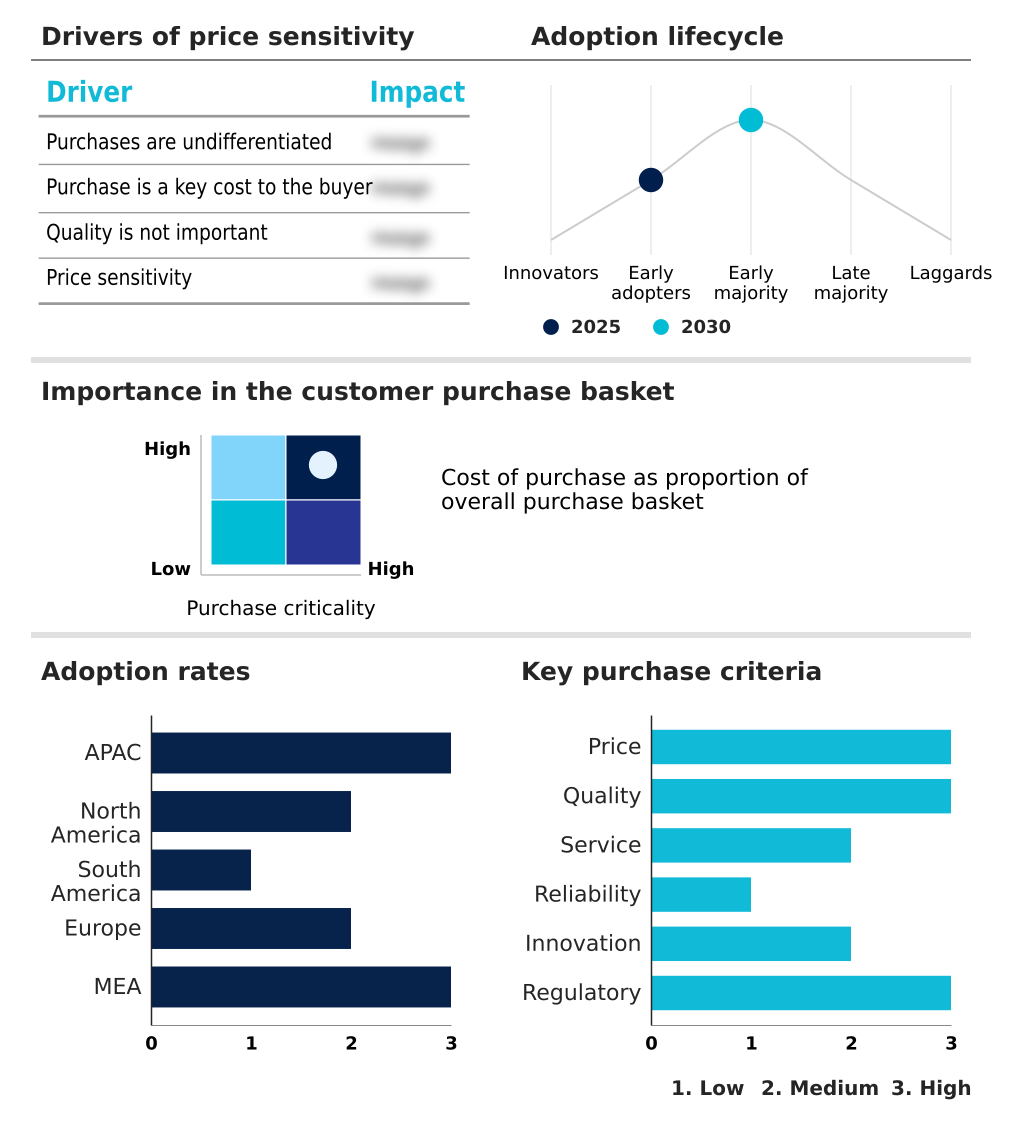
Exclusive Technavio Analysis on Customer Landscape
The non-fungible token (nft) market forecasting report includes the adoption lifecycle of the market, covering from the innovator’s stage to the laggard’s stage. It focuses on adoption rates in different regions based on penetration. Furthermore, the non-fungible token (nft) market report also includes key purchase criteria and drivers of price sensitivity to help companies evaluate and develop their market growth analysis strategies.
Customer Landscape of Non-fungible Token (NFT) Industry
Competitive Landscape
Companies are implementing various strategies, such as strategic alliances, non-fungible token (nft) market forecast, partnerships, mergers and acquisitions, geographical expansion, and product/service launches, to enhance their presence in the industry.
AirNFTs Platform - Analysis indicates a focus on platforms for programmable digital art, enabling dynamic, interactive creations with layered ownership features for creators and collectors.
The industry research and growth report includes detailed analyses of the competitive landscape of the market and information about key companies, including:
- AirNFTs Platform
- Asynchronous Art Inc.
- Axie Infinity
- Binance Holdings Ltd.
- Blockchain App Factory
- Celer Network
- Chaincella
- Decentraland Foundation
- Enjin Pte. Ltd.
- Foundation Labs Inc.
- Funko Inc.
- Gemini Trust Co. LLC
- Mintable Pte. Ltd.
- Ozone Networks Inc.
- Rarible Inc.
- Sky Mavis
- SuperRare Labs Inc.
Qualitative and quantitative analysis of companies has been conducted to help clients understand the wider business environment as well as the strengths and weaknesses of key industry players. Data is qualitatively analyzed to categorize companies as pure play, category-focused, industry-focused, and diversified; it is quantitatively analyzed to categorize companies as dominant, leading, strong, tentative, and weak.
Recent Development and News in Non-fungible token (nft) market
- In August 2024, Gemini Trust Co. LLC announced the full implementation of mandatory Know Your Customer (KYC) protocols across its NFT marketplace, responding to a joint directive from global regulators to enhance anti-money laundering compliance.
- In November 2024, Binance Holdings Ltd. launched a strategic partnership with a leading social media platform to integrate a native NFT marketplace, providing direct asset trading capabilities to an estimated 500 million active users.
- In January 2025, Sky Mavis, the developer behind Axie Infinity, introduced a USD 2 billion ecosystem fund aimed at scaling infrastructure projects on its Ronin Network, specifically targeting solutions that bridge decentralized finance with gaming assets.
- In March 2025, Decentraland Foundation released a new open-source protocol enabling the fractional ownership of high-value virtual real estate parcels, allowing thousands of small investors to collectively own and govern prime digital land.
Dive into Technavio’s robust research methodology, blending expert interviews, extensive data synthesis, and validated models for unparalleled Non-fungible Token (NFT) Market insights. See full methodology.
| Market Scope | |
|---|---|
| Page number | 284 |
| Base year | 2025 |
| Historic period | 2020-2024 |
| Forecast period | 2026-2030 |
| Growth momentum & CAGR | Accelerate at a CAGR of 34.8% |
| Market growth 2026-2030 | USD 136170.0 million |
| Market structure | Fragmented |
| YoY growth 2025-2026(%) | 30.6% |
| Key countries | China, Japan, India, South Korea, Australia, Indonesia, US, Canada, Mexico, Brazil, Argentina, Colombia, Germany, UK, France, Italy, Spain, The Netherlands, Saudi Arabia, UAE, South Africa, Israel and Turkey |
| Competitive landscape | Leading Companies, Market Positioning of Companies, Competitive Strategies, and Industry Risks |
Research Analyst Overview
- The non-fungible token (NFT) market is advancing beyond simple crypto collectibles toward sophisticated applications underpinned by blockchain technology. Core to this evolution are smart contracts, enabling digital provenance and tokenization of assets with a verifiable digital signature on an immutable ledger.
- Boardroom decisions increasingly focus on selecting the right infrastructure, weighing consensus mechanisms and layer-2 scaling solutions, which can reduce transaction costs by up to 95%. Interoperability protocols and cross-chain bridges are critical for creating seamless decentralized applications. Security remains a priority, driving demand for smart contract auditing and advanced wallet security protocols.
- As the market matures, metadata standards, royalty standards, and digital scarcity models are becoming more refined on minting platforms. Innovations like dynamic NFTs, phygital asset linkage, and generative art algorithms, alongside decentralized storage and zero-knowledge proofs, are expanding the utility of virtual assets and governance tokens on the public ledger.
What are the Key Data Covered in this Non-fungible Token (NFT) Market Research and Growth Report?
-
What is the expected growth of the Non-fungible Token (NFT) Market between 2026 and 2030?
-
USD 136.17 billion, at a CAGR of 34.8%
-
-
What segmentation does the market report cover?
-
The report is segmented by Application (Collectibles, Sports, Arts, and Others), End-user (Personal, and Commercial), Type (Digital asset, and Physical asset) and Geography (APAC, North America, South America, Europe, Middle East and Africa)
-
-
Which regions are analyzed in the report?
-
APAC, North America, South America, Europe and Middle East and Africa
-
-
What are the key growth drivers and market challenges?
-
Increasing demand for digital art, Uncertainty related to NFTs
-
-
Who are the major players in the Non-fungible Token (NFT) Market?
-
AirNFTs Platform, Asynchronous Art Inc., Axie Infinity, Binance Holdings Ltd., Blockchain App Factory, Celer Network, Chaincella, Decentraland Foundation, Enjin Pte. Ltd., Foundation Labs Inc., Funko Inc., Gemini Trust Co. LLC, Mintable Pte. Ltd., Ozone Networks Inc., Rarible Inc., Sky Mavis and SuperRare Labs Inc.
-
Market Research Insights
- The market's dynamics are shaped by a rapid shift toward tangible NFT utility and value, moving beyond speculative trading. The growth of community-driven projects and creator economy platforms is central to this evolution. Major brands are deploying digital loyalty programs that leverage exclusive access rights, reporting a 40% uplift in customer retention compared to conventional rewards systems.
- The emergence of play-to-earn economics in gaming and the convergence of DeFi and NFT convergence are creating new monetization avenues. For instance, metaverse integration has become a key strategic focus, with investments in virtual real estate markets showing returns that outperform certain traditional asset classes by over 2x in early-adopter scenarios.
- The trend toward fractionalized real assets is also increasing market liquidity and accessibility.
We can help! Our analysts can customize this non-fungible token (nft) market research report to meet your requirements.
 RIA -
RIA - 
