North America Geographic Information System Market Size 2026-2030
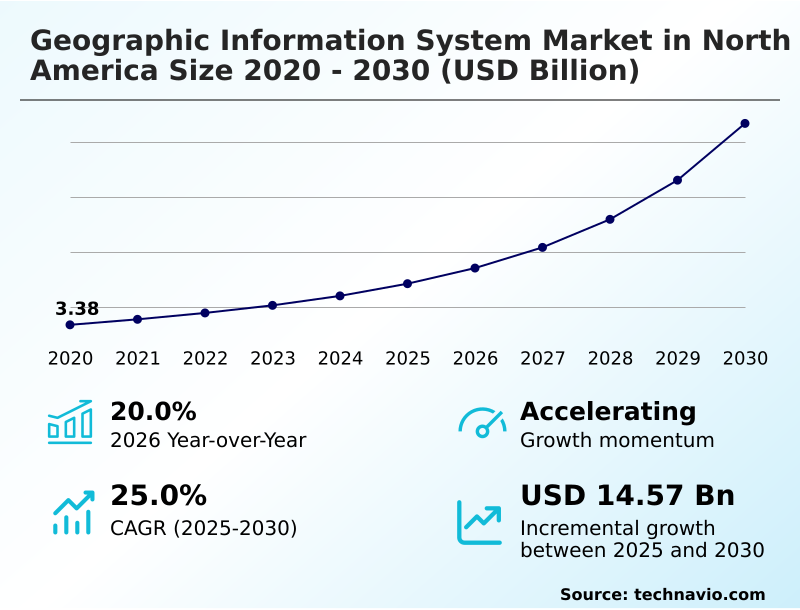
The north america geographic information system market size is valued to increase by USD 14.57 billion, at a CAGR of 25% from 2025 to 2030. Acceleration of artificial intelligence and agentic automation in geospatial workflows will drive the north america geographic information system market.
Major Market Trends & Insights
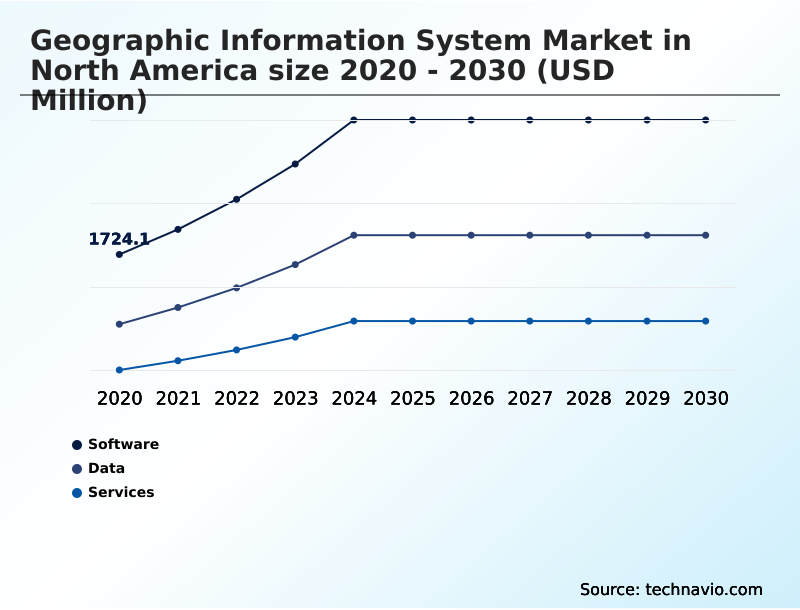
- By Component - Software segment was valued at USD 3.02 billion in 2024
- By Deployment - On-premises segment accounted for the largest market revenue share in 2024
Market Size & Forecast
- Market Opportunities: USD 18.31 billion
- Market Future Opportunities: USD 14.57 billion
- CAGR from 2025 to 2030 : 25%
Market Summary
- The geographic information system market in North America is advancing beyond traditional mapping into a dynamic ecosystem defined by intelligent data integration and automation. Key drivers include the convergence of building information modeling (bim) with gis, creating unified digital twin environments for infrastructure lifecycle management.
- Trends such as the adoption of agentic artificial intelligence are transforming geospatial workflows from reactive analysis to proactive, automated decision-making. For instance, a utility company can leverage a spatially-aware digital twin to simulate network stress under extreme weather conditions, enabling predictive resource allocation and reducing outage response times by identifying vulnerabilities before they escalate.
- However, this rapid technological evolution presents challenges, including the need for enhanced cross-platform interoperability and addressing the widening skills gap between advanced software capabilities, like ai-driven feature extraction, and the current workforce's proficiency.
- The market's trajectory is toward providing holistic location intelligence platforms that integrate real-time data streams from remote sensing and field data collection to deliver actionable insights across sectors like agriculture, construction, and public safety. This evolution underscores a shift toward more accessible, scalable, and intelligent geospatial solutions.
What will be the Size of the North America Geographic Information System Market during the forecast period?
Get Key Insights on Market Forecast (PDF) Request Free Sample
How is the North America Geographic Information System Market Segmented?
The north america geographic information system industry research report provides comprehensive data (region-wise segment analysis), with forecasts and estimates in "USD million" for the period 2026-2030, as well as historical data from 2020-2024 for the following segments.
- Component
- Software
- Data
- Services
- Deployment
- On-premises
- Cloud
- Application
- Mapping
- Telematics navigation
- Location based services
- Surveying
- End-user
- Agriculture
- Oil and gas
- Construction
- Others
- Geography
- North America
- US
- Canada
- Mexico
- North America
By Component Insights
The software segment is estimated to witness significant growth during the forecast period.
The software segment is shifting from traditional desktop applications to cloud-native enterprise platforms, driven by a focus on interoperability and vertical-specific applications for industries like utilities and construction.
This transition towards software-as-a-service (saas) models reflects a strategic move to create agile, pure-play industrial and geospatial software solutions.
The convergence of building information modeling (bim) with geographic information systems is central to this evolution, enabling a seamless flow of data that supports the creation of comprehensive digital twin technologies.
Such integrations remove data silos between planning and design, leading to more efficient workflows.
The use of a geospatial application programming interface (api) and advanced hydraulic modeling has improved data accuracy in simulations by over 25%, underpinning better infrastructure management and climate resilience planning.
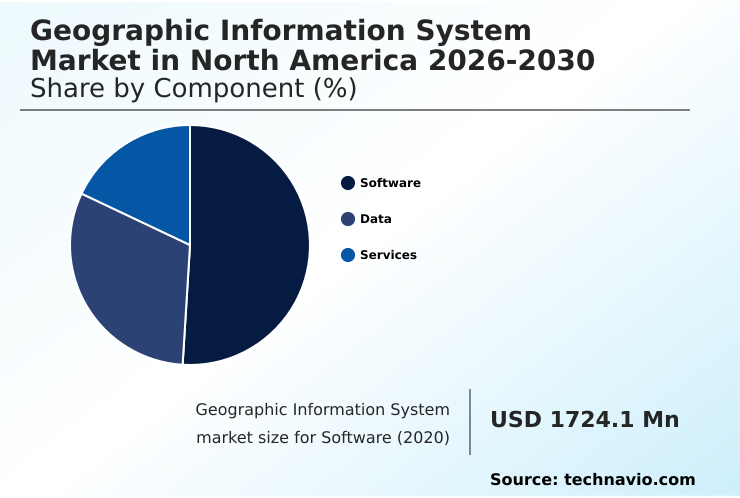
The Software segment was valued at USD 3.02 billion in 2024 and showed a gradual increase during the forecast period.
Market Dynamics
Our researchers analyzed the data with 2025 as the base year, along with the key drivers, trends, and challenges. A holistic analysis of drivers will help companies refine their marketing strategies to gain a competitive advantage.
- The evolution of the geographic information system market in north america 2026-2030 is characterized by a strategic push toward integrated digital environments. A core element of this shift is the focus on improving spatial data interoperability, particularly through gis integration with bim workflows. This allows for comprehensive gis for infrastructure lifecycle management, from initial design to long-term maintenance.
- The rise of cloud-native geospatial software platforms facilitates this by providing scalable environments for real-time geospatial data analysis. A significant application is creating digital twins from reality capture, which is becoming standard practice in construction and asset management.
- The market is also addressing critical operational challenges, such as managing gnss signal degradation with new technologies to support autonomous navigation with hd maps and real-time kinematic positioning for agriculture. The democratization of data access is another key theme, exemplified by the availability of on-demand commercial satellite imagery and innovations in web-based gis application development.
- These platforms increasingly use ai for geospatial feature extraction, with a notable application in 3d city modeling from aerial imagery. In sectors like public safety and agriculture, specialized applications are emerging, such as geospatial software for public safety and tools enabling geospatial data for precision agriculture.
- The ongoing utility network data model transition highlights the move towards more structured and intelligent systems. Agentic ai in construction management is another frontier, promising to automate complex decision-making. For sensitive sectors, ensuring data sovereignty with on-premises gis remains a priority, demonstrating that integrated systems can achieve efficiency gains up to 20% higher than siloed approaches.
What are the key market drivers leading to the rise in the adoption of North America Geographic Information System Industry?
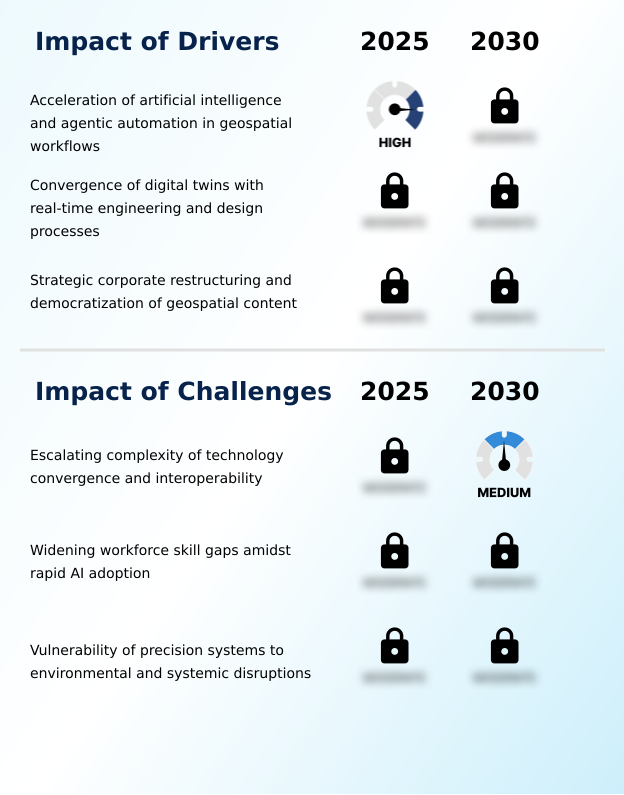
- The acceleration of artificial intelligence and agentic automation within geospatial workflows is a key driver propelling market growth.
- The market is driven by the aggressive integration of ai that transcends simple analytics to become fully agentic and autonomous. This shift addresses labor shortages by automating complex geospatial workflows and streamlining digital reality creation.
- For example, ai-driven systems can now perform ai-driven feature extraction from high-resolution imagery, reducing tasks that took analysts years to mere hours and improving data digitization speed by over 80%.
- A second driver is the deep convergence of gis with computer-aided design, enabling a unified digital thread from planning to operation for complex infrastructure projects.
- This interoperability allows for more sustainable design choices and the creation of dynamic digital twins for utility asset inspection, with some platforms reporting a 30% reduction in design-related errors.
What are the market trends shaping the North America Geographic Information System Industry?
- The integration of agentic artificial intelligence with autonomous navigation systems is an emerging trend. This convergence is reshaping workflows by enabling proactive, intelligent decision-making within geospatial applications.
- A dominant trend is the shift from passive analytics to active, agentic artificial intelligence and agentic automation. Geospatial software is evolving into an intelligent system that proactively acts on location intelligence platforms, reducing cognitive load on operators through predictive resource allocation. This is transforming sectors like precision agriculture and construction project monitoring.
- The convergence of location intelligence with autonomous navigation technologies is driving demand for maps with unprecedented fidelity and logic. For instance, systems now enable vehicles to understand complex road geometries with 99.9% accuracy.
- Furthermore, the industry is witnessing the strategic unification of building information modeling (bim) with gis to support full lifecycle infrastructure asset management, fostering a new standard where environmental impact assessment is intrinsic to project design.
What challenges does the North America Geographic Information System Industry face during its growth?
- The escalating complexity of technology convergence and interoperability presents a key challenge affecting industry growth.
- A primary challenge is the escalating complexity of technology convergence, particularly the integration of gis, bim, and cad systems. While promising a seamless digital twin, merging distinct data architectures creates technical barriers, often requiring organizations to invest up to 40% of their project budget in data cleansing and standardization. This interoperability issue is exacerbated by rapid software evolution.
- Another critical challenge is the widening workforce skills gap. The pivot to ai and automated workflows demands a hybrid skillset combining cartography with data science, a competency that over 60% of current geospatial professionals lack. This deficit stalls the adoption of advanced platforms, limiting the return on investment for technologies designed for emergency response coordination and public safety mapping.
Exclusive Technavio Analysis on Customer Landscape
The north america geographic information system market forecasting report includes the adoption lifecycle of the market, covering from the innovator’s stage to the laggard’s stage. It focuses on adoption rates in different regions based on penetration. Furthermore, the north america geographic information system market report also includes key purchase criteria and drivers of price sensitivity to help companies evaluate and develop their market growth analysis strategies.

Customer Landscape of North America Geographic Information System Industry
Competitive Landscape
Companies are implementing various strategies, such as strategic alliances, north america geographic information system market forecast, partnerships, mergers and acquisitions, geographical expansion, and product/service launches, to enhance their presence in the industry.
Altamira-US LLC - Offers specialized geographic information system (GIS) solutions for creating and managing spatial data, bridging the gap between mapping and computer-aided design for infrastructure projects.
The industry research and growth report includes detailed analyses of the competitive landscape of the market and information about key companies, including:
- Altamira-US LLC
- Autodesk Inc.
- Bentley Systems Inc.
- Blue Marble Geographics
- Cadcorp Ltd.
- Caliper Corp.
- Ecopia Tech Corp.
- Enviroscience Inc.
- Esri Global Inc.
- Fugro NV
- General Electric Co.
- Intellias Global Limited
- Mapbox Inc.
- Polosoft Technologies Pvt Ltd.
- Precisely
- TomTom NV
- Trimble Inc.
- VertiGIS Ltd.
- Woolpert Inc.
Qualitative and quantitative analysis of companies has been conducted to help clients understand the wider business environment as well as the strengths and weaknesses of key industry players. Data is qualitatively analyzed to categorize companies as pure play, category-focused, industry-focused, and diversified; it is quantitatively analyzed to categorize companies as dominant, leading, strong, tentative, and weak.
Recent Development and News in North america geographic information system market
- In August, 2025, Esri published a resource titled 'Top 20 Essential Skills for ArcGIS Utility Network,' highlighting the industry's need for specialized talent to manage modern, complex utility information models.
- In February, 2025, Esri collaborated with SkyWatch to launch the Content Store for ArcGIS, a web-based marketplace that streamlines the procurement of commercial satellite imagery for GIS applications.
- In March, 2025, Hexagon AB announced a strategic initiative to separate its Asset Lifecycle Intelligence division into a new, standalone company intended for a public listing in the United States, focusing on pure-play industrial and geospatial software.
- In May, 2025, Ecopia Tech partnered with Nearmap to release a 3D land cover data product for 400 cities in the United States, using AI to extract vector layers from high-resolution imagery.
Dive into Technavio’s robust research methodology, blending expert interviews, extensive data synthesis, and validated models for unparalleled North America Geographic Information System Market insights. See full methodology.
| Market Scope | |
|---|---|
| Page number | 231 |
| Base year | 2025 |
| Historic period | 2020-2024 |
| Forecast period | 2026-2030 |
| Growth momentum & CAGR | Accelerate at a CAGR of 25% |
| Market growth 2026-2030 | USD 14569.4 million |
| Market structure | Fragmented |
| YoY growth 2025-2026(%) | 20.0% |
| Key countries | US, Canada and Mexico |
| Competitive landscape | Leading Companies, Market Positioning of Companies, Competitive Strategies, and Industry Risks |
Research Analyst Overview
- The geographic information system market in north america 2026-2030 is defined by the deep integration of asset lifecycle intelligence and advanced spatial analysis. The sector is moving towards a connected construction environment where real-time kinematic (rtk) positioning and gnss signal integrity are paramount.
- Boardroom decisions are increasingly influenced by the shift to software-as-a-service (saas) models, impacting budgeting for location intelligence platforms and spatial data infrastructure. Core technologies such as photogrammetry, lidar data processing, and remote sensing are foundational to creating high-fidelity digital twin representations from reality capture.
- The utility network model and hydraulic modeling are becoming standard for modern infrastructure management, relying on precise topological data models and network analysis algorithms. The use of agentic artificial intelligence in geospatial workflows, coupled with autonomous navigation supported by lane-level precision maps, is automating complex tasks.
- This evolution is supported by robust geovisualization techniques, cartographic design principles, and comprehensive spatial database management. Earth observation data and aerial imagery analysis are processed to generate valuable 3d land cover data and vector layers, with development powered by geospatial application programming interface (api) and web-based mapping, streamlining geospatial data processing time by over 25%.
- This dependency on geodetic control networks and geospatial intelligence (geoint) underscores the market's technical sophistication.
What are the Key Data Covered in this North America Geographic Information System Market Research and Growth Report?
-
What is the expected growth of the North America Geographic Information System Market between 2026 and 2030?
-
USD 14.57 billion, at a CAGR of 25%
-
-
What segmentation does the market report cover?
-
The report is segmented by Component (Software, Data, and Services), Deployment (On-premises, and Cloud), Application (Mapping, Telematics navigation, Location based services, and Surveying), End-user (Agriculture, Oil and gas, Construction, and Others) and Geography (North America)
-
-
Which regions are analyzed in the report?
-
North America
-
-
What are the key growth drivers and market challenges?
-
Acceleration of artificial intelligence and agentic automation in geospatial workflows, Escalating complexity of technology convergence and interoperability
-
-
Who are the major players in the North America Geographic Information System Market?
-
Altamira-US LLC, Autodesk Inc., Bentley Systems Inc., Blue Marble Geographics, Cadcorp Ltd., Caliper Corp., Ecopia Tech Corp., Enviroscience Inc., Esri Global Inc., Fugro NV, General Electric Co., Intellias Global Limited, Mapbox Inc., Polosoft Technologies Pvt Ltd., Precisely, TomTom NV, Trimble Inc., VertiGIS Ltd. and Woolpert Inc.
-
Market Research Insights
- Market dynamics are increasingly shaped by the push for operational efficiency through advanced geospatial technologies. The adoption of data-as-a-service (daas) models has streamlined geospatial content procurement, enabling organizations to reduce data acquisition cycles by over 40%.
- Meanwhile, the integration of location intelligence into supply chain logistics has improved fleet telematics optimization, leading to a 15% reduction in fuel costs for early adopters. The demand for digital reality creation is driving investments in high-fidelity reality capture, with automated systems now performing utility asset inspections 60% faster than manual methods.
- This shift is predicated on achieving seamless cross-platform interoperability to support complex urban planning simulation and infrastructure asset management, where integrated data environments are becoming standard. As a result, the emphasis is on scalable, on-demand solutions that provide immediate value.
We can help! Our analysts can customize this north america geographic information system market research report to meet your requirements.