North America Maintenance, Repair, And Overhaul (MRO) Distribution Market Size 2025-2029
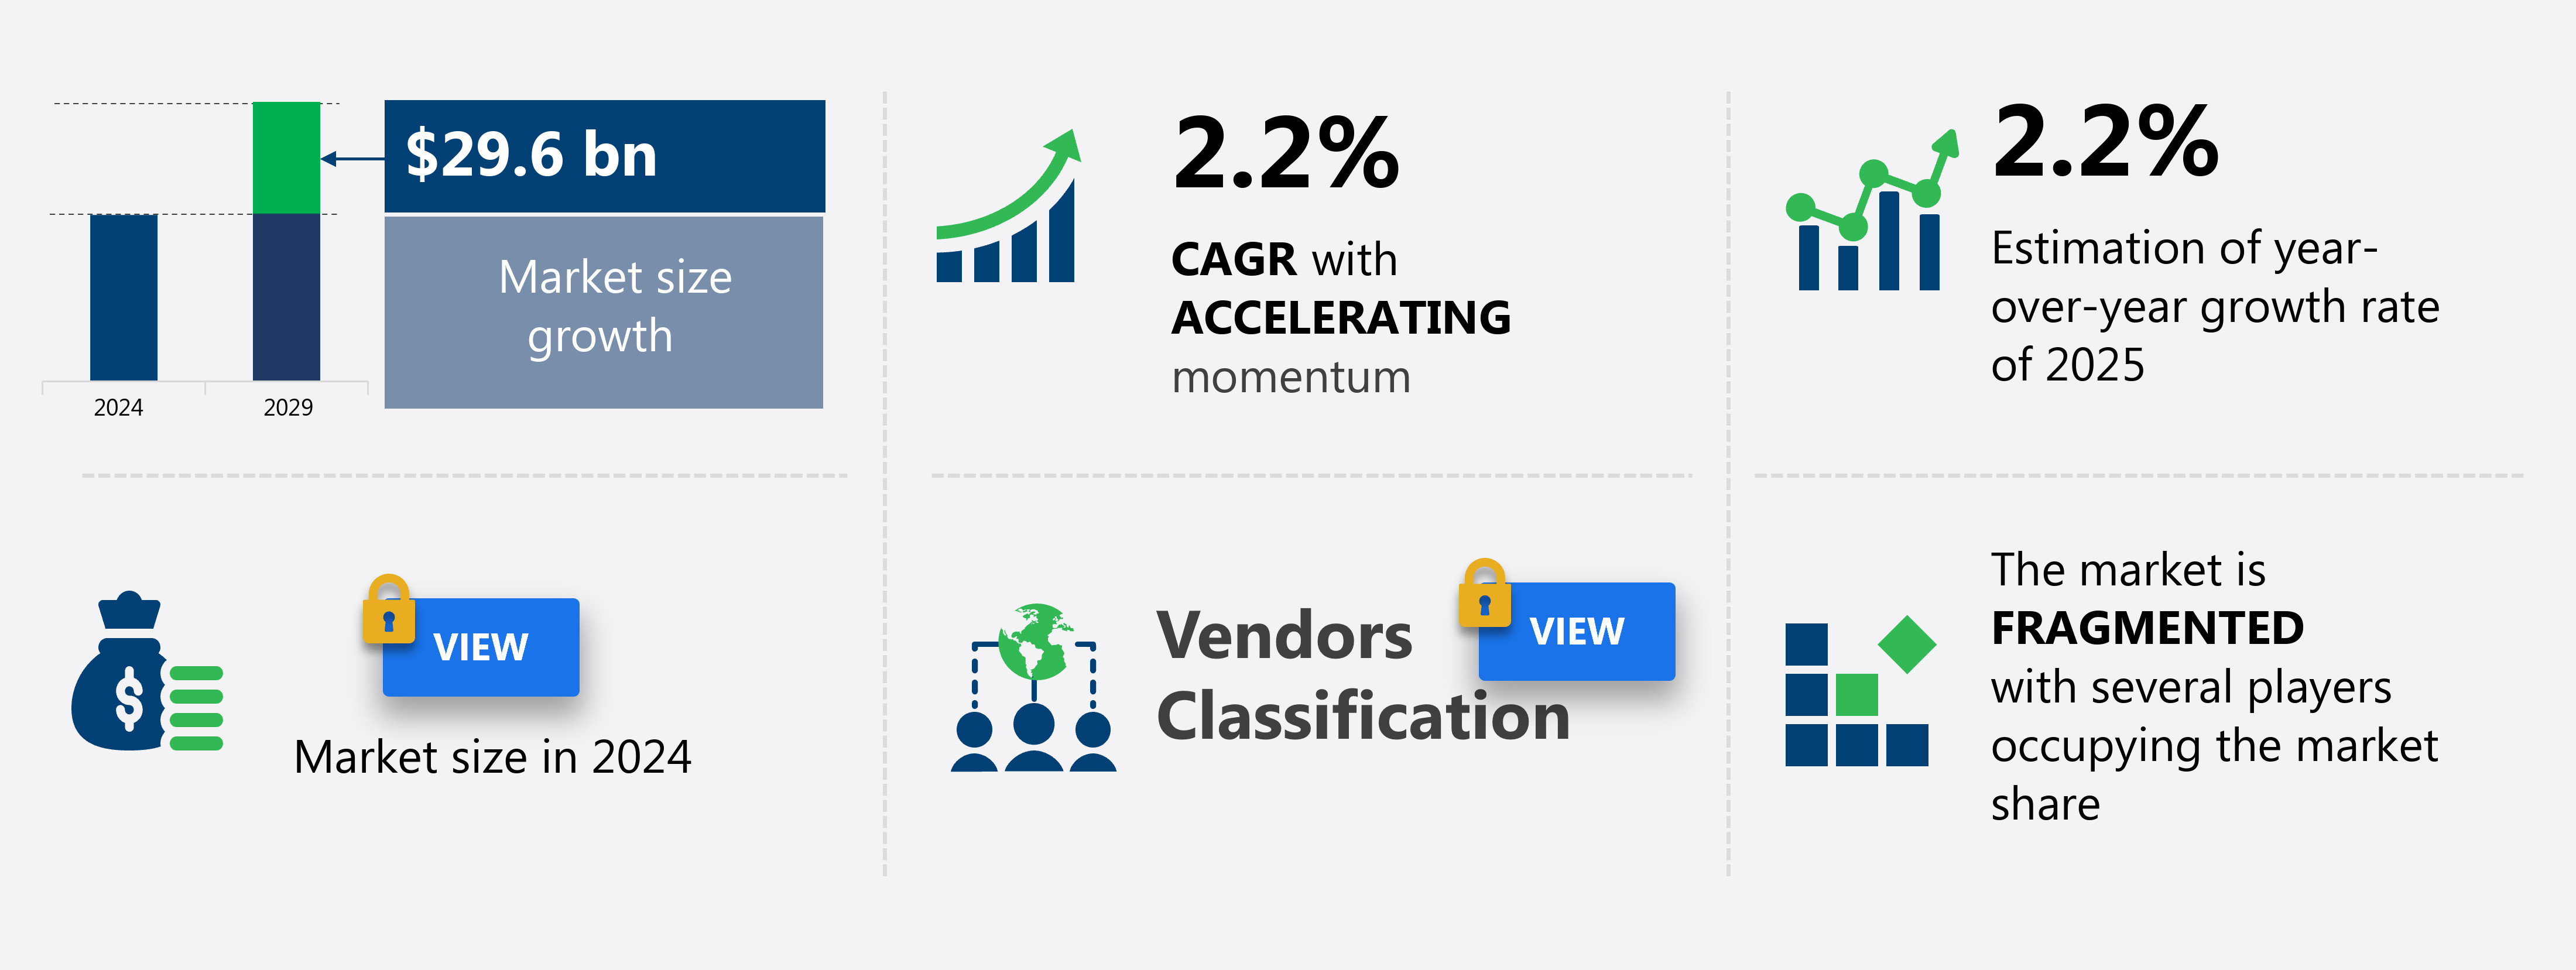
The north america maintenance, repair, and overhaul (mro) distribution market size is valued to increase USD 29.6 billion, at a CAGR of 2.2% from 2024 to 2029. Increasing penetration of Industry 4.0 will drive the north america maintenance, repair, and overhaul (mro) distribution market.
Major Market Trends & Insights
- By Application - Chemicals segment was valued at USD billion in
- By Type - Industrial segment accounted for the largest market revenue share in
- CAGR from 2024 to 2029 : 2.2%
Market Summary
- The market is a dynamic and continually evolving sector, driven by the increasing adoption of core technologies such as Industry 4.0 Smart equipment technology. This innovation enables real-time performance tracking and predictive maintenance, addressing the issue of weak or missing MRO processes in various industries. According to a recent study, the North American MRO market is projected to account for over 30% of the global MRO market share.
- However, challenges persist, including complex supply chains, regulatory compliance, and the need for standardization. Despite these hurdles, opportunities abound, particularly in the areas of digital transformation, sustainability, and customized solutions. As the market continues to unfold, stakeholders must stay informed of the latest trends and developments to remain competitive.
What will be the Size of the North America Maintenance, Repair, And Overhaul (MRO) Distribution Market during the forecast period?
Get Key Insights on Market Forecast (PDF) Request Free Sample
How is the Maintenance, Repair, And Overhaul (MRO) Distribution in North America Market Segmented ?
The maintenance, repair, and overhaul (mro) distribution in north america industry research report provides comprehensive data (region-wise segment analysis), with forecasts and estimates in "USD billion" for the period 2025-2029, as well as historical data from 2019-2023 for the following segments.
- Application
- Chemicals
- Transportation
- Food beverage and tobacco
- Electricals and electronics
- Others
- Type
- Industrial
- Electrical
- Facility
- Others
- Service Type
- Maintenance services
- Repair services
- Inspection services
- Distribution Channel
- Original equipment manufacturers
- Aftermarket
- Geography
- North America
- US
- Canada
- Mexico
- North America
By Application Insights
The chemicals segment is estimated to witness significant growth during the forecast period.
MRO distribution is a critical component of the chemical industry, supplying essential products and equipment for maintaining and repairing production processes. Key MRO products include pumps, valves, hoses, gaskets, and other spare parts. Efficient MRO distribution is crucial for chemical plants to minimize downtime, reduce equipment failure risks, and ensure compliance with safety regulations. For instance, OSHA mandates the use of safety equipment in US chemical plants to protect workers from hazardous chemicals. To optimize MRO distribution, chemical companies employ various strategies. These include field service management systems with data analytics dashboards for real-time inventory visibility, predictive maintenance using digital twin technology, and repair workflow automation.
MRO parts distribution networks are designed for quick and efficient spare parts procurement, with e-commerce platform integration, inventory turnover rate optimization, and demand forecasting models. Quality control procedures are implemented through company performance metrics, maintenance scheduling software, inventory management systems, and logistics and warehousing solutions. Advanced technologies like robotics in warehousing, blockchain technology integration, and 3D printing applications streamline the order fulfillment process. MRO distribution also focuses on supply chain optimization and resilience, employing risk management strategies, last-mile delivery optimization, and warehouse automation systems. Artificial intelligence and big data analytics are used to enhance supply chain performance, reduce equipment downtime, and improve customer relationship management.
Overall, MRO distribution plays a vital role in the chemical industry, ensuring the smooth operation of production processes while maintaining safety and regulatory compliance.
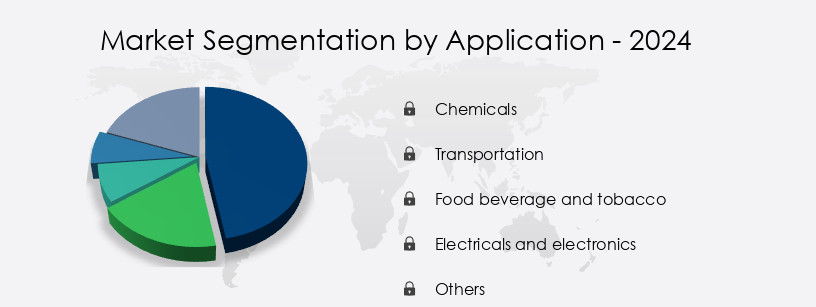
The Chemicals segment was valued at USD billion in 2019 and showed a gradual increase during the forecast period.
Market Dynamics
Our researchers analyzed the data with 2024 as the base year, along with the key drivers, trends, and challenges. A holistic analysis of drivers will help companies refine their marketing strategies to gain a competitive advantage.
The North American MRO distribution market is experiencing a significant digital transformation, with an increasing focus on integrated supply chain software solutions to optimize operations and enhance efficiency. Real-time inventory tracking systems and predictive maintenance software implementation are becoming the norm, enabling automated warehouse management systems to streamline spare parts distribution networks. MRO parts e-commerce platform integration is also on the rise, allowing for advanced analytics to inform data-driven decision-making and improve customer relationship management. Robust supply chain risk management is a critical priority, with optimized last-mile delivery solutions and effective field service management systems ensuring improved service level agreement compliance.
The market is witnessing a surge in the adoption of AI-powered demand forecasting for MRO, reducing equipment downtime and maintenance costs by predicting maintenance needs before they become critical. Optimized inventory management strategies are essential for maintaining a competitive edge, with a growing number of players focusing on sustainable MRO parts sourcing to reduce environmental impact. In contrast, traditional procurement processes are being automated to streamline workflows and ensure efficient repair and maintenance processes. A notable trend in the North American MRO distribution market is the adoption of digital technologies, with more than 70% of new initiatives focusing on enhancing operational efficiency and reducing costs.
This shift towards digital transformation is set to redefine the landscape, with a minority of players accounting for a significantly larger share of the high-end MRO distribution market. By prioritizing these digital advancements, North American MRO distribution companies are poised to reap the rewards of a more efficient, agile, and customer-centric business model.
What are the key market drivers leading to the rise in the adoption of Maintenance, Repair, And Overhaul (MRO) Distribution in North America Industry?
- The significant expansion of Industry 4.0 technologies is the primary catalyst for market growth. Industry 4.0, characterized by advanced automation and interconnected systems, is increasingly permeating various industries, leading to enhanced productivity, efficiency, and innovation.
- Industry 4.0, a revolutionary concept, transforms industrial manufacturing by enhancing efficiency, ensuring safety, and facilitating predictive machinery maintenance. Across the globe, industries embrace Industry 4.0 guidelines to optimize material flows and identify product errors early. Process automation, a pivotal Industry 4.0 component, is gaining traction in various sectors due to its minimal human intervention, increased throughput, efficiency, reliability, and safety benefits. Automation solutions serve as Industry 4.0's backbone, offering the ecosystem the necessary functionality. The inexorable expansion of Industry 4.0 into diverse industry verticals fuels the increasing demand for maintenance, repair, and operations (MRO) for automation solutions.
- This trend, in turn, propels the growth of the MRO distribution market in the US. The integration of Industry 4.0 and automation solutions continues to reshape manufacturing landscapes, promising significant advancements and profitability.
What are the market trends shaping the Maintenance, Repair, And Overhaul (MRO) Distribution in North America Industry?
- The use of advanced technology in smart equipment for tracking performance and maintenance requirements is currently a significant market trend. This innovation enables more efficient and effective management of equipment operations.
- In the industrial landscape, the traditional approach to maintenance involved adhering to manufacturers' guidelines and replacing parts based on predetermined schedules. However, this method was fraught with inefficiencies. Preventive maintenance led to premature part replacements and increased downtime due to reactive repairs. Inventory management, relying on guesswork, often resulted in surplus or insufficient stock. The emergence and widespread adoption of sensors and the Internet of Things (IoT) technology have significantly transformed this landscape. IoT-enabled devices provide real-time data on equipment performance and maintenance requirements, allowing manufacturers to optimize their maintenance strategies.
- This shift reduces unnecessary part replacements, minimizes downtime, and streamlines inventory management, resulting in substantial cost savings. The integration of sensors and IoT technology in maintenance processes represents a crucial evolution, enhancing operational efficiency and effectiveness across various industries.
What challenges does the Maintenance, Repair, And Overhaul (MRO) Distribution in North America Industry face during its growth?
- The absence or weakness of Maintenance, Repair, and Overhaul (MRO) processes is a significant challenge impeding industry growth. Effective MRO strategies are essential for ensuring operational efficiency, reducing downtime, and enhancing overall productivity within the industry.
- In the complex realm of maintenance, repair, and operations (MRO), managing the supply chain efficiently is a persistent challenge. Manufacturers, distributors, and shipping businesses each possess distinct MRO requirements, leading to fragmented processes. These gaps in MRO services are often a reflection of the limitations within enterprise resource planning (ERP) systems. Consequently, businesses face substantial additional costs and are compelled to devise their own solutions to address these shortcomings. One such process that frequently encounters challenges is kitting. To prevent production halts or downtime, work orders are meticulously assembled in the warehouse before deployment in the field.
- The absence or inefficiency of kitting processes can result in significant financial implications for businesses. By streamlining this process, organizations can minimize downtime, optimize inventory, and ultimately, improve overall operational efficiency.
Exclusive Technavio Analysis on Customer Landscape
The north america maintenance, repair, and overhaul (mro) distribution market forecasting report includes the adoption lifecycle of the market, covering from the innovator’s stage to the laggard’s stage. It focuses on adoption rates in different regions based on penetration. Furthermore, the north america maintenance, repair, and overhaul (mro) distribution market report also includes key purchase criteria and drivers of price sensitivity to help companies evaluate and develop their market growth analysis strategies.

Customer Landscape of Maintenance, Repair, And Overhaul (MRO) Distribution in North America Industry
Competitive Landscape
Companies are implementing various strategies, such as strategic alliances, north america maintenance, repair, and overhaul (mro) distribution market forecast, partnerships, mergers and acquisitions, geographical expansion, and product/service launches, to enhance their presence in the industry.
Adolf Wurth GmbH and Co. KG - This company specializes in the distribution of maintenance, repair, and overhaul solutions, encompassing a range of products such as fasteners, tools, safety equipment, and facility maintenance supplies. Their offerings cater to various industries, ensuring operational efficiency and safety.
The industry research and growth report includes detailed analyses of the competitive landscape of the market and information about key companies, including:
- Adolf Wurth GmbH and Co. KG
- Applied Industrial Technologies Inc.
- Bisco Industries
- DGI Supply
- Fastenal Co.
- Ferguson plc
- Harrington Industrial Plastics
- Hillman Solutions Corp.
- Hisco Inc.
- Lawson Products Inc.
- Lindberg and Lund
- MSC Industrial Direct Co. Inc.
- R.S. Hughes Co. Inc.
- Rexel
- Sonepar Group
- Stellar Industrial Supply
- WW Grainger Inc.
- Wajax Corp.
Qualitative and quantitative analysis of companies has been conducted to help clients understand the wider business environment as well as the strengths and weaknesses of key industry players. Data is qualitatively analyzed to categorize companies as pure play, category-focused, industry-focused, and diversified; it is quantitatively analyzed to categorize companies as dominant, leading, strong, tentative, and weak.
Recent Development and News in Maintenance, Repair, And Overhaul (MRO) Distribution Market In North America
- In January 2024, MRO distributor MSC Industrial Direct Company, Inc. Announced the acquisition of Val-Matic Valve & Actuator, a leading supplier of valves and actuators for the industrial and municipal markets, for approximately USD315 million. This strategic move expanded MSC's product offerings and strengthened its presence in the oil and gas, power, and water and wastewater industries (MSC Industrial Direct Company, Inc. Press release, 2024).
- In March 2024, Fastenal Company, another major MRO distributor, launched its new e-commerce platform, Fastenal.Com 3.0, featuring enhanced user experience, improved search capabilities, and expanded product offerings. This investment in digital transformation aimed to better serve its customers and increase competitiveness in the market (Fastenal Company press release, 2024).
- In April 2025, W.W. Grainger, Inc. And Amazon Business announced a strategic partnership to offer Amazon Business Prime customers access to Grainger's extensive MRO product catalog and services. This collaboration allowed Grainger to expand its reach and tap into Amazon's vast customer base, while Amazon Business gained access to Grainger's deep industry expertise and extensive product offerings (W.W. Grainger, Inc. Press release, 2025).
- In May 2025, the United States Environmental Protection Agency (EPA) announced the final rule on the Significant New Alternatives Policy (SNAP) Program, which phased out the use of hydrofluorocarbons (HFCs) in various applications, including MRO. This regulatory development aimed to reduce greenhouse gas emissions and promote the use of alternative refrigerants, creating opportunities for MRO distributors to offer eco-friendly solutions (EPA press release, 2025).
Dive into Technavio’s robust research methodology, blending expert interviews, extensive data synthesis, and validated models for unparalleled North America Maintenance, Repair, And Overhaul (MRO) Distribution Market insights. See full methodology.
|
Market Scope |
|
|
Report Coverage |
Details |
|
Page number |
196 |
|
Base year |
2024 |
|
Historic period |
2019-2023 |
|
Forecast period |
2025-2029 |
|
Growth momentum & CAGR |
Accelerate at a CAGR of 2.2% |
|
Market growth 2025-2029 |
USD 29.6 billion |
|
Market structure |
Fragmented |
|
YoY growth 2024-2025(%) |
2.2 |
|
Key countries |
US, Canada, and Mexico |
|
Competitive landscape |
Leading Companies, Market Positioning of Companies, Competitive Strategies, and Industry Risks |
Research Analyst Overview
- In the dynamic and evolving landscape of North American maintenance, repair, and overhaul (MRO) distribution, several trends are shaping the industry's future. Field service management is increasingly adopting data analytics dashboards to optimize repair workflows, enabling real-time inventory visibility and predictive maintenance. MRO parts distribution is undergoing a digital transformation, with e-commerce platform integration, blockchain technology, and digital twin technology streamlining supply chain resilience and optimizing logistics and warehousing. Asset tracking technology plays a crucial role in this evolution, ensuring efficient spare parts procurement and inventory turnover rate management. Predictive maintenance strategies, leveraging artificial intelligence and big data analytics, are reducing equipment downtime and improving service level agreements.
- Furthermore, risk management strategies, such as remote diagnostics tools and quality control procedures, are becoming essential components of effective MRO distribution networks. Distribution network design and optimization are also key areas of focus, with warehouse automation systems and robotics in warehousing enhancing order fulfillment processes. Demand forecasting models and company performance metrics are essential for procurement process efficiency and ensuring a responsive supply chain. Last-mile delivery optimization is another critical aspect, with 3D printing applications offering potential for on-demand parts production and reducing lead times. Product lifecycle management and customer relationship management are increasingly important in the MRO sector, with companies focusing on improving their supply chain optimization and supply chain resilience.
- Overall, these trends reflect the ongoing evolution of the MRO distribution market in North America, as it adapts to the demands of a data-driven, digitally connected business environment.
What are the Key Data Covered in this North America Maintenance, Repair, And Overhaul (MRO) Distribution Market Research and Growth Report?
-
What is the expected growth of the North America Maintenance, Repair, And Overhaul (MRO) Distribution Market between 2025 and 2029?
-
USD 29.6 billion, at a CAGR of 2.2%
-
-
What segmentation does the market report cover?
-
The report segmented by Application (Chemicals, Transportation, Food beverage and tobacco, Electricals and electronics, and Others), Type (Industrial, Electrical, Facility, and Others), Service Type (Maintenance services, Repair services, and Inspection services), Distribution Channel (Original equipment manufacturers and Aftermarket), and Geography (North America)
-
-
Which regions are analyzed in the report?
-
North America
-
-
What are the key growth drivers and market challenges?
-
Increasing penetration of Industry 4.0, Weak or missing MRO processes
-
-
Who are the major players in the Maintenance, Repair, And Overhaul (MRO) Distribution Market in North America?
-
Key Companies Adolf Wurth GmbH and Co. KG, Applied Industrial Technologies Inc., Bisco Industries, DGI Supply, Fastenal Co., Ferguson plc, Harrington Industrial Plastics, Hillman Solutions Corp., Hisco Inc., Lawson Products Inc., Lindberg and Lund, MSC Industrial Direct Co. Inc., R.S. Hughes Co. Inc., Rexel, Sonepar Group, Stellar Industrial Supply, WW Grainger Inc., and Wajax Corp.
-
Market Research Insights
- The North American MRO distribution market encompasses the supply of industrial parts, components, and services for the maintenance, repair, and overhaul of various industries' equipment. This dynamic market is characterized by continuous process improvement methodologies, supply chain visibility, and the adoption of lean management principles. According to industry estimates, the MRO parts market in North America is projected to reach USD150 billion by 2025, growing at a compound annual growth rate of 3.5%. In contrast, the industrial automation parts segment is projected to expand at a higher CAGR of 4.2% due to the increasing demand for automation in manufacturing processes.
- Effective contract negotiation strategies, sustainability initiatives, and inventory accuracy are essential for maintaining operational efficiency and reducing costs. Key performance indicators, such as lead time reduction, technology adoption, and on-time delivery, significantly impact customer satisfaction and profit margin improvement. Compliance regulations, supplier relationship management, risk mitigation, and pricing strategies are critical aspects of the MRO distribution landscape, ensuring a resilient and adaptive supply chain.
We can help! Our analysts can customize this north america maintenance, repair, and overhaul (mro) distribution market research report to meet your requirements.