
Pantographs Market in North America Size 2024-2028
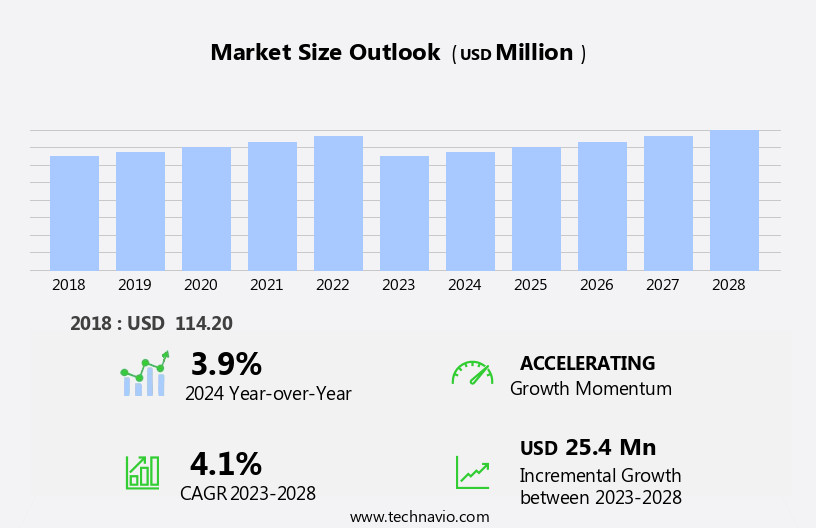
The North America pantographs market size is forecast to increase by USD 25.4 million at a CAGR of 4.1% between 2023 and 2028.
- The market is experiencing significant growth, driven primarily by the increasing number of contracts for infrastructure projects, particularly in the high-speed rail sector. This trend is expected to continue as governments and private entities invest heavily in modernizing transportation infrastructure. However, market participants face challenges in ensuring regulatory compliance, which can add complexity and cost to projects.
- Adhering to various regulations, including safety and environmental standards, is crucial for market entrants to secure contracts and maintain a strong reputation. As the market evolves, companies must stay informed of regulatory requirements and adapt their strategies accordingly to remain competitive. By focusing on innovation, collaboration, and regulatory compliance, market players can capitalize on the opportunities presented by the growing demand for North America's pantographs infrastructure development.
What will be the Size of the North America Pantographs Market during the forecast period?
- The North America's pantograph market continues to evolve, driven by advancements in technology and the expanding application across various sectors. Electric locomotives , Smart railway and commuter rail systems rely on pantographs to establish contact with the overhead contact line for traction power. Pantograph retrofitting is a growing trend, as older trains undergo upgrades to enhance efficiency and meet evolving safety and compliance regulations. Pantograph control systems ensure seamless contact with the contact wire, optimizing current collection and improving pantograph performance. Innovations in pantograph design, such as automation and spring-loaded mechanisms, enhance reliability and reduce wear and tear. High-speed rail systems require specialized pantographs to maintain contact at higher speeds, while urban rail and mass transit systems prioritize safety and compliance.
- Traction power and catenary systems undergo continuous optimization, with pantographs playing a crucial role in maintaining efficiency and minimizing downtime. Pantograph standardization and cost reduction are key focus areas, as the market adapts to the evolving needs of the rail industry. Electric multiple units and freight rail also benefit from pantograph technology, with ongoing research and development aimed at improving pantograph efficiency and reducing maintenance costs. The Pantographs in North America remains dynamic, with ongoing research and innovation shaping the future of railway electrification and rail transportation.
How is this North America Pantographs Industry segmented?
The North America Pantographs industry research report provides comprehensive data (region-wise segment analysis), with forecasts and estimates in "USD million" for the period 2024-2028, as well as historical data from 2018-2022 for the following segments.
- Type
- Single-arm pantographs
- Double-arm pantographs
- Application
- High-Speed Rail
- Freight Rail
- Urban Transit
- End-User
- Rail Operators
- OEMs
- Maintenance Providers
- Material
- Carbon
- Metal
- Composite
- Geography
- North America
- US
- Canada
- Mexico
- North America
By Type Insights
The single-arm pantographs segment is estimated to witness significant growth during the forecast period.
The North American pantograph market is characterized by the prevalence of single-arm pantographs, particularly in the electric locomotive sector. These pantographs offer improved reliability and efficiency by optimally connecting with single-phase AC overhead systems. Their distinctive Z-shaped design enhances performance with minimal power consumption from the contact lines. This efficiency is vital for the operational success of electric locomotives, which are gaining traction in North America due to their environmental advantages and cost-effectiveness. Urban rail and commuter systems also rely on single-arm pantographs for their high-performance and compatibility with various traction power systems. The pantograph certification process ensures safety and compliance with regulations, while pantograph simulation and modeling facilitate integration with the catenary system.
Innovations in pantograph technology include pantograph automation, electrification, and optimization, which enhance current collection and reduce wear and tear. Pantograph retrofitting and upgrading are also crucial for maintaining the efficiency and longevity of the pantograph system in freight rail applications.

The Single-arm pantographs segment was valued at USD 102.90 million in 2018 and showed a gradual increase during the forecast period.
Regional Analysis
North America is estimated to contribute 100% to the growth of the global market during the forecast period.Technavio's analysts have elaborately explained the regional trends and drivers that shape the market during the forecast period.

The North American pantograph market is witnessing notable growth, with the US leading the charge. This expansion is fueled by substantial investments in rail infrastructure, aimed at modernizing and expanding the country's rail systems. The US government's commitment to enhancing passenger rail services is evident through various funding initiatives and projects. For instance, on December 8, 2023, the Biden-Harris Administration allocated USD8.2 billion for ten major passenger rail projects, part of a broader USD66 billion investment under the Bipartisan Infrastructure Law. The primary objective of this investment is to establish the nation's first world-class high-speed rail systems.
Urban rail and commuter rail systems are also undergoing upgrades, with a focus on improving efficiency, safety, and compliance with regulations. Pantograph technology, including optimization, modeling, simulation, and control systems, plays a crucial role in these advancements. Pantograph reliability and life cycle are essential considerations for rail operators, with retrofits and upgrades being common solutions to address wear and tear. Mass transit and freight rail sectors are also adopting pantograph technology to enhance traction power and reduce dependence on diesel engines. Innovations in pantograph design, such as automation and electrification, are transforming the market. Standardization of pantograph systems and compliance with regulations, like those related to overhead contact lines and current collection, are essential for market growth.
Pantograph certification and safety are paramount, with regulations governing their integration into various rail applications. High-speed rail and electric locomotives are significant markets for pantograph technology, with efficiency and performance being key factors. Catenary systems and pantograph springs are essential components of these applications. In summary, the North American pantograph market is experiencing significant growth, driven by investments in rail infrastructure, advancements in pantograph technology, and a focus on safety, efficiency, and compliance.
Market Dynamics
Our researchers analyzed the data with 2023 as the base year, along with the key drivers, trends, and challenges. A holistic analysis of drivers will help companies refine their marketing strategies to gain a competitive advantage.
Pantographs market thrives with pantographs for electric trains and single-arm pantographs for rail. Pantograph market trends 2024 emphasize smart pantograph systems and pantographs for high-speed rail. Pantographs for freight locomotives and carbon composite pantographs drive demand, per pantograph market forecast. Pantographs with sensor technology leverage pantographs for electrified rail, while pantographs for urban transit ensure efficiency. Pantographs for commuter trains and pantographs for industrial rail enhance reliability. Pantographs for sustainable rail, advanced pantograph technologies, and pantograph supply chain optimize performance. Pantographs for regulatory compliance, pantographs for rail modernization, pantographs for global rail, pantographs for operational efficiency, and pantographs for B2B markets propel growth throughout forecast year.
What are the key market drivers leading to the rise in the adoption of North America Pantographs Industry?
- The expanding volume of contracts serves as the primary catalyst for market growth. North American pantograph market is witnessing significant growth due to the increasing number of infrastructure improvement contracts. These contracts play a crucial role in boosting the demand for advanced pantograph systems, which are vital for the efficient operation of electric trains and buses on catenary systems. For instance, on June 6, 2024, ABB E-Mobility was awarded a substantial contract by Metrolinx to supply pantograph charging systems for electrified buses serving seven transit agencies in Canada. This contract is part of a larger fleet electrification initiative and involves the delivery of around nine pantograph chargers, each capable of delivering up to 600 kW for on-route charging.The wear and tear on pantograph systems necessitates regular upgrades to ensure maximum efficiency and reliability, further driving market growth.
What are the market trends shaping the North America Pantographs Industry?
- High-speed rail development is gaining significant attention in the market, with an increased focus on this transportation mode. This trend reflects the growing demand for efficient and sustainable transportation solutions.
- The North American pantograph market is experiencing significant growth due to the increasing focus on urban rail and mass transit systems. The reliability and longevity of pantographs are crucial in this context, as they facilitate the connection between trains and overhead contact lines. The life cycle of pantographs is a critical factor in ensuring the efficiency and productivity of rail networks. To optimize pantograph performance and minimize downtime, simulation and modeling technologies are being employed. These tools enable engineers to test various scenarios and identify potential issues before implementation. Pantograph integration is another key area of development, as seamless integration with trains and overhead contact lines is essential for efficient and reliable operation.
- The certification process for pantograph technology is rigorous, ensuring that only high-quality products are used in rail systems. This focus on safety and reliability is a significant driver of market growth. The ongoing modernization of transportation infrastructure in North America, including federal investments in high-speed rail systems, is further fueling demand for advanced pantograph technology.
What challenges does the North America Pantographs Industry face during its growth?
- Compliance with regulatory requirements poses a significant challenge to the industry's growth trajectory. In order to maintain business operations and expand, companies must adhere to a complex web of regulations, ensuring they are in full compliance to avoid penalties and reputational damage.
- The North American pantographs market faces regulatory compliance as a significant challenge. Strict guidelines and standards set by organizations like the American Railway Engineering and Maintenance of Way Association (AREMA) ensure the safety and efficiency of rail systems. The AREMA Manual, specifically Chapters 28 and 33, outline best practices, such as maintaining a minimum clearance of 24-3 inches (7392 mm) above the rail for overhead electrification systems. These guidelines are essential for safety and operational efficiency but necessitate meticulous adherence during the design and implementation phases of pantograph systems. Pantograph control systems and lift mechanisms play a crucial role in ensuring pantograph safety and compliance.
- High-speed rail, electric locomotives, commuter rail, and traction power all rely on these systems. Innovations in pantograph technology, such as advanced control systems and improved lift mechanisms, enhance safety and operational efficiency. Regulatory bodies, including AREMA, set strict standards for pantograph safety and compliance. Manufacturers and operators must adhere to these guidelines to ensure the safe and efficient operation of rail systems. Pantograph retrofits and upgrades are common to meet these evolving requirements. In conclusion, the North American pantographs market is subject to rigorous regulatory compliance, which necessitates a strong focus on safety and operational efficiency. The implementation of best practices, such as those outlined in the AREMA Manual, and the adoption of innovative pantograph technologies contribute to the market's growth and success.
Exclusive Customer Landscape
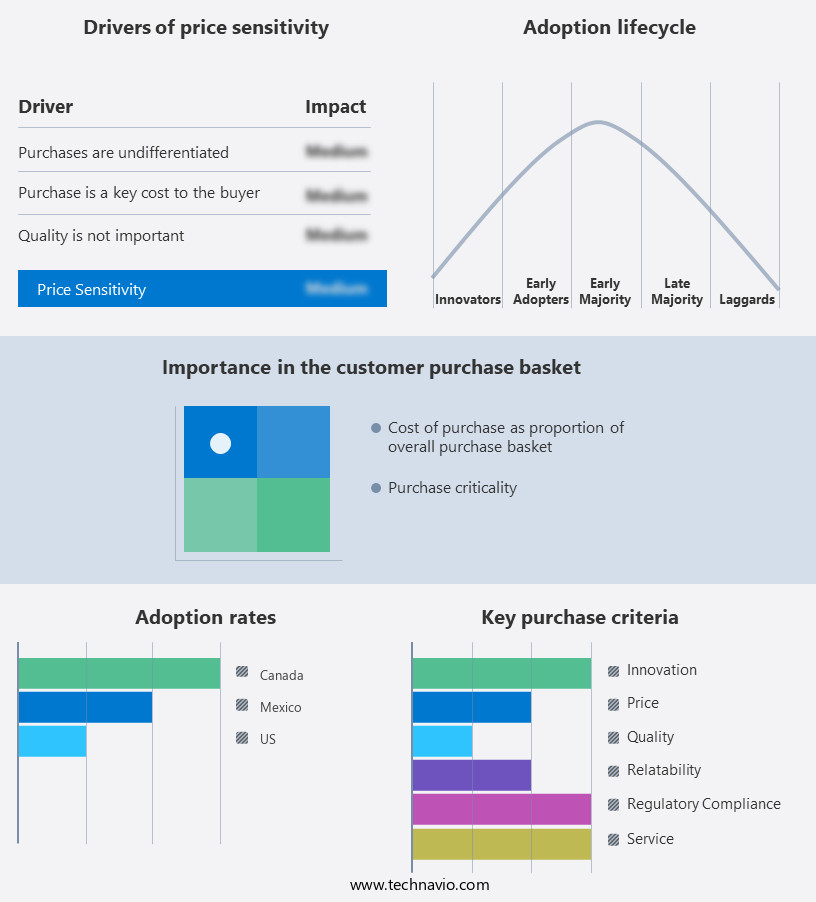
The pantographs market in North America forecasting report includes the adoption lifecycle of the market, covering from the innovator's stage to the laggard's stage. It focuses on adoption rates in different regions based on penetration. Furthermore, the pantographs market in North America report also includes key purchase criteria and drivers of price sensitivity to help companies evaluate and develop their market growth analysis strategies.
Customer Landscape
Key Companies & Market Insights
Companies are implementing various strategies, such as strategic alliances, pantographs market in North America forecast, partnerships, mergers and acquisitions, geographical expansion, and product/service launches, to enhance their presence in the industry.
Wabtec Corporation - Roof-mounted pantographs serve as essential components in capturing electricity from overhead power lines for propulsion purposes. These devices, featuring advanced technology, optimize energy transfer efficiency and enhance overall system performance. By extending and retracting to make contact with power lines, pantographs facilitate seamless and continuous power supply to vehicles in motion. This innovative solution contributes significantly to the sustainability and efficiency of transportation systems.
The industry research and growth report includes detailed analyses of the competitive landscape of the market and information about key companies, including:
- Wabtec Corporation
- Amsted Rail Company Inc.
- Progress Rail Services Corporation
- Electro-Motive Diesel Inc.
- Knorr-Bremse North America
- Faiveley Transport North America
- Hitachi Rail USA Inc.
- Siemens Mobility Inc.
- Alstom Transport Canada Inc.
- Bombardier Transportation
- Greenbrier Companies
- TrinityRail
- American Railcar Industries
- Kawasaki Rail Car Inc.
- Toshiba America Energy Systems
- Mitsubishi Electric Power Products Inc.
- ABB Inc.
- Schaeffler Group USA
- SKF USA Inc.
- Timken Company
Qualitative and quantitative analysis of companies has been conducted to help clients understand the wider business environment as well as the strengths and weaknesses of key industry players. Data is qualitatively analyzed to categorize companies as pure play, category-focused, industry-focused, and diversified; it is quantitatively analyzed to categorize companies as dominant, leading, strong, tentative, and weak.
Recent Development and News in North American Pantographs
- In February 2024, Pantographs Inc., a leading North American provider of 3D Holographic Display solutions, announced the launch of their latest product, the Pantograph P-Series, at the annual Consumer Electronics Show (CES) in Las Vegas. This innovative product line offers larger display sizes and improved resolution, expanding the company's product offerings and targeting the growing demand for immersive 3D experiences in various industries (Pantographs Inc. Press release, 2024).
- In May 2025, Pantographs formed a strategic partnership with Microsoft Corporation to integrate their holographic displays with Microsoft's HoloLens 3 augmented reality headsets. This collaboration aims to create a seamless user experience and broaden the potential applications for Pantographs' technology in fields such as education, healthcare, and manufacturing (Microsoft Corporation press release, 2025).
- In October 2024, Pantographs secured a significant funding round of USD50 million from prominent investors, including Intel Capital and Samsung Ventures. The funds will be used to accelerate research and development efforts, expand production capacity, and strengthen the company's market presence (Pantographs Inc. Press release, 2024).
- In March 2025, the U.S. Food and Drug Administration (FDA) granted clearance for the use of Pantographs' holographic displays in medical training and education. This approval marks a significant milestone for the company and opens up new opportunities in the healthcare sector (FDA press release, 2025).
Research Analyst Overview
The North American pantograph market is witnessing significant advancements in technology and performance optimization. Composite pantographs, made from advanced materials like Carbon Fiber, are gaining traction due to their lightweight properties and improved pantograph dynamics. Pantograph wear and vibration are critical concerns, leading to increased focus on pantograph insulation and lubrication for enhanced durability. Catenary maintenance and diagnostics are essential for ensuring reliable traction current flow and adherence to safety standards. Smart pantograph systems are revolutionizing the industry with real-time monitoring, data analysis, and predictive maintenance capabilities. Pantograph noise and pantograph stability are also key areas of research, with manufacturers exploring digital pantograph systems and aerodynamic designs to minimize disruptions and improve overall system efficiency.
Pantograph installation and commissioning processes continue to evolve, with a growing emphasis on safety standards and streamlined procedures. Pantograph suppliers are innovating to meet the evolving needs of the market, offering customized solutions for various applications and requirements. The pantograph industry trends reflect a shift towards sustainable, energy-efficient, and cost-effective solutions. Pantograph manufacturers are investing in research and development to address pantograph performance optimization, insulation, and wear issues, while also focusing on improving pantograph safety and reducing noise pollution.
Dive into Technavio's robust research methodology, blending expert interviews, extensive data synthesis, and validated models for unparalleled North America Pantographs Market insights. See full methodology.
|
Market Scope |
|
|
Report Coverage |
Details |
|
Page number |
154 |
|
Base year |
2023 |
|
Historic period |
2018-2022 |
|
Forecast period |
2024-2028 |
|
Growth momentum & CAGR |
Accelerate at a CAGR of 4.1% |
|
Market growth 2024-2028 |
USD 25.4 million |
|
Market structure |
Concentrated |
|
YoY growth 2023-2024(%) |
3.9 |
|
Key countries |
US, Canada, and Mexico |
|
Competitive landscape |
Leading Companies, Market Positioning of Companies, Competitive Strategies, and Industry Risks |
What are the Key Data Covered in this Pantographs Market in North America Research and Growth Report?
- CAGR of theNorth America Pantographs industry during the forecast period
- Detailed information on factors that will drive the growth and forecasting between 2024 and 2028
- Precise estimation of the size of the market and its contribution of the industry in focus to the parent market
- Accurate predictions about upcoming growth and trends and changes in consumer behaviour
- Growth of the market across North America
- Thorough analysis of the market's competitive landscape and detailed information about companies
- Comprehensive analysis of factors that will challenge the pantographs market in North America growth of industry companies
We can help! Our analysts can customize this pantographs market in North America research report to meet your requirements.