
North America Piping And Fittings Market Size 2026-2030
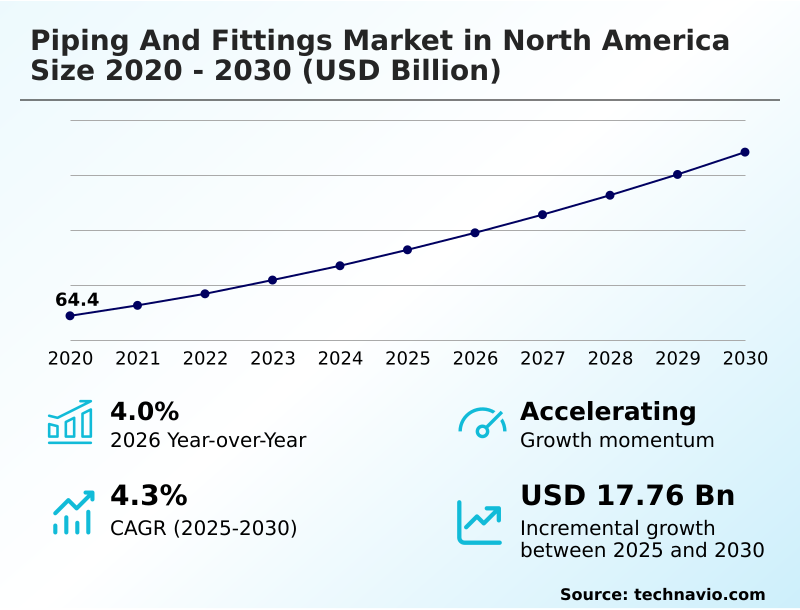
The north america piping and fittings market size is valued to increase by USD 17.76 billion, at a CAGR of 4.3% from 2025 to 2030. Expansion of commercial hydrogen infrastructure will drive the north america piping and fittings market.
Major Market Trends & Insights
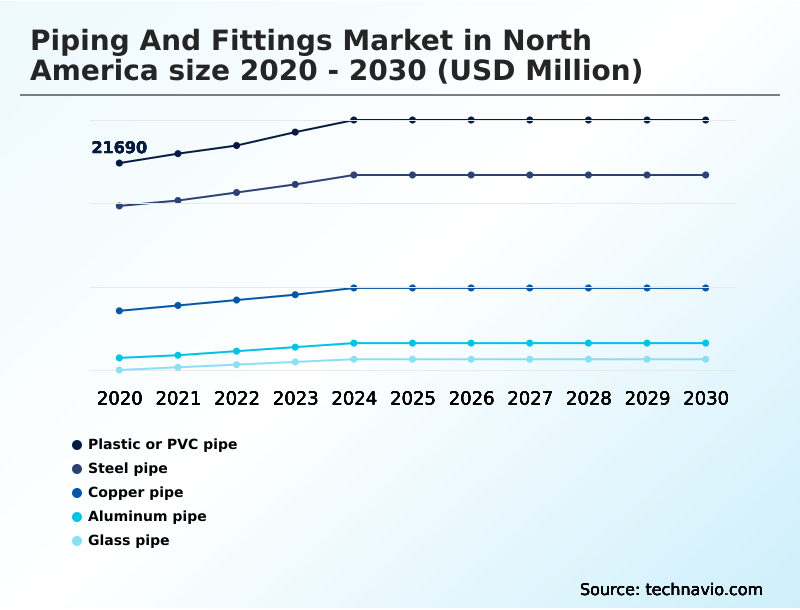
- By Material - Plastic or PVC pipe segment was valued at USD 24.89 billion in 2024
- By Application - Residential segment accounted for the largest market revenue share in 2024
Market Size & Forecast
- Market Opportunities: USD 29.76 billion
- Market Future Opportunities: USD 17.76 billion
- CAGR from 2025 to 2030 : 4.3%
Market Summary
- The piping and fittings market in North America is undergoing a significant transformation driven by the modernization of aging infrastructure and the expansion of high-tech industries. A primary driver is the urgent need to replace deteriorating municipal water networks, which spurs demand for durable materials like high-density polyethylene and ductile iron pipes.
- Concurrently, the rise of domestic semiconductor manufacturing necessitates the use of ultrapure water systems and high-purity polymers to prevent contamination in sensitive processes. For instance, a municipal utility could deploy smart piping systems embedded with acoustic and thermal sensors to enable condition-based monitoring, reducing water loss from undetected leaks and improving operational oversight without extensive manual inspections.
- This shift toward intelligent, high-performance fluid transport systems is complemented by the trend of off-site manufacturing, where prefabricated modular designs are assembled in controlled environments to ensure quality and streamline on-site installation.
- However, the industry grapples with a scarcity of skilled tradespeople capable of installing and maintaining these increasingly complex systems, alongside volatility in raw material pricing that complicates long-term project planning.
What will be the Size of the North America Piping And Fittings Market during the forecast period?
Get Key Insights on Market Forecast (PDF) Get Free Sample
How is the North America Piping And Fittings Market Segmented?
The north america piping and fittings industry research report provides comprehensive data (region-wise segment analysis), with forecasts and estimates in "USD million" for the period 2026-2030, as well as historical data from 2020-2024 for the following segments.
- Material
- Plastic or PVC pipe
- Steel pipe
- Copper pipe
- Aluminum pipe
- Glass pipe
- Application
- Residential
- Commercial
- Others
- Type
- Pipes
- Fittings
- Others
- Geography
- North America
- US
- Canada
- Mexico
- North America
By Material Insights
The plastic or pvc pipe segment is estimated to witness significant growth during the forecast period.
The plastic or pvc pipe segment is defined by its superior corrosion resistance and installation efficiency, making it a primary choice for water and wastewater management.
Materials such as high-density polyethylene and chlorinated polyvinyl chloride offer enhanced durability and a smoother internal surface, which improves flow efficiency and reduces long-term operational costs.
The lightweight nature of plastic pipe and steel pipe significantly cuts logistical expenses and simplifies on-site handling, contributing to faster project completion times. This advantage is critical in both residential applications and large-scale commercial applications.
For instance, the adoption of advanced polymer solutions can accelerate installation schedules by up to 25% compared to traditional metallic systems, driving its adoption in modern building construction and chemical processing across North America.
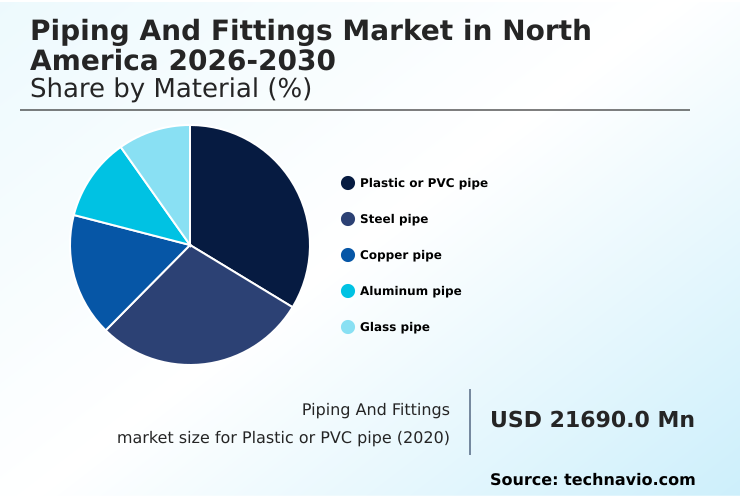
The Plastic or PVC pipe segment was valued at USD 24.89 billion in 2024 and showed a gradual increase during the forecast period.
Market Dynamics
Our researchers analyzed the data with 2025 as the base year, along with the key drivers, trends, and challenges. A holistic analysis of drivers will help companies refine their marketing strategies to gain a competitive advantage.
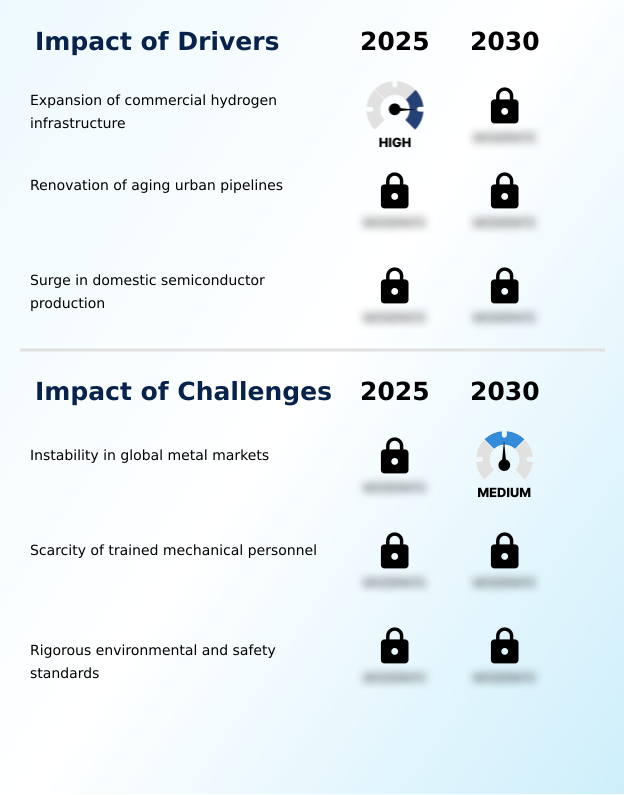
- Strategic decision-making in the piping and fittings market in North America is increasingly nuanced, balancing diverse and highly specific end-user requirements. The need for high strength fittings for hydrogen infrastructure, for example, involves materials engineered to counter hydrogen embrittlement, a completely different challenge from providing specialized pipes for semiconductor manufacturing, where preventing micro-contamination is the primary goal.
- The renovation of aging urban pipelines continues to drive demand for durable polymer solutions for infrastructure, while commercial construction projects are rapidly adopting prefabricated modules for commercial buildings to accelerate timelines and improve quality control. This trend is enhanced by the use of modular plumbing for commercial buildings, which simplifies complex installations.
- The market is also addressing environmental and safety standards compliance by developing advanced materials. Challenges such as the instability in global metal markets and the scarcity of trained mechanical personnel are compelling the industry to innovate. Solutions like push-fit fittings for commercial applications and grooved mechanical joints for flexibility help mitigate the labor gap.
- Projects incorporating prefabricated systems consistently report completion schedules that are weeks ahead of traditional on-site construction methods, underscoring the shift toward industrialized processes.
What are the key market drivers leading to the rise in the adoption of North America Piping And Fittings Industry?
- The expansion of commercial hydrogen infrastructure is a key market driver, stimulating demand for new fluid transport systems.
- Market growth is propelled by large-scale infrastructure renewal and the expansion of advanced industrial sectors.
- The urgent need to modernize municipal water networks, where some systems lose up to 25% of treated water, is driving demand for high-performance materials like high-density polyethylene.
- Simultaneously, the growth of the hydrogen economy creates demand for specialized fluid transport systems that can manage hydrogen embrittlement.
- In the electronics industry, new semiconductor fabs require ultrapure water systems with purity levels over 100 times greater than municipal supplies, necessitating the use of high-purity polymers and advanced orbital welding techniques.
- These high-value applications are fostering innovation in fusion welding techniques and chlorinated polyvinyl chloride formulations to meet stringent performance and safety standards.
What are the market trends shaping the North America Piping And Fittings Industry?
- The integration of digital sensing technology represents a significant market trend. This evolution involves embedding sensors directly into pipes and fittings to enable continuous monitoring of structural integrity.
- Key trends are reshaping the market, with a strong emphasis on efficiency and intelligence. The integration of digital sensing for structural integrity is paramount, utilizing acoustic and thermal sensors for proactive condition-based monitoring. This shift away from scheduled maintenance is enabling operators to pinpoint and address potential failures before they escalate.
- In construction, building information modeling is facilitating the use of prefabricated modular designs, which has been shown to reduce material waste by over 15%. This off-site manufacturing approach, combined with innovative joining methods like push-to-connect fittings and grooved joints, streamlines on-site work.
- For infrastructure renewal, non-invasive repair technologies like cured-in-place piping offer a less disruptive alternative, further optimizing asset lifecycles and reducing downtime.
What challenges does the North America Piping And Fittings Industry face during its growth?
- Instability in global metal markets presents a key challenge, affecting industry growth and heightening operational cost pressures.
- The market faces significant operational and regulatory headwinds. Instability in global commodity prices has resulted in project bid fluctuations of up to 20% within a single quarter, complicating procurement strategies and long-term financial planning. This is compounded by a persistent scarcity of trained mechanical personnel, with a projected industry shortfall of thousands of skilled workers.
- Additionally, evolving environmental regulations, such as restrictions on perfluoroalkyl substances and polyfluoroalkyl substances in polymer pipes, demand continuous investment in research for compliant chemical stabilizers. These factors create a complex operating environment, requiring companies to balance cost pressures with the need for innovation in areas like seismic protection and advanced material development.
Exclusive Technavio Analysis on Customer Landscape
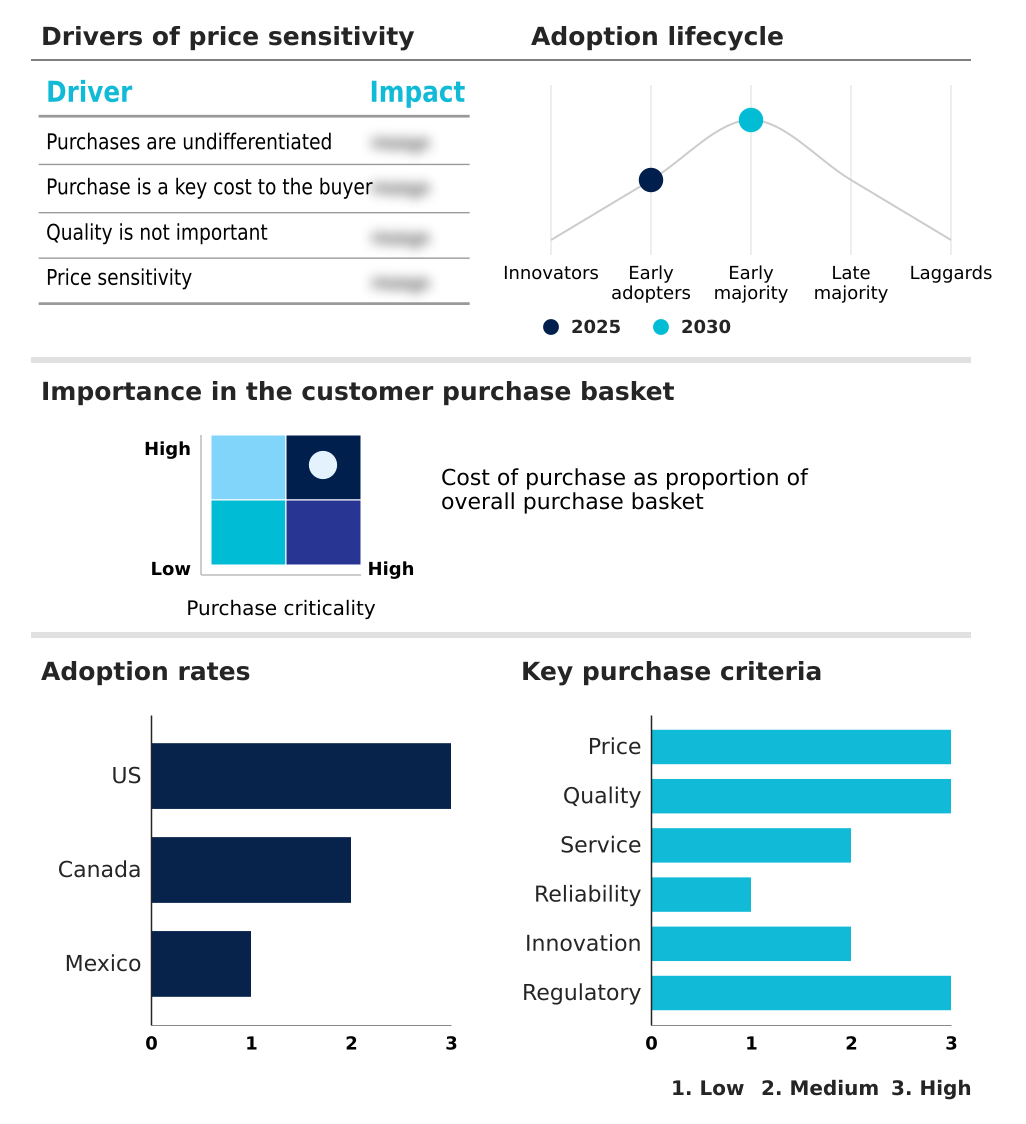
The north america piping and fittings market forecasting report includes the adoption lifecycle of the market, covering from the innovator’s stage to the laggard’s stage. It focuses on adoption rates in different regions based on penetration. Furthermore, the north america piping and fittings market report also includes key purchase criteria and drivers of price sensitivity to help companies evaluate and develop their market growth analysis strategies.
Customer Landscape of North America Piping And Fittings Industry
Competitive Landscape
Companies are implementing various strategies, such as strategic alliances, north america piping and fittings market forecast, partnerships, mergers and acquisitions, geographical expansion, and product/service launches, to enhance their presence in the industry.
Advanced Drainage Systems Inc - The company provides specialized thermoplastic piping systems and comprehensive water management solutions tailored for demanding infrastructure, industrial, and agricultural applications.
The industry research and growth report includes detailed analyses of the competitive landscape of the market and information about key companies, including:
- Advanced Drainage Systems Inc
- Aliaxis Holdings SA
- American Piping Products Inc.
- Atkore Inc.
- Charlotte Pipe and Foundry Co.
- Chevron Phillips Chemical Co.
- China Lesso Group Holdings
- Compagnie de Saint Gobain SA
- Georg Fischer Ltd.
- IPEX Inc.
- JM Eagle Inc.
- McWane Plant and Industrial
- Mueller Industries Inc.
- NIBCO Inc.
- Swagelok Co.
- United States Pipe and Foundry
- Viega GmbH and Co. KG
- Wavin BV
- Westlake Corp. Inc.
Qualitative and quantitative analysis of companies has been conducted to help clients understand the wider business environment as well as the strengths and weaknesses of key industry players. Data is qualitatively analyzed to categorize companies as pure play, category-focused, industry-focused, and diversified; it is quantitatively analyzed to categorize companies as dominant, leading, strong, tentative, and weak.
Recent Development and News in North america piping and fittings market
- In August 2024, JSW Group began a major expansion of its specialized tubular manufacturing capabilities to meet the stringent specifications required by the rapidly growing electronics manufacturing sector in the southwestern US.
- In September 2024, Nippon Steel Corp. reported that the rising cost of energy and raw material imports has forced a review of the pricing structures for its industrial piping products sold in the North American region.
- In October 2024, Kohler Co. initiated a series of community partnerships and vocational training programs to help bridge the skills gap by providing hands-on experience with the latest fitting technologies and digital tools.
- In November 2024, The Lubrizol Corp. provided a comprehensive update on its research into alternative chemical stabilizers for plastic piping that meet new environmental safety requirements mandated by regional authorities.
Dive into Technavio’s robust research methodology, blending expert interviews, extensive data synthesis, and validated models for unparalleled North America Piping And Fittings Market insights. See full methodology.
| Market Scope | |
|---|---|
| Page number | 207 |
| Base year | 2025 |
| Historic period | 2020-2024 |
| Forecast period | 2026-2030 |
| Growth momentum & CAGR | Accelerate at a CAGR of 4.3% |
| Market growth 2026-2030 | USD 17763.0 million |
| Market structure | Fragmented |
| YoY growth 2025-2026(%) | 4.0% |
| Key countries | US, Canada and Mexico |
| Competitive landscape | Leading Companies, Market Positioning of Companies, Competitive Strategies, and Industry Risks |
Research Analyst Overview
- The piping and fittings market in North America is defined by a strategic pivot toward intelligent infrastructure and material science innovation. The integration of digital sensing for structural integrity is no longer a niche concept but a central pillar of modern asset management, compelling boardroom-level decisions on capital expenditure and long-term operational budgeting.
- Systems incorporating acoustic and thermal sensors are enabling a transition from reactive repairs to proactive, condition-based monitoring. Early adopters have reported reductions in unplanned system downtime by as much as 40%. This shift is supported by material advancements, from high-density polyethylene and chlorinated polyvinyl chloride that offer superior corrosion resistance to high-purity polymers essential for ultrapure water systems.
- Innovations such as fusion welding techniques, which create robust leak-proof joints, and the use of prefabricated modular designs, planned via building information modeling, are fundamentally reshaping installation workflows. These advancements are critical for addressing challenges like hydrogen embrittlement in energy applications and ensuring purity in semiconductor manufacturing through techniques like orbital welding.
What are the Key Data Covered in this North America Piping And Fittings Market Research and Growth Report?
-
What is the expected growth of the North America Piping And Fittings Market between 2026 and 2030?
-
USD 17.76 billion, at a CAGR of 4.3%
-
-
What segmentation does the market report cover?
-
The report is segmented by Material (Plastic or PVC pipe, Steel pipe, Copper pipe, Aluminum pipe, and Glass pipe), Application (Residential, Commercial, and Others), Type (Pipes, Fittings, and Others) and Geography (North America)
-
-
Which regions are analyzed in the report?
-
North America
-
-
What are the key growth drivers and market challenges?
-
Expansion of commercial hydrogen infrastructure, Instability in global metal markets
-
-
Who are the major players in the North America Piping And Fittings Market?
-
Advanced Drainage Systems Inc, Aliaxis Holdings SA, American Piping Products Inc., Atkore Inc., Charlotte Pipe and Foundry Co., Chevron Phillips Chemical Co., China Lesso Group Holdings, Compagnie de Saint Gobain SA, Georg Fischer Ltd., IPEX Inc., JM Eagle Inc., McWane Plant and Industrial, Mueller Industries Inc., NIBCO Inc., Swagelok Co., United States Pipe and Foundry, Viega GmbH and Co. KG, Wavin BV and Westlake Corp. Inc.
-
Market Research Insights
- Market dynamics are shaped by a pronounced shift toward solutions that enhance installation efficiency and system longevity. The adoption of prefabricated modular designs has been demonstrated to reduce on-site labor needs by up to 30%, directly addressing the persistent shortage of skilled tradespeople.
- In parallel, the use of push-to-connect fittings can decrease installation times by more than 50% compared to traditional welding or soldering methods. This focus on speed and reliability is crucial as the industry supports complex fluid transport systems for emerging sectors.
- As off-site manufacturing becomes more prevalent, the demand for advanced leak detection technology and robust building management systems integration is also rising, ensuring the integrity and performance of these sophisticated networks from day one.
We can help! Our analysts can customize this north america piping and fittings market research report to meet your requirements.
 RIA -
RIA - 
