North America System Integration Services Market Size 2024-2028
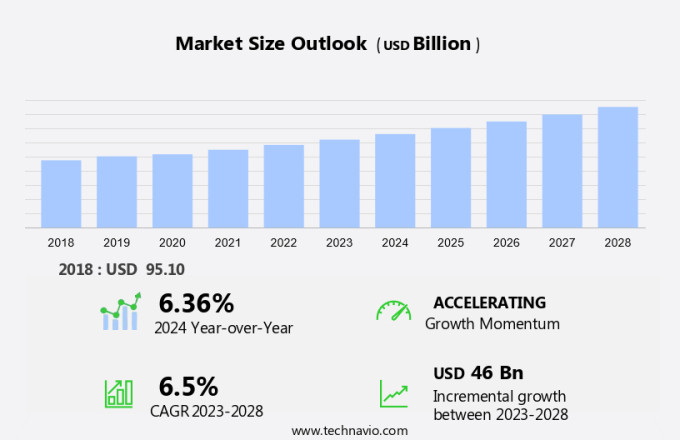
The North America system integration services market size is forecast to increase by USD 46 billion at a CAGR of 6.5% between 2023 and 2028. The market is experiencing significant growth due to the increasing need for enhanced business process efficiency. The adoption of cloud-based integration solutions, such as Google Cloud, is on the rise as businesses seek to streamline operations and improve data integration. Interoperability concerns continue to be a major challenge, particularly in industries like IT and telecom, defense and security, oil and gas, healthcare, transportation, retail, food and beverages, automotive, and more. To address these challenges, system integrators are leveraging advanced technologies like AI and IoT to deliver data-driven insights and improve overall system performance. In the retail sector, for instance, AI-powered integration solutions are being used to analyze customer data and personalize shopping experiences. Similarly, in the automotive industry, IoT-enabled integration is enabling real-time vehicle monitoring and predictive maintenance.
The market is experiencing significant growth, driven by the increasing adoption of digital transformations and IoT technologies across various industries. IT and telecom, defense and security, oil and gas, healthcare, transportation, retail, food and beverages, automotive, and banking are some sectors witnessing substantial investments in system integration services. Google Cloud, a leading cloud services provider, is playing a crucial role in this growth by offering expert IT infrastructure services, including system integration, hardware, software, and network resources. These services enable businesses to seamlessly integrate new software applications and cloud-based services into their existing IT infrastructure.
Furthermore, the integration of AI and IoT technologies is further fueling the demand for system integration services. In industries such as defense, marine systems, telecommunication, aviation, and others, the need for digital infrastructure solutions is increasing to enhance operational efficiency, ensure security, and improve customer experience. System integrators are essential partners in these digital transformations, helping businesses navigate complex IT landscapes and ensuring successful implementations. The market is poised for continued growth, offering numerous opportunities for IT professionals and computer-related occupations.
Market Segmentation
The market research report provides comprehensive data (region-wise segment analysis), with forecasts and estimates in "USD billion" for the period 2024-2028, as well as historical data from 2018-2022 for the following segments.
- Service Type
- Infrastructure integration services
- System integration consulting services
- ALM and application integration services
- End-user
- BFSI
- Government
- Telecom
- Retail
- Others
- Geography
- North America
- Canada
- Mexico
- US
- North America
By Service Type Insights
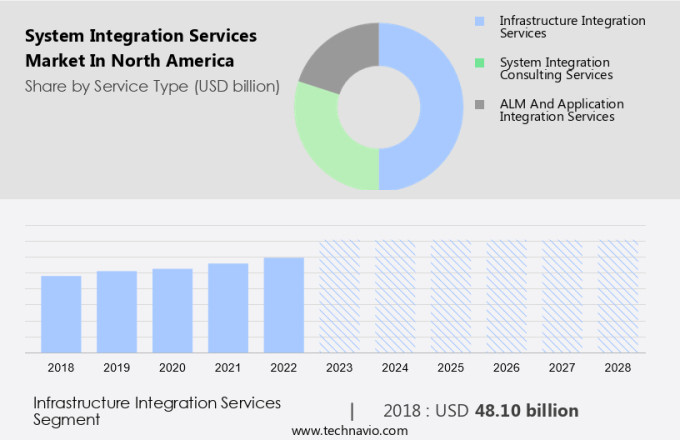
The infrastructure integration services segment is estimated to witness significant growth during the forecast period. In today's digital landscape, North American businesses are investing heavily in advanced IT solutions to keep pace with the rapidly evolving technological landscape. Legacy infrastructure poses a significant challenge in delivering high-quality services, especially when it comes to deploying modern applications. To address this issue, system integration services have gained prominence, enabling seamless linking of sub-systems with smart devices for efficient data access within and outside enterprises. These services play a crucial role in ensuring operational excellence and business continuity by facilitating data connectivity, process orchestration, and infrastructure integration. Furthermore, the adoption of predictive modeling, AI-driven insights, and automation necessitates the need for system integration to ensure seamless data flow between applications.
Furthermore, security audits and access controls are essential components of system integration services, ensuring data privacy and security. Edge computing and hardware integration are also becoming increasingly important, as organizations look to leverage data from IoT devices and other edge sources. Consulting services are often required to optimize the integration process and ensure that businesses fully realize the benefits of their IT investments. In summary, system integration services are a vital component of digital transformation initiatives, enabling businesses to effectively manage their complex IT landscapes and drive operational efficiency.
Get a glance at the market share of various segments Request Free Sample
The infrastructure integration services segment accounted for USD 48.10 billion in 2018 and showed a gradual increase during the forecast period.
Our market researchers analyzed the data with 2023 as the base year, along with the key drivers, trends, and challenges. A holistic analysis of drivers will help companies refine their marketing strategies to gain a competitive advantage.
Key Market Driver
The need for enhanced business process efficiency is notably driving market growth. The Market is witnessing significant growth due to the increasing adoption of advanced technologies in various industries. Engineering services providers play a crucial role in this sector, enabling seamless integration of different systems and technologies.
Moreover, smart city projects and industrial automation are major areas driving the demand for system integration services. In the realm of fintech startups, there is a growing need for efficient and reliable system integration to ensure seamless operations and customer experience. System integration services enable the smooth functioning of complex technology ecosystems, thereby contributing to the overall growth and efficiency of businesses. Thus, such factors are driving the growth of the market during the forecast period.
Significant Market Trends
Increased adoption of cloud-based integration solutions is the key trend in the market. The Market is experiencing significant growth due to the increasing adoption of advanced technologies in various industries. Engineering services providers play a pivotal role in this sector, enabling seamless integration of these technologies into businesses. Smart city projects and industrial automation are major areas driving the demand for system integration services.
Moreover, in the realm of fintech startups, the need for efficient and secure technology integration is paramount to ensure seamless operations and customer experience. System integration services facilitate the smooth functioning of diverse technologies, thereby enhancing overall productivity and efficiency. Thus, such trends will shape the growth of the market during the forecast period.
Major Market Challenge
Interoperability concerns is the major challenge that affects the growth of the market. The Market is experiencing significant growth due to the increasing adoption of advanced technologies in various industries. Engineering services providers play a pivotal role in this sector, enabling seamless integration of these technologies into existing infrastructure. Smart city projects, for instance, require the expertise of system integrators to connect various subsystems and ensure efficient communication.
Similarly, Fintech startups rely on system integration services to implement innovative solutions and streamline operations. Industrial automation is another sector that benefits greatly from system integration, enabling optimized production processes and improved efficiency. Overall, the Market is a critical enabler for digital transformation initiatives across industries. Hence, the above factors will impede the growth of the market during the forecast period.
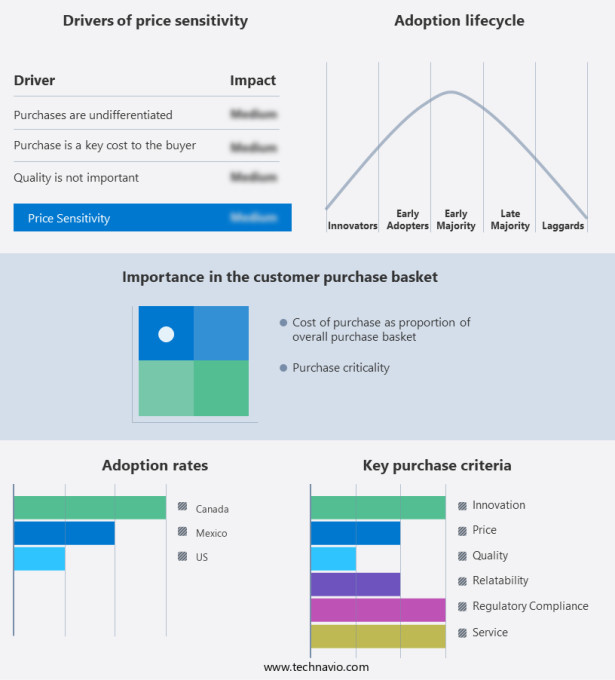
Exclusive Customer Landscape
The market forecasting report includes the adoption lifecycle of the market, covering from the innovator's stage to the laggard's stage. It focuses on adoption rates in different regions based on penetration. Furthermore, the report also includes key purchase criteria and drivers of price sensitivity to help companies evaluate and develop their market growth analysis strategies.
Customer Landscape
Key Companies & Market Insights
Companies are implementing various strategies, such as strategic alliances, partnerships, mergers and acquisitions, geographical expansion, and product/service launches, to enhance their presence in the market.
Accenture Plc - The company offers system integration services which help clients across every stage of digital transformation to achieve agility and operational efficiency.
The market research and growth report includes detailed analyses of the competitive landscape of the market and information about key companies, including:
- Capgemini Service SAS
- CGI Inc.
- Cisco Systems Inc.
- CMS IT Services
- Deloitte Touche Tohmatsu Ltd.
- DICEUS.
- Fujitsu Ltd.
- HCL Technologies Ltd.
- Hewlett Packard Enterprise Co.
- Infosys Ltd.
- International Business Machines Corp.
- Microsoft Corp.
- NEC Corp.
- Oracle Corp.
- Salesforce Inc.
- Scopic Inc.
- Simform
- Systems Integration Inc.
- Zendesk Inc.
Qualitative and quantitative analysis of companies has been conducted to help clients understand the wider business environment as well as the strengths and weaknesses of key market players. Data is qualitatively analyzed to categorize companies as pure play, category-focused, industry-focused, and diversified; it is quantitatively analyzed to categorize companies as dominant, leading, strong, tentative, and weak.
Research Analyst Overview
In North America, the system integration services market is experiencing significant growth due to the increasing adoption of cloud services, AI, IoT, and digital transformation in various industries. IT and telecom, defense and security, oil and gas, healthcare, transportation, retail, food and beverages, automotive, and other sectors are investing in system integrators to help them leverage data-driven insights, access controls, and security audits. System integrators are providing services for data connectivity, predictive modeling, automation, data mapping, process orchestration, and predictive maintenance. Enterprises are integrating infrastructure and applications to enhance their IT infrastructure, improve network resources, and support new software applications.
Furthermore, the integration of IoT devices, CRM, ecommerce platforms, neo-banking services, and banking-as-a-service (BAAS) is also gaining popularity. The system integration industry is also focusing on edge computing, hardware, networking solutions, and data centers to support cloud services and edge devices. The market is driven by the need for digital transformations, cybersecurity concerns, and the integration of third-party solutions. The growth of 5G mobile networks, SD-WAN, fiber, and other network integration services is also contributing to the market's growth. The system integration industry is also providing expertise in IT infrastructure, software, and network resources to support the integration of generative AI, MDS system integration, and industrial automation projects. The market is expected to continue growing due to the increasing penetration of the Internet, the demand for digital infrastructure solutions, and the availability of technologically skilled personnel.
|
Market Scope |
|
|
Report Coverage |
Details |
|
Page number |
188 |
|
Base year |
2023 |
|
Historic period |
2018-2022 |
|
Forecast period |
2024-2028 |
|
Growth momentum & CAGR |
Accelerate at a CAGR of 6.5% |
|
Market growth 2024-2028 |
USD 46 billion |
|
Market structure |
Fragmented |
|
YoY growth 2023-2024(%) |
6.36 |
|
Key companies profiled |
Accenture Plc, Capgemini Service SAS, CGI Inc., Cisco Systems Inc., CMS IT Services, Deloitte Touche Tohmatsu Ltd., DICEUS., Fujitsu Ltd., HCL Technologies Ltd., Hewlett Packard Enterprise Co., Infosys Ltd., International Business Machines Corp., Microsoft Corp., NEC Corp., Oracle Corp., Salesforce Inc., Scopic Inc., Simform, Systems Integration Inc., and Zendesk Inc. |
|
Market dynamics |
Parent market analysis, market growth inducers and obstacles,market forecast , fast-growing and slow-growing segment analysis, COVID-19 impact and recovery analysis and future consumer dynamics, market condition analysis for the forecast period |
|
Customization purview |
If our market report has not included the data that you are looking for, you can reach out to our analysts and get segments customized. |
|
Competitive landscape |
Leading Companies, Market Positioning of Companies, Competitive Strategies, and Industry Risks |
What are the Key Data Covered in this Market Research Report?
- CAGR of the market during the forecast period
- Detailed information on factors that will drive the market growth and forecasting between 2024 and 2028
- Precise estimation of the size of the market and its contribution of the market in focus to the parent market
- Accurate predictions about upcoming market growth and trends and changes in consumer behaviour
- Growth of the market across North America
- Thorough analysis of the market's competitive landscape and detailed information about companies
- Comprehensive analysis of factors that will challenge the growth of market companies
We can help! Our analysts can customize this market research report to meet your requirements Get in touch


