
US Nursing Education Market Size 2025-2029
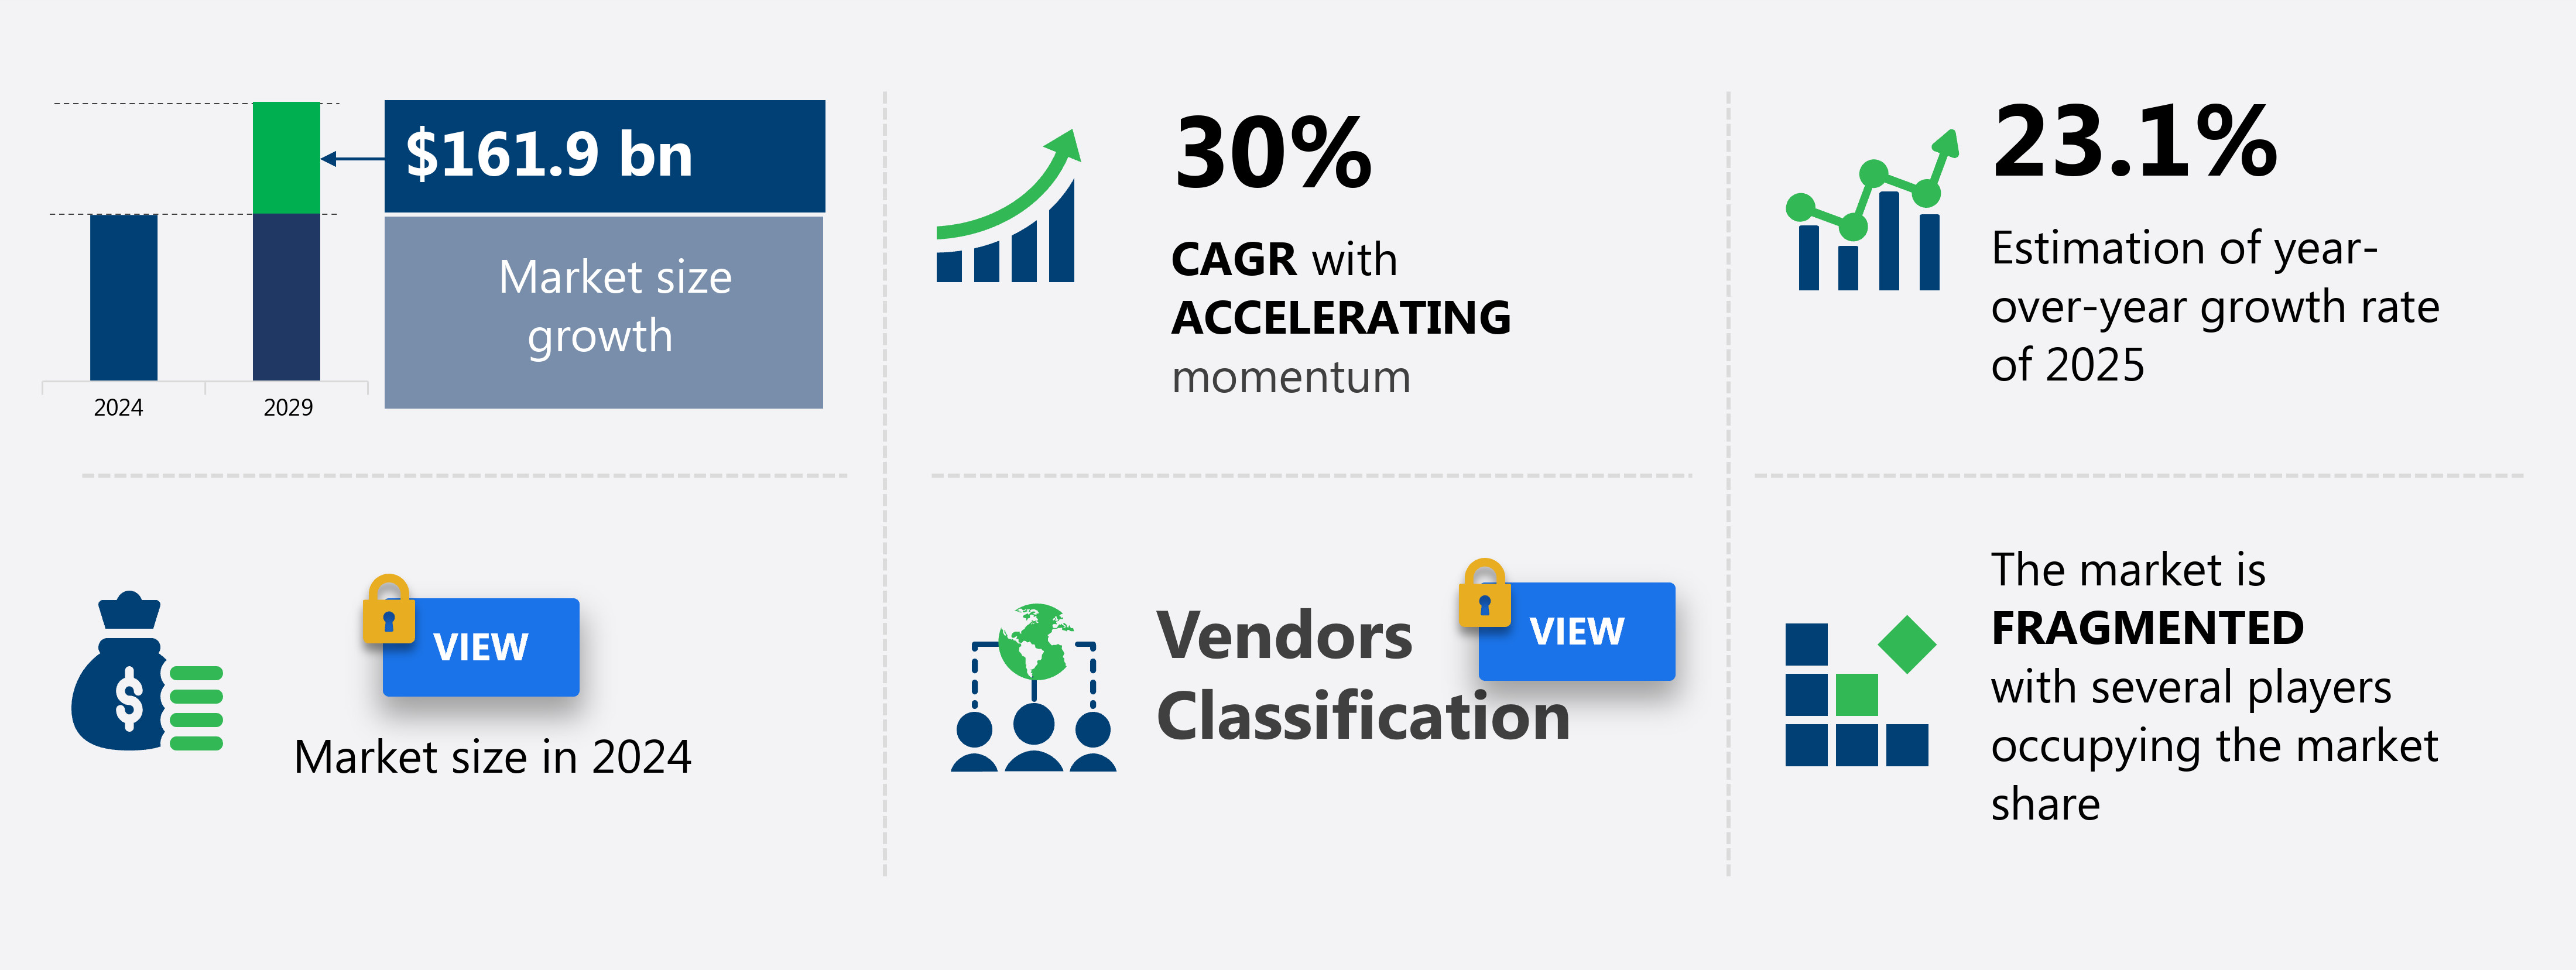
The US nursing education market size is forecast to increase by USD 161.9 billion at a CAGR of 30% between 2024 and 2029.
- US Nursing Education Market is experiencing significant growth, driven by the increasing demand for competency-based learning and the integration of advanced technologies such as Augmented Reality (AR) and Virtual Reality (VR) in nursing education. The shift towards competency-based learning is a response to the evolving healthcare landscape and the need for nurses to possess a higher level of skills and knowledge to provide effective patient care. Furthermore, the use of AR and VR technologies in nursing education offers learning experiences, enabling students to practice complex procedures in a safe and controlled environment. However, the market is not without challenges.
- One of the significant challenges is the lack of standardized assessment metrics to measure the effectiveness of nursing education programs. This challenge hampers the ability to evaluate the success of educational initiatives and the readiness of graduates to enter the workforce. To capitalize on the market opportunities and navigate these challenges effectively, companies must focus on developing innovative solutions that address the need for competency-based learning and provide reliable assessment metrics. Additionally, investing in the integration of AR and VR technologies can offer a competitive edge in the market.
What will be the size of the US Nursing Education Market during the forecast period?
- The nursing education market in the US is experiencing significant growth and innovation, driven by the demand for advanced nursing informatics solutions and continuing education units. This trend is reflected in the development of nurse recruitment strategies that leverage telehealth platforms and nursing curriculum tailored to healthcare technology. Nursing salary trends continue to influence the market, as nursing informatics specialists become increasingly essential for effective healthcare data management. Nursing simulation software and nursing career pathways are key components of nursing education trends, providing clinical experience and patient safety initiatives that align with patient-centered care and improved health outcomes.
- Accreditation standards and nursing faculty recruitment are also critical areas of focus, as institutions seek to maintain high educational standards and remain competitive. Patient portals, mobile health apps, and nursing education consultants are essential tools for nursing workforce development, enabling professional growth and leadership training. Nursing ethics committees and clinical data analytics further enhance the quality of nursing education and research, ensuring that the nursing profession remains at the forefront of healthcare innovation.
How is this market segmented?
The market research report provides comprehensive data (region-wise segment analysis), with forecasts and estimates in "USD billion" for the period 2025-2029, as well as historical data from 2019-2023 for the following segments.
- Type
- Graduate courses
- Postgraduate courses
- End-user
- Hospitals
- Home healthcare services
- Program Type
- Associate Degree
- Bachelor's Degree
- Master's Degree
- Doctoral Programs
- Delivery Mode
- On-Campus
- Online
- Hybrid
- Institution Types
- Universities
- Community Colleges
- Vocational Schools
- Geography
- US
By Type Insights
The graduate courses segment is estimated to witness significant growth during the forecast period.
The nursing education market in the US is experiencing significant growth due to the rising enrollment in undergraduate and graduate nursing programs. This trend is driven by the increasing demand for specialized nursing professionals in various fields, such as geriatric nursing, mental health nursing, and critical care nursing. The American Nurses Association and other nursing organizations advocate for continued nursing education as a means of addressing health disparities and improving patient care. E-learning platforms, nursing simulation labs, and clinical skills training are essential components of graduate nursing programs, providing students with the necessary theoretical and practical knowledge.
Nursing informatics, healthcare reform, and patient safety are key areas of focus, with data analytics and clinical decision support playing crucial roles. The nursing workforce is evolving, with an emphasis on nurse retention, nursing leadership, and nursing professional development. Online nursing programs, mobile health, and wearable technology are transforming nursing education, making it more accessible and flexible. Nursing evaluation, nursing diagnosis, and nursing standards are integral parts of nursing education, ensuring that students are prepared for the nursing licensure exams and the nursing profession. The nursing shortage continues to be a concern, with nursing education programs implementing accelerated nursing programs and clinical rotations to address the issue.
Nursing advocacy and nursing policy are also essential, as they influence nursing education and nursing practice. Nursing research, nursing faculty, and nursing faculty development are vital for advancing nursing knowledge and improving nursing education programs. In summary, the nursing education market in the US is expanding due to the increasing demand for specialized nursing professionals and the evolving needs of the nursing workforce. Graduate nursing programs offer students comprehensive theoretical and practical knowledge, preparing them for the nursing profession and addressing the nursing shortage. Nursing education is transforming through technology, advocacy, and policy, ensuring that nursing students are prepared for the challenges of the 21st century healthcare system.

Get a glance at the market report of share of various segments Request Free Sample
The Graduate courses segment was valued at USD 16.30 billion in 2019 and showed a gradual increase during the forecast period.
Market Dynamics
Our researchers analyzed the data with 2024 as the base year, along with the key drivers, trends, and challenges. A holistic analysis of drivers will help companies refine their marketing strategies to gain a competitive advantage.
What are the key market drivers leading to the rise in adoption of US Nursing Education Market?
- Rising demand for competency-based learning is the key driver of the market.
- Nursing education is undergoing a significant shift towards competency-based education (CBE), an alternative to traditional time-based learning methods. This approach focuses on performance standards for nursing practitioners, enhancing the efficiency and effectiveness of nursing education systems. CBE incorporates various instructional, assessment, grading, and academic reporting systems, enabling students to demonstrate their knowledge and skills as they progress. The trend towards CBE is driven by the increasing need to attract and retain highly qualified and skilled healthcare professionals.
- This shift is gaining momentum in the healthcare industry due to the growing recognition of the importance of competence in delivering quality patient care.
What are the market trends shaping the US Nursing Education Market?
- Increasing use of AR/VR in nursing education is the upcoming trend in the market.
- Nursing education in the US is undergoing significant transformation through the integration of technology into curricula. This shift enhances productivity and enriches student experiences. Augmented and mixed reality tools, such as Microsoft HoloLens, and virtual simulations offer application-based concentration, shortening the learning curve and improving outcomes. For instance, vSims, a collaboration between Laerdal, Wolters Kluwer Health, and the National League for Nursing, have been adopted in US nursing programs.
- Artificial Intelligence (AI) is another technological advancement, creating virtual patient scenarios that foster interactive learning and enhance interprofessional teamwork and nursing colleague interactions. AI-driven virtual patients offer a realistic and engaging learning environment, contributing to better prepared nurses.
What challenges does US Nursing Education Market face during the growth?
- Lack of assessment metrics is a key challenge affecting the market growth.
- Nursing education market dynamics reveal a focus on assessment metrics for determining learner abilities and course quality. National Council Licensing Examination (NCLEX) pass rates have been the primary assessment method for nursing schools. However, there is a scarcity of metrics for evaluating nurse performance, which may hinder market expansion. Nursing institutions have been found to underinvest in developing comprehensive assessment measures for learning outcomes, particularly those relevant to practical nursing.
- This situation underscores the need for nursing schools to prioritize the development and implementation of assessment strategies to ensure the readiness of graduates for the workforce. The lack of suitable assessment metrics may impede the growth of the nursing education market in the coming years.
Exclusive US Nursing Education Market Customer Landscape
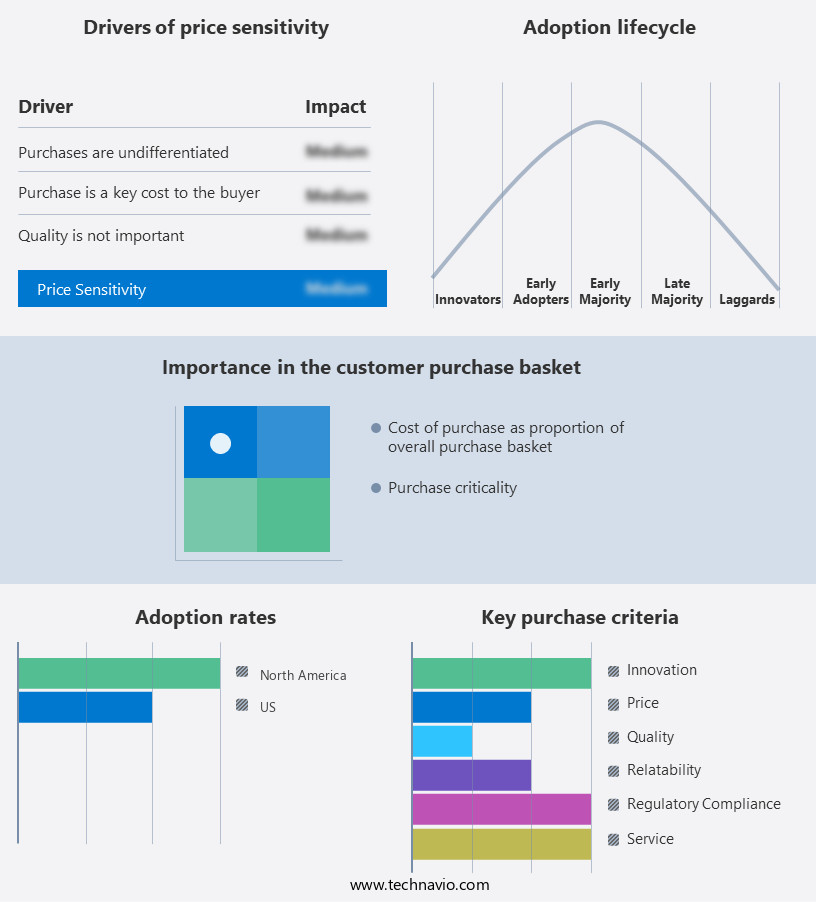
The market forecasting report includes the adoption lifecycle of the market, covering from the innovator's stage to the laggard's stage. It focuses on adoption rates in different regions based on penetration. Furthermore, the report also includes key purchase criteria and drivers of price sensitivity to help companies evaluate and develop their market growth analysis strategies.
Customer Landscape
Key Companies & Market Insights
Companies are implementing various strategies, such as strategic alliances, market forecast partnerships, mergers and acquisitions, geographical expansion, and product/service launches, to enhance their presence in the market.
The market research and growth report includes detailed analyses of the competitive landscape of the market and information about key companies, including:
- Chamberlain University
- Western Governors University
- Grand Canyon University
- Kaplan University
- University of Phoenix
- Walden University
- Excelsior College
- Aspen University
- Herzing University
- South University
- American Sentinel University
- Capella University
- Johns Hopkins School of Nursing
- University of Texas at Arlington
- Samuel Merritt University
- West Coast University
- Galen College of Nursing
- ECPI University
- Carrington College
- Fortis College
Qualitative and quantitative analysis of companies has been conducted to help clients understand the wider business environment as well as the strengths and weaknesses of key market players. Data is qualitatively analyzed to categorize companies as pure play, category-focused, industry-focused, and diversified; it is quantitatively analyzed to categorize companies as dominant, leading, strong, tentative, and weak.
Research Analyst Overview
The nursing education market continues to evolve, driven by various factors shaping the industry's landscape. Electronic health records have become an integral part of healthcare systems, necessitating nursing education programs to integrate this technology into their curricula. Nursing interventions, a critical aspect of patient care, are being refined through evidence-based practice and research. Public health nursing and community health nursing are gaining significance as healthcare providers focus on preventive care and addressing health disparities. Nursing career advancement opportunities are expanding, with nursing leadership and management roles becoming increasingly prevalent. Nursing licensure exams remain a crucial milestone for nursing students, with mental health nursing and geriatric nursing gaining more attention due to the growing demand for specialized care.
Online nursing programs and e-learning platforms are gaining popularity, offering flexibility and convenience for students. Mobile health, wearable technology, and virtual reality simulations are revolutionizing nursing education, enabling more effective patient engagement and clinical skills training. Nursing organizations and associations play a vital role in nursing professional development and advocacy, while nursing evaluation and nursing standards ensure quality patient care. Healthcare reform and patient safety are key concerns, driving the need for continuing nursing education and clinical decision support. Nursing faculty and nursing research are essential components of nursing education programs, fostering innovation and advancing the nursing profession.
Nurse educators and nursing organizations are addressing the nursing shortage by promoting nurse retention and offering accelerated nursing programs. Nursing informatics and healthcare analytics are essential skills for nursing students, preparing them for the digital future of healthcare. Diversity in nursing and nursing ethics are becoming increasingly important topics, reflecting the need for a more inclusive and ethical nursing workforce. Critical care nursing, emergency nursing, and pediatric nursing require specialized skills and knowledge, making nursing education programs more comprehensive. Quality improvement and clinical rotations are integral parts of nursing education, ensuring students gain practical experience and are prepared for the realities of the nursing profession.
Nursing skills labs and nursing simulation labs provide hands-on training, enhancing students' ability to apply theoretical knowledge to real-world situations. In , the nursing education market is dynamic and ever-evolving, with various factors shaping its landscape. From electronic health records and nursing interventions to nursing leadership and patient engagement, nursing education programs must adapt to meet the changing needs of the healthcare industry and the nursing workforce.
|
Market Scope |
|
|
Report Coverage |
Details |
|
Page number |
143 |
|
Base year |
2024 |
|
Historic period |
2019-2023 |
|
Forecast period |
2025-2029 |
|
Growth momentum & CAGR |
Accelerate at a CAGR of 30% |
|
Market growth 2025-2029 |
USD 161.9 billion |
|
Market structure |
Fragmented |
|
YoY growth 2024-2025(%) |
23.1 |
|
Competitive landscape |
Leading Companies, Market Positioning of Companies, Competitive Strategies, and Industry Risks |
What are the Key Data Covered in this Market Research Report?
- CAGR of the market during the forecast period
- Detailed information on factors that will drive the market growth and forecasting between 2025 and 2029
- Precise estimation of the size of the market and its contribution of the market in focus to the parent market
- Accurate predictions about upcoming market growth and trends and changes in consumer behaviour
- Growth of the market across US
- Thorough analysis of the market's competitive landscape and detailed information about companies
- Comprehensive analysis of factors that will challenge the growth of market companies
We can help! Our analysts can customize this market research report to meet your requirements Get in touch