Office Coffee Service Market Analysis, Size, and Forecast 2026-2030: North America (US, Canada, and Mexico), Europe (Germany, UK, and France), APAC (China, Japan, and India), South America (Brazil and Argentina), Middle East and Africa (Saudi Arabia, UAE, and South Africa), and Rest of World (ROW)

Office Coffee Service Market Analysis, Size, and Forecast 2026-2030:
North America (US, Canada, and Mexico), Europe (Germany, UK, and France), APAC (China, Japan, and India), South America (Brazil and Argentina), Middle East and Africa (Saudi Arabia, UAE, and South Africa), and Rest of World (ROW)

Published: May 2026 296 Pages SKU: IRTNTR81048

Market Overview at a Glance

$4.94 B
Market Opportunity
12.3%
CAGR 2025 - 2030
42.7%
North America Growth
$3.94 B
Coffee segment 2024

Office Coffee Service Market Size 2026-2030

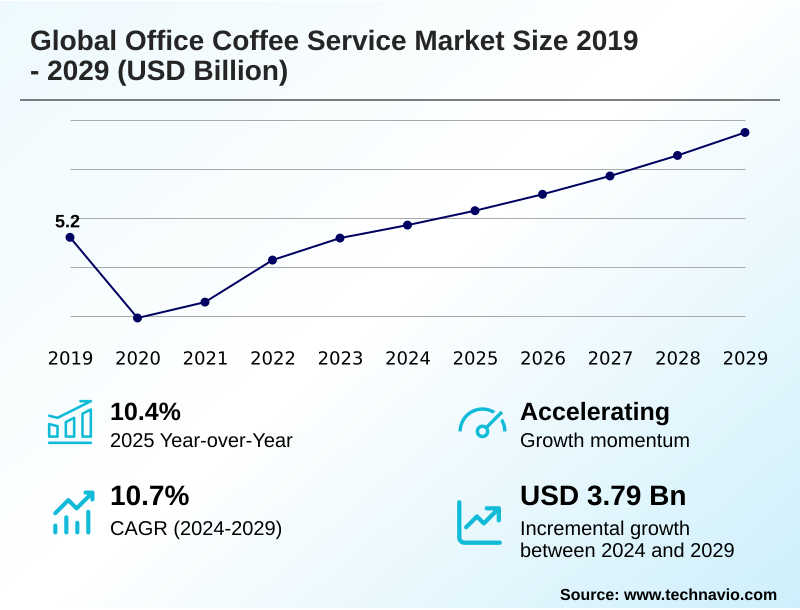
The office coffee service market size is valued to increase by USD 4.94 billion, at a CAGR of 12.3% from 2025 to 2030. Increasing corporate emphasis on employee retention and workplace well-being will drive the office coffee service market.

Major Market Trends & Insights

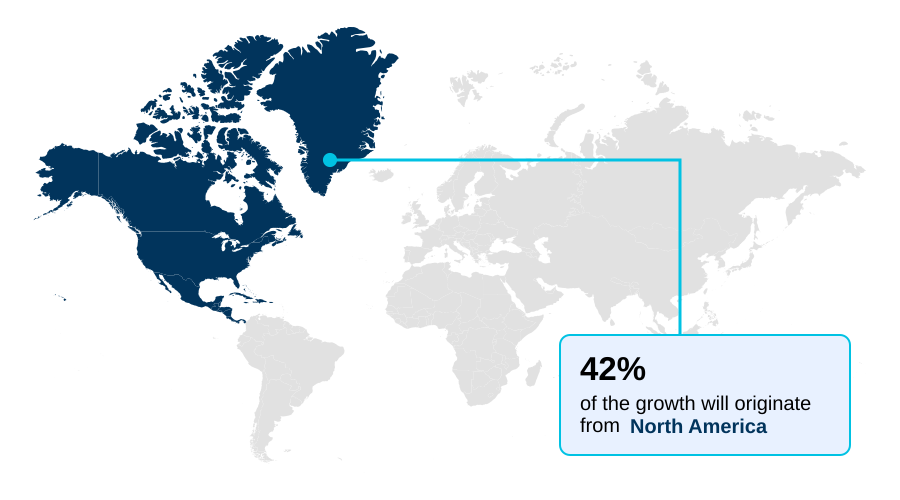
  • North America dominated the market and accounted for a 42.7% growth during the forecast period.
  • By Type - Coffee segment was valued at USD 3.94 billion in 2024
  • By End-user - Large enterprises segment accounted for the largest market revenue share in 2024

Market Size & Forecast

  • Market Opportunities: USD 9.34 billion
  • Market Future Opportunities: USD 4.94 billion
  • CAGR from 2025 to 2030 : 12.3%

Market Summary

  • The office coffee service market is undergoing a profound transformation, moving beyond simple beverage provision to become a strategic tool for corporate entities. As organizations focus on creating engaging workplaces to attract and retain talent, the breakroom has evolved into a central hub for collaboration and morale.
  • This shift is fueled by a demand for premium, cafe-quality experiences, compelling providers to offer sophisticated bean-to-cup systems and artisanal roasts. A key business scenario involves optimizing supply chains using data-driven logistics, where telemetry capabilities on smart brewing systems predict consumption patterns.
  • This allows for preventative maintenance and ensures inventory management is aligned with fluctuating office attendance, reducing waste and operational costs. Concurrently, sustainability has become a non-negotiable aspect, with corporate clients demanding ethical sourcing, fair trade certifications, and compostable packaging.
  • Navigating the high capital expenditure for commercial-grade machines and the operational costs of managed service contracts remains a challenge, pushing the industry toward flexible equipment leasing programs and subscription frameworks to meet diverse client needs.

What will be the Size of the Office Coffee Service Market during the forecast period?

Get Key Insights on Market Forecast (PDF) Get Free Sample

How is the Office Coffee Service Market Segmented?

The office coffee service industry research report provides comprehensive data (region-wise segment analysis), with forecasts and estimates in "USD million" for the period 2026-2030, as well as historical data from 2020-2024 for the following segments.

  • Type
    • Coffee
    • Associated products
  • End-user
    • Large enterprises
    • SMEs
  • Service type
    • Subscription based
    • One time purchase
    • Managed services
    • Others
  • Geography
    • North America
      • US
      • Canada
      • Mexico
    • Europe
      • Germany
      • UK
      • France
    • APAC
      • China
      • Japan
      • India
    • South America
      • Brazil
      • Argentina
    • Middle East and Africa
      • Saudi Arabia
      • UAE
      • South Africa
    • Rest of World (ROW)

By Type Insights

The coffee segment is estimated to witness significant growth during the forecast period.

The coffee segment is the foundational pillar of the global office coffee service market 2026-2030, driven by its role in corporate wellness initiatives and enhancing corporate culture.

The trend of premiumization has shifted demand toward custom artisanal roasts and high-quality workplace beverage programs that require commercial-grade machines.

This evolution toward on-demand beverage quality reflects a strategic move to improve employee satisfaction, with North America alone poised to contribute over 42% of the market's incremental growth.

To meet this demand for premium beverage offerings, providers are deploying high-volume dispense units and automated brewing systems that mirror the experience of workplace cafe solutions.

Ethical sourcing and the provision of customized beverage profiles are now standard expectations in procurement.

Get Free Sample

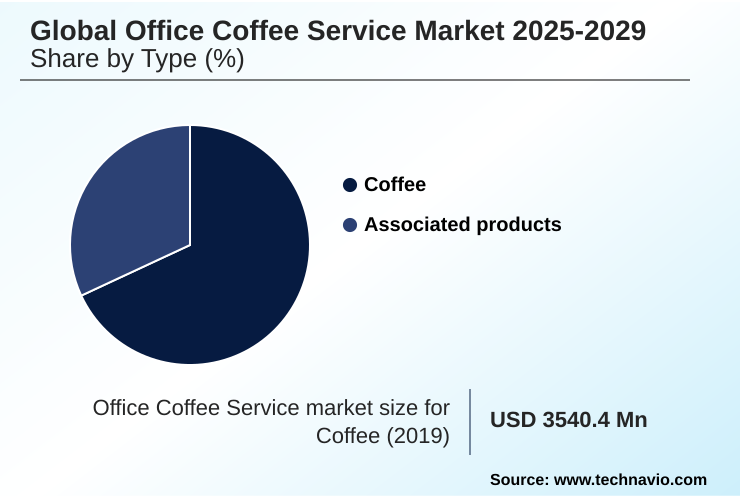
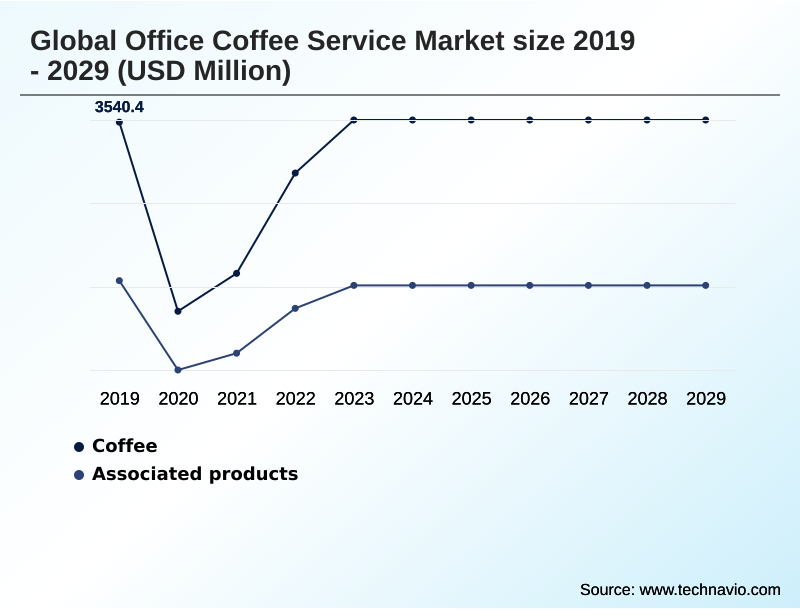
The Coffee segment was valued at USD 3.94 billion in 2024 and showed a gradual increase during the forecast period.

Get Free Sample

Regional Analysis

North America is estimated to contribute 42.7% to the growth of the global market during the forecast period.Technavio’s analysts have elaborately explained the regional trends and drivers that shape the market during the forecast period.

See How Office Coffee Service Market Demand is Rising in North America Get Free Sample

The geographic landscape of the global office coffee service market 2026-2030 is led by North America, which accounts for over 42% of the incremental growth, driven by a mature corporate culture that prioritizes hybrid work model amenities and employee engagement platforms.

In contrast, Europe's market, contributing over 28% of growth, is characterized by a strong emphasis on a sustainable coffee supply chain. Providers are leveraging subscription frameworks and managed service contracts to offer flexible solutions globally.

Telemetry capabilities and data-driven logistics are crucial for optimizing operations, with smart, energy-efficient equipment enabling preventative maintenance and efficient breakroom management.

The adoption of integrated facility services and equipment leasing programs allows for scalable, single-source procurement, meeting the complex needs of multinational clients.
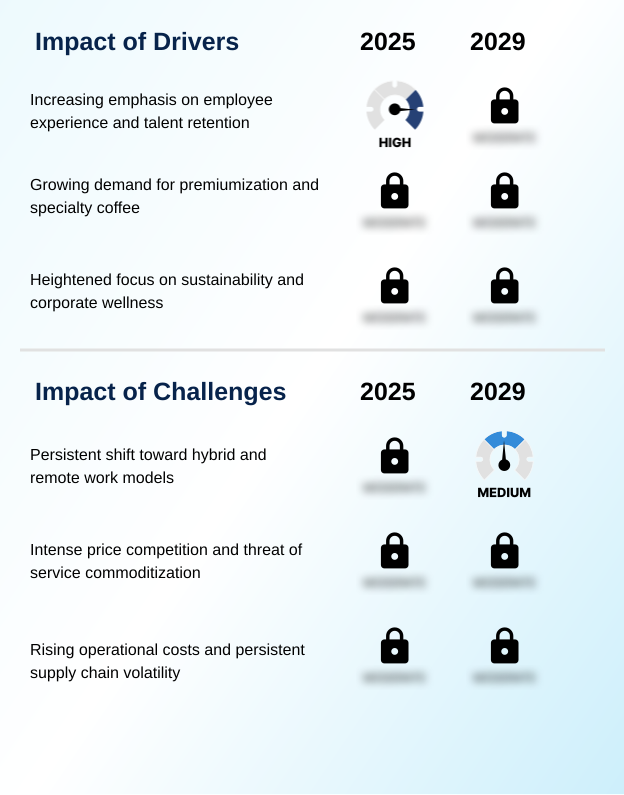
Market Dynamics

Our researchers analyzed the data with 2025 as the base year, along with the key drivers, trends, and challenges. A holistic analysis of drivers will help companies refine their marketing strategies to gain a competitive advantage.

  • Understanding the contemporary office coffee service market requires a deep dive into several interconnected factors. The impact of hybrid work on office coffee consumption is a primary consideration, forcing a re-evaluation of traditional service models.
  • This leads to a cost-benefit analysis of managed coffee services versus direct ownership, where IoT integration in commercial coffee machines for smart coffee machine maintenance and diagnostics plays a pivotal role.
  • The ROI of premium office coffee amenities is now directly linked to employee well-being programs and corporate brand image, which is why the importance of ethical sourcing for corporate brand image cannot be understated. Technology advancements in automated coffee vending and touchless brewing technology for workplace safety are also critical.
  • Businesses are comparing bean-to-cup vs pod systems for offices, considering factors like single-serve coffee waste reduction solutions. For smaller companies, finding the best office coffee solutions for small businesses often involves flexible office coffee subscription models. The larger trend involves office micro-market integration strategies and managing coffee service for fluctuating office attendance.
  • Premiumization trends in corporate beverage offerings and the rise of plant-based milk trends in workplace coffee are reshaping supply chains, with some managed services showing over 15% higher adoption in enterprises focused on employee wellness. Ultimately, navigating the challenges of office coffee service logistics while using data analytics for optimizing office coffee supply defines success.

What are the key market drivers leading to the rise in the adoption of Office Coffee Service Industry?

  • The increasing corporate emphasis on employee retention and workplace well-being serves as a key driver for the growth of the office coffee service market.

  • The primary driver is the strategic use of corporate refreshment solutions as workplace satisfaction tools and employee retention amenities. The adoption of advanced smart brewing systems and bean-to-cup systems is central to delivering the barista-level experiences modern employees expect.
  • These systems, often featuring touchless interfaces and mobile application ordering, cater to the demand for hygiene and convenience, with firms seeing a 15% increase in breakroom utilization after upgrading.
  • The integration of technology for inventory management provides real-time data, improving restocking efficiency by over 20% compared to manual methods.
  • This focus on premium, accessible employee beverage programs, including options like cold brew on tap and nitro infusions, is a direct response to the need to make the physical office an attractive destination.

What are the market trends shaping the Office Coffee Service Industry?

  • A defining market trend is the stringent emphasis on sustainability, which increasingly shapes ethical supply chains and corporate procurement decisions for workplace amenities.

  • A defining trend is the push for sustainability through fair trade certifications and circular economy principles, which is reshaping office pantry services. The adoption of biodegradable capsules and compostable packaging is becoming standard, with some providers reporting a 30% reduction in plastic waste for clients. This movement complements the rise of integrated pantry solutions and micro-market solutions within corporate environments.
  • These unattended retail solutions, featuring self-checkout retail, offer a holistic workplace refreshment experience. This convergence, driven by a desire for turn-key breakroom operations and corporate dining programs, has led to a notable efficiency gain, with some integrated models reducing procurement administration time by up to 25% compared to managing separate vendors.
  • Advanced extraction technology further enhances the quality of offerings within these consolidated systems.

What challenges does the Office Coffee Service Industry face during its growth?

  • Distribution vulnerabilities within the global agricultural supply chain and significant volatility in raw material pricing present a key challenge affecting industry growth and profitability.

  • A significant challenge is the high cost of asset management, particularly for sophisticated hardware like commercial coffee brewers, office espresso machines, and dual milk frothing units. The capital outlay for these systems, coupled with ongoing maintenance for features like automated cleaning cycles, puts pressure on providers.
  • Many clients are shifting to pay-per-consumption billing to manage fluctuating office attendance, which can destabilize revenue for providers. This model requires precise tracking, a burden that increases operational costs by an estimated 10% to 15%. Furthermore, the demand for a wide array of options, including single-serve espresso systems and diverse plant-based dairy alternatives, complicates beverage distribution services.
  • These complexities, typical of commercial hospitality sectors, require providers to function more like managers of diverse commercial kitchen appliances than simple suppliers, creating a barrier for smaller operators.

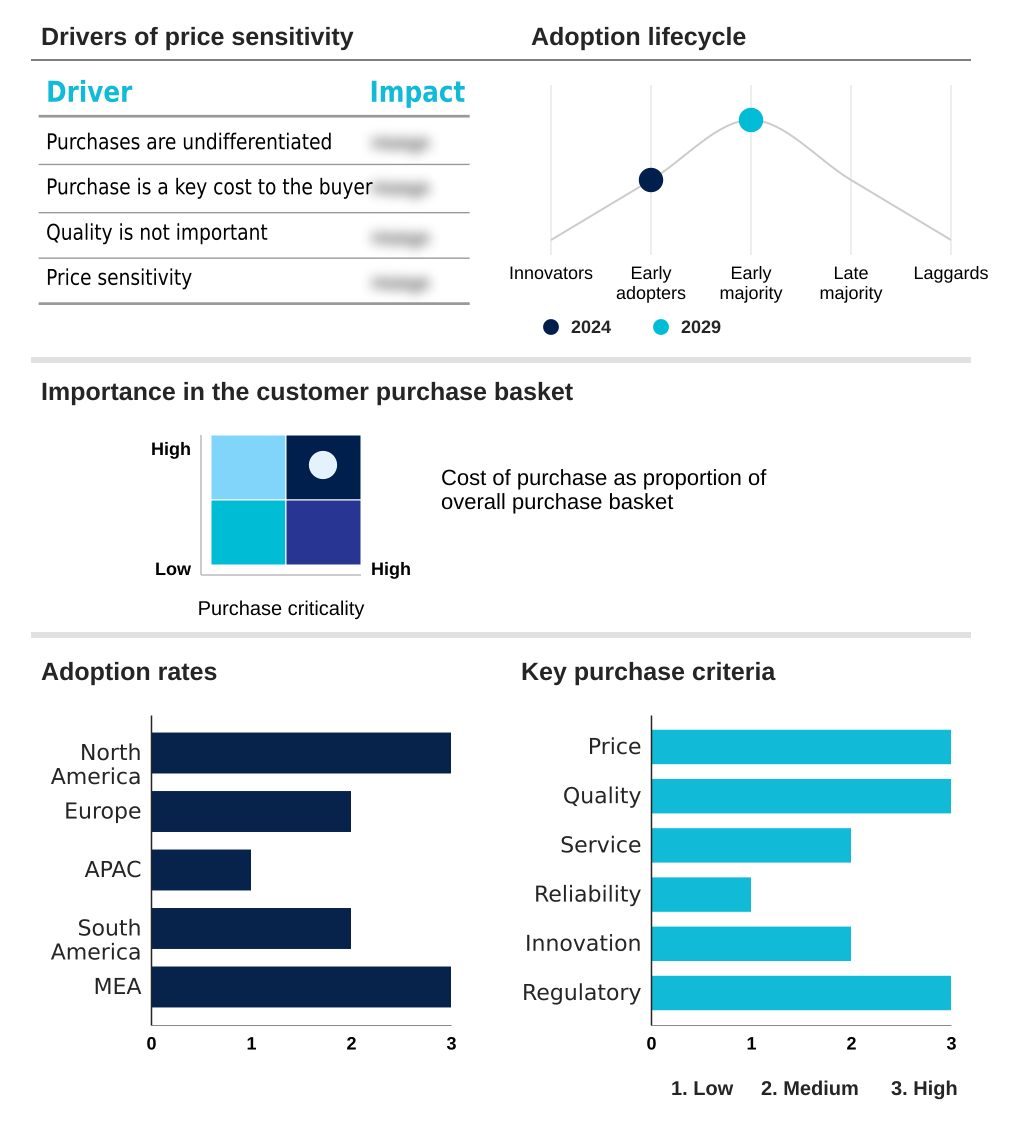
Exclusive Technavio Analysis on Customer Landscape

The office coffee service market forecasting report includes the adoption lifecycle of the market, covering from the innovator’s stage to the laggard’s stage. It focuses on adoption rates in different regions based on penetration. Furthermore, the office coffee service market report also includes key purchase criteria and drivers of price sensitivity to help companies evaluate and develop their market growth analysis strategies.

Customer Landscape of Office Coffee Service Industry

Competitive Landscape

Companies are implementing various strategies, such as strategic alliances, office coffee service market forecast, partnerships, mergers and acquisitions, geographical expansion, and product/service launches, to enhance their presence in the industry.

American Dining Creations - Key offerings include comprehensive workplace refreshment solutions, integrating premium beverage programs with breakroom management and customized corporate pantry services to enhance employee satisfaction and productivity.

The industry research and growth report includes detailed analyses of the competitive landscape of the market and information about key companies, including:

  • American Dining Creations
  • Aramark
  • AVS Companies
  • Bodecker
  • Bunn O Matic Corp.
  • Compass Group
  • Evoca S.p.A.
  • Farmer Bros Co.
  • Hamilton Beach Brands Holding
  • JACOBS DOUWE EGBERTS B.V.
  • Keurig Green Mountain Inc.
  • Luigi Lavazza SPA.
  • Nestle SA
  • Royal Cup Inc.
  • Selecta Group BV
  • Sodexo SA
  • Starbucks Corp.
  • Strauss Coffee BV
  • Westrock Coffee Co.

Qualitative and quantitative analysis of companies has been conducted to help clients understand the wider business environment as well as the strengths and weaknesses of key industry players. Data is qualitatively analyzed to categorize companies as pure play, category-focused, industry-focused, and diversified; it is quantitatively analyzed to categorize companies as dominant, leading, strong, tentative, and weak.

Recent Development and News in Office coffee service market

  • In August 2024, Keurig Dr Pepper announced the acquisition of JDE Peets, a transformative move designed to consolidate operations and expand its geographic reach across North America and international territories.
  • In October 2024, Franke Coffee Systems launched a fully automatic coffee machine featuring advanced extraction technology and an integrated milk foam system, designed specifically for high-volume commercial environments and office spaces.
  • In December 2024, Sodexo expanded its Aspretto signature coffee concept across corporate dining and pantry programs in India, responding to the rising demand for premium workplace brews in the rapidly growing Asia Pacific market.
  • In February 2025, the Saudi Coffee Company formed a strategic partnership with Shahia Food Company to integrate specialized training academy programs into commercial networks, aiming to elevate barista standards across corporate settings in the Middle East.

Dive into Technavio’s robust research methodology, blending expert interviews, extensive data synthesis, and validated models for unparalleled Office Coffee Service Market insights. See full methodology.

Market Scope
Page number 296
Base year 2025
Historic period 2020-2024
Forecast period 2026-2030
Growth momentum & CAGR Accelerate at a CAGR of 12.3%
Market growth 2026-2030 USD 4940.5 million
Market structure Fragmented
YoY growth 2025-2026(%) 10.9%
Key countries US, Canada, Mexico, Germany, UK, France, Italy, Spain, The Netherlands, China, Japan, India, South Korea, Australia, Indonesia, Brazil, Argentina, Chile, Saudi Arabia, UAE, South Africa, Israel and Turkey
Competitive landscape Leading Companies, Market Positioning of Companies, Competitive Strategies, and Industry Risks

Request Free Sample

Research Analyst Overview

  • The global office coffee service market 2026-2030 is characterized by a significant shift toward premiumization and integrated corporate wellness initiatives. The deployment of sophisticated commercial-grade machines, including bean-to-cup systems and high-volume dispense units, is now standard as employers seek to replicate high-street cafe experiences.
  • This evolution is supported by flexible equipment leasing programs and managed service contracts that incorporate preventative maintenance and data-driven logistics. A critical boardroom-level consideration is aligning with sustainability mandates through ethical sourcing, fair trade certifications, and circular economy principles using biodegradable capsules and compostable packaging.
  • In fact, the market for coffee itself is forecasted to be more than double the size of associated products by 2025, underscoring the focus on the core beverage.
  • Success hinges on leveraging smart brewing systems with telemetry capabilities for efficient inventory management and offering diverse options like cold brew on tap, nitro infusions, and plant-based dairy alternatives through integrated pantry and micro-market solutions that utilize self-checkout retail and subscription frameworks, often with touchless interfaces and mobile application ordering and automated cleaning cycles on commercial coffee brewers, office espresso machines and dual milk frothing units.

What are the Key Data Covered in this Office Coffee Service Market Research and Growth Report?

  • What is the expected growth of the Office Coffee Service Market between 2026 and 2030?

    • USD 4.94 billion, at a CAGR of 12.3%

  • What segmentation does the market report cover?

    • The report is segmented by Type (Coffee, and Associated products), End-user (Large enterprises, and SMEs), Service Type (Subscription based, One time purchase, Managed services, and Others) and Geography (North America, Europe, APAC, South America, Middle East and Africa)

  • Which regions are analyzed in the report?

    • North America, Europe, APAC, South America and Middle East and Africa

  • What are the key growth drivers and market challenges?

    • Increasing corporate emphasis on employee retention and workplace well-being, Distribution vulnerabilities and agricultural volatility

  • Who are the major players in the Office Coffee Service Market?

    • American Dining Creations, Aramark, AVS Companies, Bodecker, Bunn O Matic Corp., Compass Group, Evoca S.p.A., Farmer Bros Co., Hamilton Beach Brands Holding, JACOBS DOUWE EGBERTS B.V., Keurig Green Mountain Inc., Luigi Lavazza SPA., Nestle SA, Royal Cup Inc., Selecta Group BV, Sodexo SA, Starbucks Corp., Strauss Coffee BV and Westrock Coffee Co.

Market Research Insights

  • The market's dynamic nature is shaped by the demand for sophisticated workplace beverage programs and corporate refreshment solutions that serve as critical employee retention amenities. Providers offering integrated facility services are gaining traction over single-source procurement models, as clients seek holistic breakroom management.
  • Adoption of these comprehensive services is growing, with regions like North America showing a year-over-year growth rate of 12.7%, notably higher than the 11.7% seen in APAC. This indicates a stronger push for premiumization in mature markets.
  • Furthermore, the emphasis on hybrid work model amenities is compelling operators to deliver on-demand beverage quality, with technology like touchless coffee dispensing becoming a key differentiator. The ability to enhance corporate culture through superior amenities is a core value proposition driving investment in this sector.

We can help! Our analysts can customize this office coffee service market research report to meet your requirements.

Get in touch

1. Executive Summary

1.1 Market overview

Executive Summary - Chart on Market Overview
Executive Summary - Data Table on Market Overview
Executive Summary - Chart on Global Market Characteristics
Executive Summary - Chart on Market by Geography
Executive Summary - Chart on Market Segmentation by Type
Executive Summary - Chart on Market Segmentation by End-user
Executive Summary - Chart on Market Segmentation by Service Type
Executive Summary - Chart on Incremental Growth
Executive Summary - Data Table on Incremental Growth
Executive Summary - Chart on Company Market Positioning

2. Technavio Analysis

2.1 Analysis of price sensitivity, lifecycle, customer purchase basket, adoption rates, and purchase criteria

2.2 Criticality of inputs and Factors of differentiation

Chart on Overview on criticality of inputs and factors of differentiation

2.3 Factors of disruption

Chart on Overview on factors of disruption

2.4 Impact of drivers and challenges

Chart on Impact of drivers and challenges in 2025 and 2030

3. Market Landscape

3.1 Market ecosystem

Chart on Parent Market
Data Table on - Parent Market

3.2 Market characteristics

Chart on Market characteristics analysis

3.3 Value chain analysis

Chart on Value chain analysis

4. Market Sizing

4.1 Market definition

Data Table on Offerings of companies included in the market definition

4.2 Market segment analysis

Market segments

4.3 Market size 2025

4.4 Market outlook: Forecast for 2025-2030

Chart on Global - Market size and forecast 2025-2030 ($ million)
Data Table on Global - Market size and forecast 2025-2030 ($ million)
Chart on Global Market: Year-over-year growth 2025-2030 (%)
Data Table on Global Market: Year-over-year growth 2025-2030 (%)

5. Historic Market Size

5.1 Global Office Coffee Service Market 2020 - 2024

Historic Market Size - Data Table on Global Office Coffee Service Market 2020 - 2024 ($ million)

5.2 Type segment analysis 2020 - 2024

Historic Market Size - Type Segment 2020 - 2024 ($ million)

5.3 End-user segment analysis 2020 - 2024

Historic Market Size - End-user Segment 2020 - 2024 ($ million)

5.4 Service Type segment analysis 2020 - 2024

Historic Market Size - Service Type Segment 2020 - 2024 ($ million)

5.5 Geography segment analysis 2020 - 2024

Historic Market Size - Geography Segment 2020 - 2024 ($ million)

5.6 Country segment analysis 2020 - 2024

Historic Market Size - Country Segment 2020 - 2024 ($ million)

6. Qualitative Analysis

6.1 Impact of AI on global office coffee service market

6.2 Impact of geopolitical conflicts on global office coffee service market

7. Five Forces Analysis

7.1 Five forces summary

Five forces analysis - Comparison between 2025 and 2030

7.2 Bargaining power of buyers

Bargaining power of buyers - Impact of key factors 2025 and 2030

7.3 Bargaining power of suppliers

Bargaining power of suppliers - Impact of key factors in 2025 and 2030

7.4 Threat of new entrants

Threat of new entrants - Impact of key factors in 2025 and 2030

7.5 Threat of substitutes

Threat of substitutes - Impact of key factors in 2025 and 2030

7.6 Threat of rivalry

Threat of rivalry - Impact of key factors in 2025 and 2030

7.7 Market condition

Chart on Market condition - Five forces 2025 and 2030

8. Market Segmentation by Type

8.1 Market segments

Chart on Type - Market share 2025-2030 (%)
Data Table on Type - Market share 2025-2030 (%)

8.2 Comparison by Type

Chart on Comparison by Type
Data Table on Comparison by Type

8.3 Coffee - Market size and forecast 2025-2030

Chart on Coffee - Market size and forecast 2025-2030 ($ million)
Data Table on Coffee - Market size and forecast 2025-2030 ($ million)
Chart on Coffee - Year-over-year growth 2025-2030 (%)
Data Table on Coffee - Year-over-year growth 2025-2030 (%)

8.4 Associated products - Market size and forecast 2025-2030

Chart on Associated products - Market size and forecast 2025-2030 ($ million)
Data Table on Associated products - Market size and forecast 2025-2030 ($ million)
Chart on Associated products - Year-over-year growth 2025-2030 (%)
Data Table on Associated products - Year-over-year growth 2025-2030 (%)

8.5 Market opportunity by Type

Market opportunity by Type ($ million)
Data Table on Market opportunity by Type ($ million)

9. Market Segmentation by End-user

9.1 Market segments

Chart on End-user - Market share 2025-2030 (%)
Data Table on End-user - Market share 2025-2030 (%)

9.2 Comparison by End-user

Chart on Comparison by End-user
Data Table on Comparison by End-user

9.3 Large enterprises - Market size and forecast 2025-2030

Chart on Large enterprises - Market size and forecast 2025-2030 ($ million)
Data Table on Large enterprises - Market size and forecast 2025-2030 ($ million)
Chart on Large enterprises - Year-over-year growth 2025-2030 (%)
Data Table on Large enterprises - Year-over-year growth 2025-2030 (%)

9.4 SMEs - Market size and forecast 2025-2030

Chart on SMEs - Market size and forecast 2025-2030 ($ million)
Data Table on SMEs - Market size and forecast 2025-2030 ($ million)
Chart on SMEs - Year-over-year growth 2025-2030 (%)
Data Table on SMEs - Year-over-year growth 2025-2030 (%)

9.5 Market opportunity by End-user

Market opportunity by End-user ($ million)
Data Table on Market opportunity by End-user ($ million)

10. Market Segmentation by Service Type

10.1 Market segments

Chart on Service Type - Market share 2025-2030 (%)
Data Table on Service Type - Market share 2025-2030 (%)

10.2 Comparison by Service Type

Chart on Comparison by Service Type
Data Table on Comparison by Service Type

10.3 Subscription based - Market size and forecast 2025-2030

Chart on Subscription based - Market size and forecast 2025-2030 ($ million)
Data Table on Subscription based - Market size and forecast 2025-2030 ($ million)
Chart on Subscription based - Year-over-year growth 2025-2030 (%)
Data Table on Subscription based - Year-over-year growth 2025-2030 (%)

10.4 One time purchase - Market size and forecast 2025-2030

Chart on One time purchase - Market size and forecast 2025-2030 ($ million)
Data Table on One time purchase - Market size and forecast 2025-2030 ($ million)
Chart on One time purchase - Year-over-year growth 2025-2030 (%)
Data Table on One time purchase - Year-over-year growth 2025-2030 (%)

10.5 Managed services - Market size and forecast 2025-2030

Chart on Managed services - Market size and forecast 2025-2030 ($ million)
Data Table on Managed services - Market size and forecast 2025-2030 ($ million)
Chart on Managed services - Year-over-year growth 2025-2030 (%)
Data Table on Managed services - Year-over-year growth 2025-2030 (%)

10.6 Others - Market size and forecast 2025-2030

Chart on Others - Market size and forecast 2025-2030 ($ million)
Data Table on Others - Market size and forecast 2025-2030 ($ million)
Chart on Others - Year-over-year growth 2025-2030 (%)
Data Table on Others - Year-over-year growth 2025-2030 (%)

10.7 Market opportunity by Service Type

Market opportunity by Service Type ($ million)
Data Table on Market opportunity by Service Type ($ million)

11. Customer Landscape

11.1 Customer landscape overview

Analysis of price sensitivity, lifecycle, customer purchase basket, adoption rates, and purchase criteria

12. Geographic Landscape

12.1 Geographic segmentation

Chart on Market share by geography 2025-2030 (%)
Data Table on Market share by geography 2025-2030 (%)

12.2 Geographic comparison

Chart on Geographic comparison
Data Table on Geographic comparison

12.3 North America - Market size and forecast 2025-2030

Chart on North America - Market size and forecast 2025-2030 ($ million)
Data Table on North America - Market size and forecast 2025-2030 ($ million)
Chart on North America - Year-over-year growth 2025-2030 (%)
Data Table on North America - Year-over-year growth 2025-2030 (%)
Chart on Regional Comparison - North America
Data Table on Regional Comparison - North America

12.3.1 US - Market size and forecast 2025-2030

Chart on US - Market size and forecast 2025-2030 ($ million)
Data Table on US - Market size and forecast 2025-2030 ($ million)
Chart on US - Year-over-year growth 2025-2030 (%)
Data Table on US - Year-over-year growth 2025-2030 (%)

12.3.2 Canada - Market size and forecast 2025-2030

Chart on Canada - Market size and forecast 2025-2030 ($ million)
Data Table on Canada - Market size and forecast 2025-2030 ($ million)
Chart on Canada - Year-over-year growth 2025-2030 (%)
Data Table on Canada - Year-over-year growth 2025-2030 (%)

12.3.3 Mexico - Market size and forecast 2025-2030

Chart on Mexico - Market size and forecast 2025-2030 ($ million)
Data Table on Mexico - Market size and forecast 2025-2030 ($ million)
Chart on Mexico - Year-over-year growth 2025-2030 (%)
Data Table on Mexico - Year-over-year growth 2025-2030 (%)

12.4 Europe - Market size and forecast 2025-2030

Chart on Europe - Market size and forecast 2025-2030 ($ million)
Data Table on Europe - Market size and forecast 2025-2030 ($ million)
Chart on Europe - Year-over-year growth 2025-2030 (%)
Data Table on Europe - Year-over-year growth 2025-2030 (%)
Chart on Regional Comparison - Europe
Data Table on Regional Comparison - Europe

12.4.1 Germany - Market size and forecast 2025-2030

Chart on Germany - Market size and forecast 2025-2030 ($ million)
Data Table on Germany - Market size and forecast 2025-2030 ($ million)
Chart on Germany - Year-over-year growth 2025-2030 (%)
Data Table on Germany - Year-over-year growth 2025-2030 (%)

12.4.2 UK - Market size and forecast 2025-2030

Chart on UK - Market size and forecast 2025-2030 ($ million)
Data Table on UK - Market size and forecast 2025-2030 ($ million)
Chart on UK - Year-over-year growth 2025-2030 (%)
Data Table on UK - Year-over-year growth 2025-2030 (%)

12.4.3 France - Market size and forecast 2025-2030

Chart on France - Market size and forecast 2025-2030 ($ million)
Data Table on France - Market size and forecast 2025-2030 ($ million)
Chart on France - Year-over-year growth 2025-2030 (%)
Data Table on France - Year-over-year growth 2025-2030 (%)

12.4.4 Italy - Market size and forecast 2025-2030

Chart on Italy - Market size and forecast 2025-2030 ($ million)
Data Table on Italy - Market size and forecast 2025-2030 ($ million)
Chart on Italy - Year-over-year growth 2025-2030 (%)
Data Table on Italy - Year-over-year growth 2025-2030 (%)

12.4.5 Spain - Market size and forecast 2025-2030

Chart on Spain - Market size and forecast 2025-2030 ($ million)
Data Table on Spain - Market size and forecast 2025-2030 ($ million)
Chart on Spain - Year-over-year growth 2025-2030 (%)
Data Table on Spain - Year-over-year growth 2025-2030 (%)

12.4.6 The Netherlands - Market size and forecast 2025-2030

Chart on The Netherlands - Market size and forecast 2025-2030 ($ million)
Data Table on The Netherlands - Market size and forecast 2025-2030 ($ million)
Chart on The Netherlands - Year-over-year growth 2025-2030 (%)
Data Table on The Netherlands - Year-over-year growth 2025-2030 (%)

12.5 APAC - Market size and forecast 2025-2030

Chart on APAC - Market size and forecast 2025-2030 ($ million)
Data Table on APAC - Market size and forecast 2025-2030 ($ million)
Chart on APAC - Year-over-year growth 2025-2030 (%)
Data Table on APAC - Year-over-year growth 2025-2030 (%)
Chart on Regional Comparison - APAC
Data Table on Regional Comparison - APAC

12.5.1 China - Market size and forecast 2025-2030

Chart on China - Market size and forecast 2025-2030 ($ million)
Data Table on China - Market size and forecast 2025-2030 ($ million)
Chart on China - Year-over-year growth 2025-2030 (%)
Data Table on China - Year-over-year growth 2025-2030 (%)

12.5.2 Japan - Market size and forecast 2025-2030

Chart on Japan - Market size and forecast 2025-2030 ($ million)
Data Table on Japan - Market size and forecast 2025-2030 ($ million)
Chart on Japan - Year-over-year growth 2025-2030 (%)
Data Table on Japan - Year-over-year growth 2025-2030 (%)

12.5.3 India - Market size and forecast 2025-2030

Chart on India - Market size and forecast 2025-2030 ($ million)
Data Table on India - Market size and forecast 2025-2030 ($ million)
Chart on India - Year-over-year growth 2025-2030 (%)
Data Table on India - Year-over-year growth 2025-2030 (%)

12.5.4 South Korea - Market size and forecast 2025-2030

Chart on South Korea - Market size and forecast 2025-2030 ($ million)
Data Table on South Korea - Market size and forecast 2025-2030 ($ million)
Chart on South Korea - Year-over-year growth 2025-2030 (%)
Data Table on South Korea - Year-over-year growth 2025-2030 (%)

12.5.5 Australia - Market size and forecast 2025-2030

Chart on Australia - Market size and forecast 2025-2030 ($ million)
Data Table on Australia - Market size and forecast 2025-2030 ($ million)
Chart on Australia - Year-over-year growth 2025-2030 (%)
Data Table on Australia - Year-over-year growth 2025-2030 (%)

12.5.6 Indonesia - Market size and forecast 2025-2030

Chart on Indonesia - Market size and forecast 2025-2030 ($ million)
Data Table on Indonesia - Market size and forecast 2025-2030 ($ million)
Chart on Indonesia - Year-over-year growth 2025-2030 (%)
Data Table on Indonesia - Year-over-year growth 2025-2030 (%)

12.6 South America - Market size and forecast 2025-2030

Chart on South America - Market size and forecast 2025-2030 ($ million)
Data Table on South America - Market size and forecast 2025-2030 ($ million)
Chart on South America - Year-over-year growth 2025-2030 (%)
Data Table on South America - Year-over-year growth 2025-2030 (%)
Chart on Regional Comparison - South America
Data Table on Regional Comparison - South America

12.6.1 Brazil - Market size and forecast 2025-2030

Chart on Brazil - Market size and forecast 2025-2030 ($ million)
Data Table on Brazil - Market size and forecast 2025-2030 ($ million)
Chart on Brazil - Year-over-year growth 2025-2030 (%)
Data Table on Brazil - Year-over-year growth 2025-2030 (%)

12.6.2 Argentina - Market size and forecast 2025-2030

Chart on Argentina - Market size and forecast 2025-2030 ($ million)
Data Table on Argentina - Market size and forecast 2025-2030 ($ million)
Chart on Argentina - Year-over-year growth 2025-2030 (%)
Data Table on Argentina - Year-over-year growth 2025-2030 (%)

12.6.3 Chile - Market size and forecast 2025-2030

Chart on Chile - Market size and forecast 2025-2030 ($ million)
Data Table on Chile - Market size and forecast 2025-2030 ($ million)
Chart on Chile - Year-over-year growth 2025-2030 (%)
Data Table on Chile - Year-over-year growth 2025-2030 (%)

12.7 Middle East and Africa - Market size and forecast 2025-2030

Chart on Middle East and Africa - Market size and forecast 2025-2030 ($ million)
Data Table on Middle East and Africa - Market size and forecast 2025-2030 ($ million)
Chart on Middle East and Africa - Year-over-year growth 2025-2030 (%)
Data Table on Middle East and Africa - Year-over-year growth 2025-2030 (%)
Chart on Regional Comparison - Middle East and Africa
Data Table on Regional Comparison - Middle East and Africa

12.7.1 Saudi Arabia - Market size and forecast 2025-2030

Chart on Saudi Arabia - Market size and forecast 2025-2030 ($ million)
Data Table on Saudi Arabia - Market size and forecast 2025-2030 ($ million)
Chart on Saudi Arabia - Year-over-year growth 2025-2030 (%)
Data Table on Saudi Arabia - Year-over-year growth 2025-2030 (%)

12.7.2 UAE - Market size and forecast 2025-2030

Chart on UAE - Market size and forecast 2025-2030 ($ million)
Data Table on UAE - Market size and forecast 2025-2030 ($ million)
Chart on UAE - Year-over-year growth 2025-2030 (%)
Data Table on UAE - Year-over-year growth 2025-2030 (%)

12.7.3 South Africa - Market size and forecast 2025-2030

Chart on South Africa - Market size and forecast 2025-2030 ($ million)
Data Table on South Africa - Market size and forecast 2025-2030 ($ million)
Chart on South Africa - Year-over-year growth 2025-2030 (%)
Data Table on South Africa - Year-over-year growth 2025-2030 (%)

12.7.4 Israel - Market size and forecast 2025-2030

Chart on Israel - Market size and forecast 2025-2030 ($ million)
Data Table on Israel - Market size and forecast 2025-2030 ($ million)
Chart on Israel - Year-over-year growth 2025-2030 (%)
Data Table on Israel - Year-over-year growth 2025-2030 (%)

12.7.5 Turkey - Market size and forecast 2025-2030

Chart on Turkey - Market size and forecast 2025-2030 ($ million)
Data Table on Turkey - Market size and forecast 2025-2030 ($ million)
Chart on Turkey - Year-over-year growth 2025-2030 (%)
Data Table on Turkey - Year-over-year growth 2025-2030 (%)

12.8 Market opportunity by geography

Market opportunity by geography ($ million)
Data Tables on Market opportunity by geography ($ million)

13. Drivers, Challenges, and Opportunity

13.1 Market drivers

Increasing corporate emphasis on employee retention and workplace well-being
Rising demand for premium and specialty beverages in professional environments
Technological advancements and integration of smart brewing systems

13.2 Market challenges

Distribution vulnerabilities and agricultural volatility
High operational costs and equipment maintenance burdens
Unpredictable office occupancy and fluctuating daily beverage requirements

13.3 Impact of drivers and challenges

Impact of drivers and challenges in 2025 and 2030

13.4 Market opportunities

Stringent emphasis on sustainability and ethical supply chains
Transition toward flexible and scalable managed service contracts
Convergence of coffee services with comprehensive micro market solutions

14. Competitive Landscape

14.1 Overview

14.2

Overview on criticality of inputs and factors of differentiation

14.3 Landscape disruption

Overview on factors of disruption

14.4 Industry risks

Impact of key risks on business

15. Competitive Analysis

15.1 Companies profiled

Companies covered

15.2 Company ranking index

15.3 Market positioning of companies

Matrix on companies position and classification

15.4 American Dining Creations

American Dining Creations - Overview
American Dining Creations - Product / Service
American Dining Creations - Key offerings
SWOT

15.5 Aramark

Aramark - Overview
Aramark - Business segments
Aramark - Key offerings
Aramark - Segment focus
SWOT

15.6 Bodecker

Bodecker - Overview
Bodecker - Product / Service
Bodecker - Key offerings
SWOT

15.7 Compass Group

Compass Group - Overview
Compass Group - Product / Service
Compass Group - Key offerings
SWOT

15.8 Evoca S.p.A.

Evoca S.p.A. - Overview
Evoca S.p.A. - Product / Service
Evoca S.p.A. - Key offerings
SWOT

15.9 Farmer Bros Co.

Farmer Bros Co. - Overview
Farmer Bros Co. - Product / Service
Farmer Bros Co. - Key offerings
SWOT

15.10 Hamilton Beach Brands Holding

Hamilton Beach Brands Holding - Overview
Hamilton Beach Brands Holding - Product / Service
Hamilton Beach Brands Holding - Key offerings
SWOT

15.11 JACOBS DOUWE EGBERTS B.V.

JACOBS DOUWE EGBERTS B.V. - Overview
JACOBS DOUWE EGBERTS B.V. - Product / Service
JACOBS DOUWE EGBERTS B.V. - Key offerings
SWOT

15.12 Luigi Lavazza SPA.

Luigi Lavazza SPA. - Overview
Luigi Lavazza SPA. - Product / Service
Luigi Lavazza SPA. - Key offerings
SWOT

15.13 Nestle SA

Nestle SA - Overview
Nestle SA - Business segments
Nestle SA - Key news
Nestle SA - Key offerings
Nestle SA - Segment focus
SWOT

15.14 Selecta Group BV

Selecta Group BV - Overview
Selecta Group BV - Product / Service
Selecta Group BV - Key offerings
SWOT

15.15 Sodexo SA

Sodexo SA - Overview
Sodexo SA - Business segments
Sodexo SA - Key offerings
Sodexo SA - Segment focus
SWOT

15.16 Starbucks Corp.

Starbucks Corp. - Overview
Starbucks Corp. - Business segments
Starbucks Corp. - Key offerings
Starbucks Corp. - Segment focus
SWOT

15.17 Strauss Coffee BV

Strauss Coffee BV - Overview
Strauss Coffee BV - Product / Service
Strauss Coffee BV - Key offerings
SWOT

15.18 Westrock Coffee Co.

Westrock Coffee Co. - Overview
Westrock Coffee Co. - Business segments
Westrock Coffee Co. - Key offerings
Westrock Coffee Co. - Segment focus
SWOT

16. Appendix

16.1 Scope of the report

Market definition
Objectives
Notes and caveats

16.2 Inclusions and exclusions checklist

Inclusions checklist
Exclusions checklist

16.3 Currency conversion rates for US$

16.4 Research methodology

16.5 Data procurement

Information sources

16.6 Data validation

16.7 Validation techniques employed for market sizing

16.8 Data synthesis

16.9 360 degree market analysis

16.10 List of abbreviations

Research Methodology

Technavio presents a detailed picture of the market by way of study, synthesis, and summation of data from multiple sources. The analysts have presented the various facets of the market with a particular focus on identifying the key industry influencers. The data thus presented is comprehensive, reliable, and the result of extensive research, both primary and secondary.

INFORMATION SOURCES

Primary sources

  • Manufacturers and suppliers
  • Channel partners
  • Industry experts
  • Strategic decision makers

Secondary sources

  • Industry journals and periodicals
  • Government data
  • Financial reports of key industry players
  • Historical data
  • Press releases

DATA ANALYSIS

Data Synthesis

  • Collation of data
  • Estimation of key figures
  • Analysis of derived insights

Data Validation

  • Triangulation with data models
  • Reference against proprietary databases
  • Corroboration with industry experts

REPORT WRITING

Qualitative

  • Market drivers
  • Market challenges
  • Market trends
  • Five forces analysis

Quantitative

  • Market size and forecast
  • Market segmentation
  • Geographical insights
  • Competitive landscape

Interested in this report?

Get your sample now to see our research methodology and insights!

Download Now

Frequently Asked Questions

Office Coffee Service market growth will increase by USD 4940.5 million during 2026-2030.

The Office Coffee Service market is expected to grow at a CAGR of 12.3% during 2026-2030.

Office Coffee Service market is segmented by Type (Coffee, Associated products) End-user (Large enterprises, SMEs) Service type (Subscription based, One time purchase, Managed services, Others)

American Dining Creations, Aramark, AVS Companies, Bodecker, Bunn O Matic Corp., Compass Group, Evoca S.p.A., Farmer Bros Co., Hamilton Beach Brands Holding, JACOBS DOUWE EGBERTS B.V., Keurig Green Mountain Inc., Luigi Lavazza SPA., Nestle SA, Royal Cup Inc., Selecta Group BV, Sodexo SA, Starbucks Corp., Strauss Coffee BV, Westrock Coffee Co. are a few of the key vendors in the Office Coffee Service market.

North America will register the highest growth rate of 42.7% among the other regions. Therefore, the Office Coffee Service market in North America is expected to garner significant business opportunities for the vendors during the forecast period.

US, Canada, Mexico, Germany, UK, France, Italy, Spain, The Netherlands, China, Japan, India, South Korea, Australia, Indonesia, Brazil, Argentina, Chile, Saudi Arabia, UAE, South Africa, Israel, Turkey

  • Increasing corporate emphasis on employee retention and workplace well-being is the driving factor this market.

The Office Coffee Service market vendors should focus on grabbing business opportunities from the Type segment as it accounted for the largest market share in the base year.
RIA - Research AI Assistant
Ask RIA