
Offshore Decommissioning Market Size 2026-2030
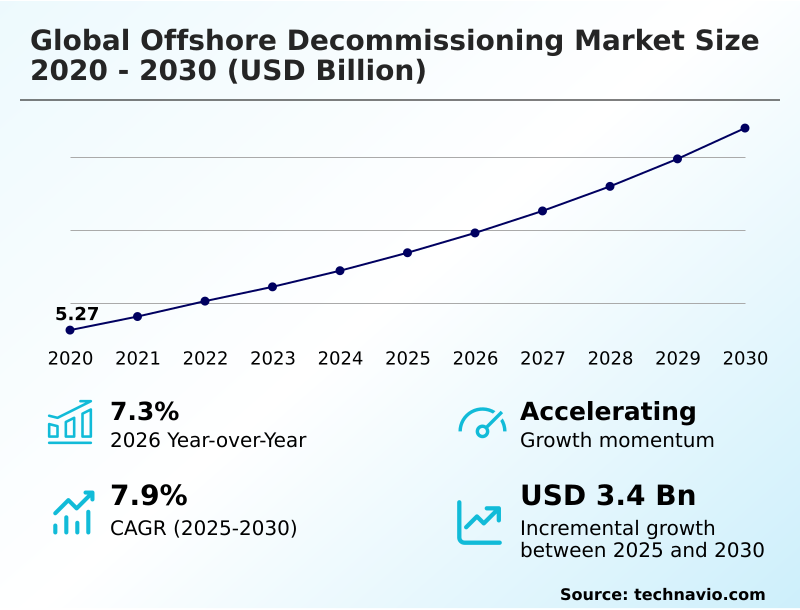
The offshore decommissioning market size is valued to increase by USD 3.40 billion, at a CAGR of 7.9% from 2025 to 2030. Maturation of offshore oil and gas infrastructure will drive the offshore decommissioning market.
Major Market Trends & Insights
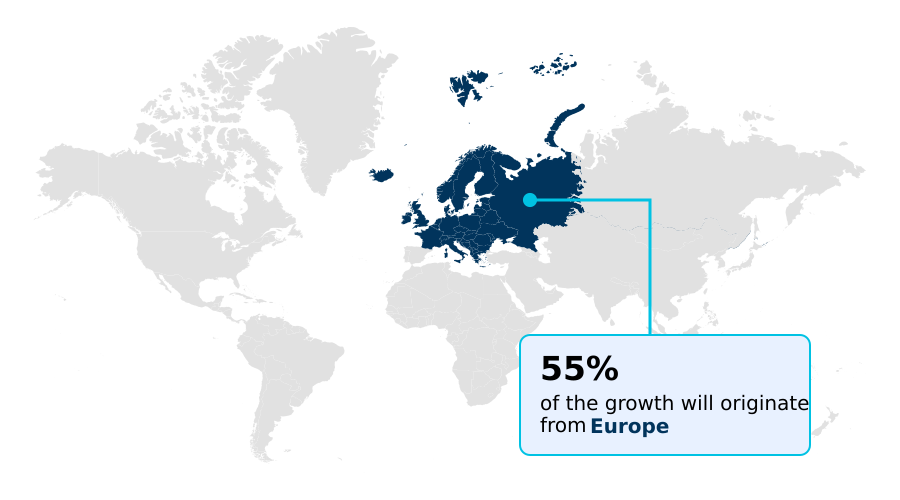
- Europe dominated the market and accounted for a 54.7% growth during the forecast period.
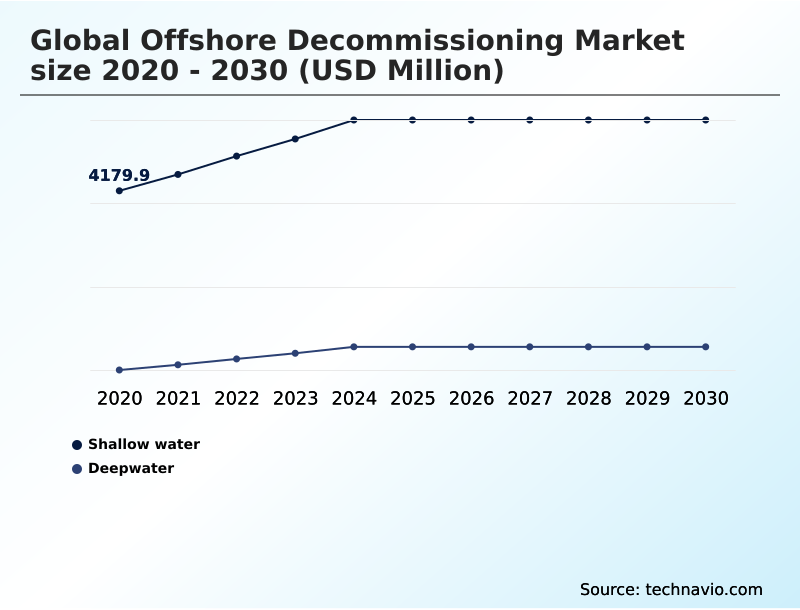
- By Type - Shallow water segment was valued at USD 5.40 billion in 2024
- By Service - Well plugging and abandonment segment accounted for the largest market revenue share in 2024
Market Size & Forecast
- Market Opportunities: USD 5.51 billion
- Market Future Opportunities: USD 3.40 billion
- CAGR from 2025 to 2030 : 7.9%
Market Summary
- The offshore decommissioning market is undergoing a significant expansion driven by the maturation of global energy infrastructure. As assets installed decades ago exceed their operational lifespan, operators are compelled by economic and regulatory pressures to pursue systematic retirement.
- This transition is characterized by a shift from life-extension efforts to planned cessation of production, addressing liabilities associated with aging platforms and subsea systems. Key activities include well plugging and abandonment to ensure permanent reservoir isolation, followed by the complex removal of structures.
- A central trend is the move toward large-scale, multi-year campaigns, which allow for better resource planning and the use of specialized heavy-lift vessels. For instance, a single campaign can optimize vessel schedules for removing multiple satellite platforms, reducing mobilization costs and the overall project carbon footprint.
- This industrialization of the decommissioning process is critical for managing the immense scale of aging assets while adhering to stringent environmental standards for seabed restoration.
What will be the Size of the Offshore Decommissioning Market during the forecast period?
Get Key Insights on Market Forecast (PDF) Get Free Sample
How is the Offshore Decommissioning Market Segmented?
The offshore decommissioning industry research report provides comprehensive data (region-wise segment analysis), with forecasts and estimates in "USD million" for the period 2026-2030, as well as historical data from 2020-2024 for the following segments.
- Type
- Shallow water
- Deepwater
- Service
- Well plugging and abandonment
- Platform removal
- Permitting and regulatory compliance
- Platform preparation
- Others
- Application
- Topside
- Substructure
- Business segment
- Complete removal
- Partial removal
- Leave in place
- Geography
- Europe
- UK
- The Netherlands
- Germany
- North America
- US
- Mexico
- Canada
- APAC
- Australia
- China
- Indonesia
- South America
- Brazil
- Argentina
- Colombia
- Middle East and Africa
- Saudi Arabia
- UAE
- Rest of World (ROW)
- Europe
By Type Insights
The shallow water segment is estimated to witness significant growth during the forecast period.
The shallow water segment is the most active component of the industry, driven by the end-of-life process management for a high volume of fixed steel-jacket platforms.
The asset retirement lifecycle in these regions is accelerating due to mounting maintenance costs and regulatory pressure. Operations rely on jack-up rigs and smaller heavy-lift vessel operations for platform removal, including topside deconstruction and jacket structure removal.
Evolving from ad hoc projects, the focus is now on campaign-based decommissioning to manage the cessation of production strategy for multiple assets. This approach, which includes well plugging and abandonment and subsea infrastructure removal, facilitates permanent hydrocarbon reservoir isolation.
A key performance metric is achieving material recovery rates exceeding 97% through sustainable dismantling practices, showcasing a commitment to the circular economy.
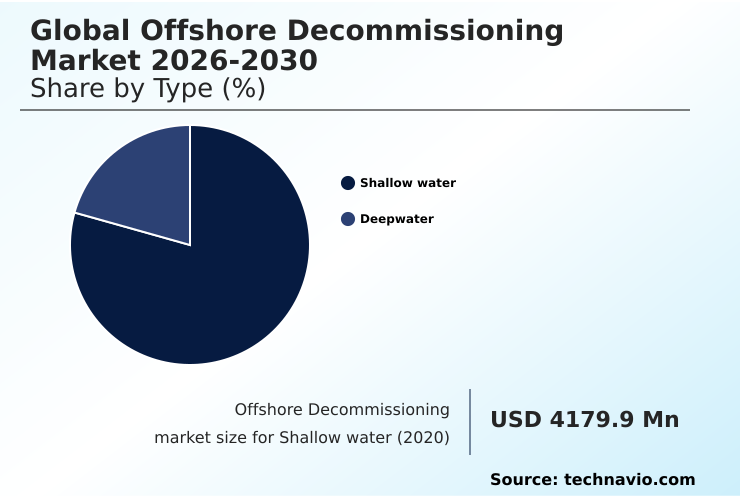
The Shallow water segment was valued at USD 5.40 billion in 2024 and showed a gradual increase during the forecast period.
Regional Analysis
Europe is estimated to contribute 54.7% to the growth of the global market during the forecast period.Technavio’s analysts have elaborately explained the regional trends and drivers that shape the market during the forecast period.
See How Offshore Decommissioning Market Demand is Rising in Europe Get Free Sample
The geographic landscape of the offshore decommissioning market is diversifying, with mature basins pioneering advanced techniques while emerging regions formalize their regulatory compliance framework.
In established areas, the focus is on complex technical challenges such as riser disconnection and the use of subsea cutting tools like abrasive water jet cutting and diamond wire saws.
These regions prioritize well integrity management through precise cement barrier placement and mechanical plug application for permanent reservoir isolation. For instance, projects have demonstrated the ability to achieve a material reuse rate of 99.6%.
In contrast, developing markets in APAC and the Middle East are grappling with a high volume of aging assets, creating a significant pipeline for flowline decommissioning services and umbilical and flowline recovery.
The technical hurdles in these regions, influenced by unique environmental conditions, necessitate the adoption of robust environmental stewardship standards for all subsea tie-back architecture removal.
Market Dynamics
Our researchers analyzed the data with 2025 as the base year, along with the key drivers, trends, and challenges. A holistic analysis of drivers will help companies refine their marketing strategies to gain a competitive advantage.
- Navigating the complexities of the global offshore decommissioning market 2026-2030 requires a strategic approach to managing long-term liabilities and operational execution. Key decisions revolve around adopting integrated well plugging and abandonment services, which can reduce costs by over 25% compared to fragmented approaches.
- The technical challenges of deepwater floating production system removal demand specialized expertise and significant capital, forcing companies to refine their risk assessment for aging platforms. For shallow water platform removal techniques, the focus is on efficiency and safety. As regulatory frameworks for asset retirement tighten globally, so does the need for robust financial assurance for decommissioning costs.
- Technology plays a crucial role, with AI-driven decommissioning project planning and advanced systems for well integrity verification becoming standard. Optimizing heavy-lift vessel utilization and implementing sustainable practices in well abandonment are critical for both economic and environmental performance. Furthermore, managing hazardous waste from platforms and mastering platform preparation for single-lift removal are essential steps.
- The adoption of circular economy principles in asset retirement, through subsea infrastructure recycling processes and advanced robotic systems for subsea cutting, defines market leaders.
What are the key market drivers leading to the rise in the adoption of Offshore Decommissioning Industry?
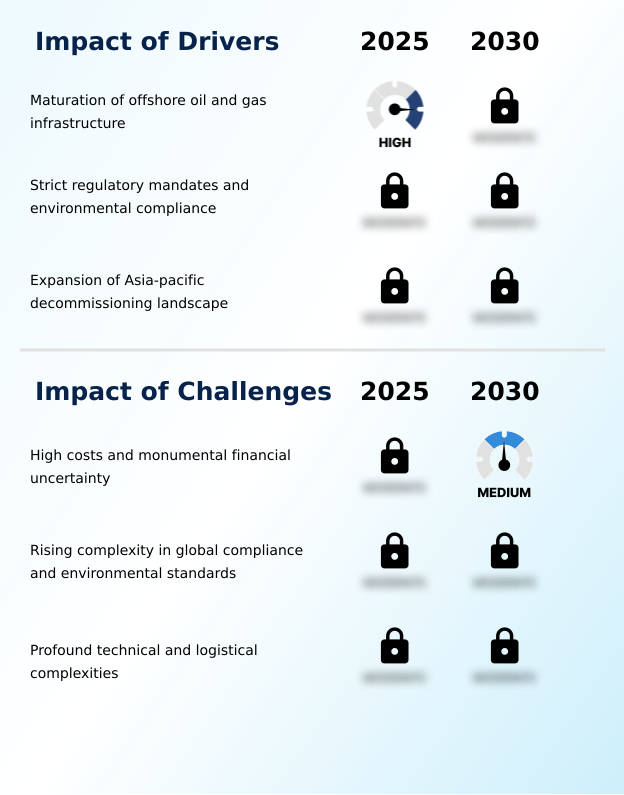
- The maturation of offshore oil and gas infrastructure is a key driver for the market.
- Market growth is significantly driven by stringent regulations and the formalization of regional markets. A primary driver is the global push for environmental stewardship, compelling operators to adopt turnkey decommissioning solutions.
- In Europe, regulations mandate that over 95% of materials from platforms must be recycled. The expansion of activity in APAC, projected to expand by nearly 8% annually, is creating new hubs for asset retirement.
- This is supported by the rise of collaborative contracting models and risk-sharing agreements, which facilitate large-scale, campaign-based decommissioning and promote cost compression strategies.
- The deployment of advanced technologies, including floating production systems, subsea intervention units, and riserless light well intervention, is enabling the industry to tackle more complex projects efficiently.
- These technical deployment frameworks are essential for managing the removal of aging infrastructure safely and sustainably across the globe.
What are the market trends shaping the Offshore Decommissioning Industry?
- Technological integration and AI-driven optimization in decommissioning operations are prominent trends, aimed at enhancing project planning, execution, and overall cost-effectiveness.
- Key market trends revolve around digitalization and new commercial structures designed to manage the growing asset retirement obligation. The adoption of circular economy principles is central, with an emphasis on material reuse and recycling to boost sustainability. Advanced environmental impact assessment methods and seabed clearance verification technologies ensure compliance. In one instance, projects achieved a 97% recycling rate.
- Concurrently, the industry is shifting toward integrated service models for non-productive asset retirement, which can streamline project execution and reduce costs by over 15%. This approach supports sustainable dismantling practices and enhances material recovery rate optimization.
- The establishment of clear financial assurance mechanisms is also a critical development, providing security for regulators and the public while allowing operators to manage their long-term liabilities effectively. These trends collectively aim to minimize the industrial footprint of the energy sector.
What challenges does the Offshore Decommissioning Industry face during its growth?
- High costs and significant financial uncertainty represent a key challenge affecting industry growth.
- The market faces considerable challenges related to high costs, technical complexity, and logistical hurdles. The financial burden of deepwater decommissioning and shallow water removals is substantial, with regional liabilities in APAC alone exceeding initial estimates by a significant margin. A primary operational challenge is managing legacy infrastructure degradation.
- For example, the rate of structural corrosion and marine biofouling in tropical waters can be nearly double that of colder climates, complicating structural integrity assessment and requiring specialized subsea inspection techniques. This necessitates advanced planning for topside de-energization, hazardous materials neutralization, and overall waste stream management.
- The technical intricacy of removing large concrete gravity structures and steel jacket platforms requires precise operational efficiency improvement and advanced pigging solutions to ensure safety and environmental compliance.
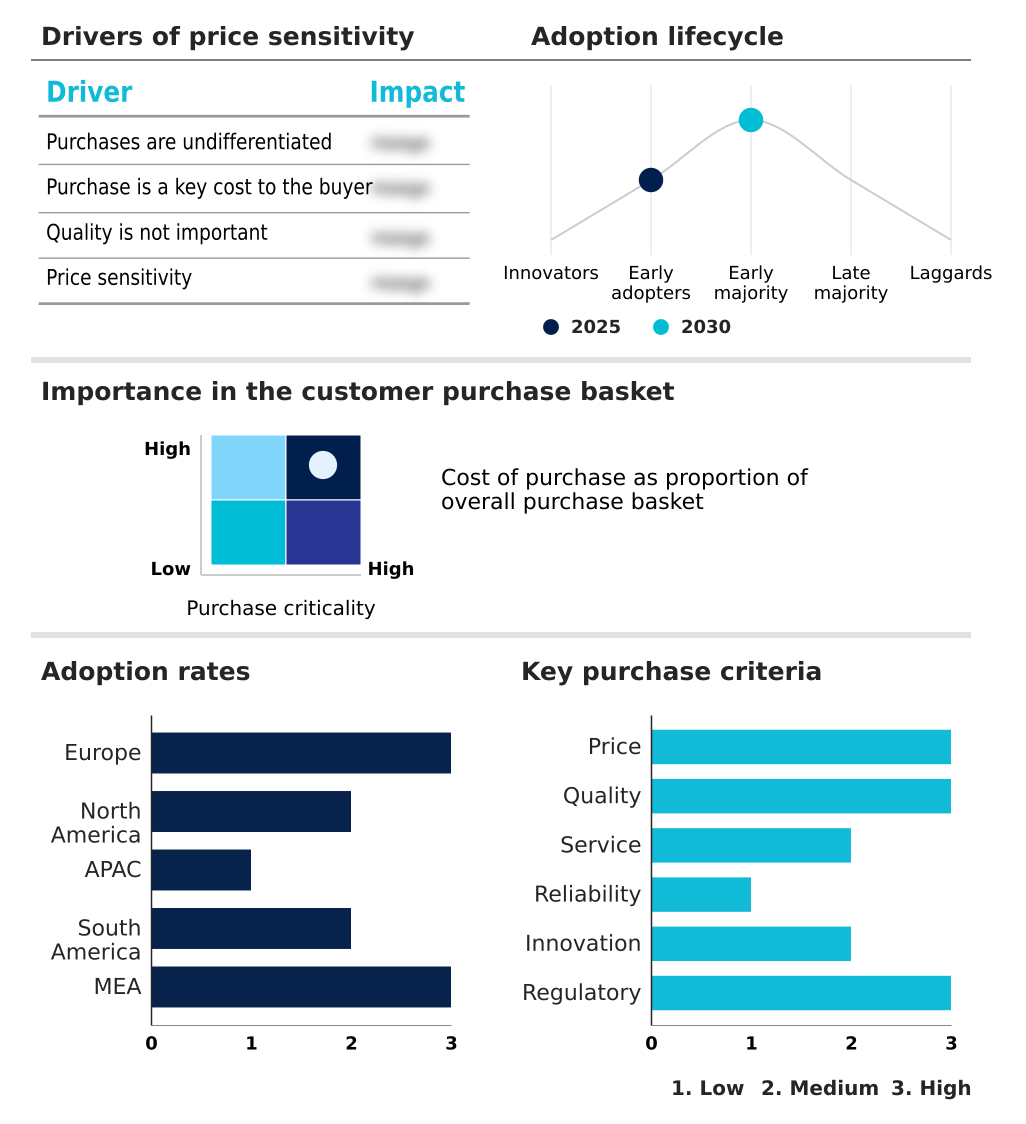
Exclusive Technavio Analysis on Customer Landscape
The offshore decommissioning market forecasting report includes the adoption lifecycle of the market, covering from the innovator’s stage to the laggard’s stage. It focuses on adoption rates in different regions based on penetration. Furthermore, the offshore decommissioning market report also includes key purchase criteria and drivers of price sensitivity to help companies evaluate and develop their market growth analysis strategies.
Customer Landscape of Offshore Decommissioning Industry
Competitive Landscape
Companies are implementing various strategies, such as strategic alliances, offshore decommissioning market forecast, partnerships, mergers and acquisitions, geographical expansion, and product/service launches, to enhance their presence in the industry.
Aker Solutions ASA - Provides integrated solutions for renewable energy projects, including offshore wind, alongside traditional oil and gas platform decommissioning, enabling a comprehensive approach to the energy transition.
The industry research and growth report includes detailed analyses of the competitive landscape of the market and information about key companies, including:
- Aker Solutions ASA
- Allseas Group SA
- Archer Ltd.
- Baker Hughes Co.
- Boskalis
- DeepOcean Group Holding BV
- Expro Group Holdings NV
- Heerema International Group
- Helix Energy Solutions Group
- John Wood Group PLC
- Larsen and Toubro Ltd.
- McDermott International Ltd.
- Oceaneering International Inc.
- Ramboll Group AS
- Saipem S.p.A.
- Schlumberger Ltd.
- Subsea 7 SA
- TechnipFMC plc
- Weatherford International Plc
- Worley Ltd.
Qualitative and quantitative analysis of companies has been conducted to help clients understand the wider business environment as well as the strengths and weaknesses of key industry players. Data is qualitatively analyzed to categorize companies as pure play, category-focused, industry-focused, and diversified; it is quantitatively analyzed to categorize companies as dominant, leading, strong, tentative, and weak.
Recent Development and News in Offshore decommissioning market
- In March, 2025, the European Union introduced the Circular Economy and Marine Stewardship Directive, which mandates a minimum of 95 percent material recycling or reuse for decommissioned offshore structures.
- In April, 2025, technology firm rahd.AI launched a specialized platform designed to reduce decommissioning expenditures by utilizing AI models trained on thousands of wells and platforms for more precise project planning.
- In January, 2025, Petronas released its Activity Outlook for 2025-2027, which prioritized the deployment of innovative decommissioning solutions and slated thirty-seven offshore facilities for removal.
- In May, 2025, a collaborative report by ASEAN energy ministries revealed that the collective decommissioning liability for the region's older offshore assets now exceeds $120 billion.
Dive into Technavio’s robust research methodology, blending expert interviews, extensive data synthesis, and validated models for unparalleled Offshore Decommissioning Market insights. See full methodology.
| Market Scope | |
|---|---|
| Page number | 320 |
| Base year | 2025 |
| Historic period | 2020-2024 |
| Forecast period | 2026-2030 |
| Growth momentum & CAGR | Accelerate at a CAGR of 7.9% |
| Market growth 2026-2030 | USD 3396.2 million |
| Market structure | Fragmented |
| YoY growth 2025-2026(%) | 7.3% |
| Key countries | UK, Norway, The Netherlands, Denmark, Germany, France, US, Mexico, Canada, Australia, China, Malaysia, Indonesia, India, Thailand, Brazil, Argentina, Colombia, Nigeria, Angola, Egypt, Saudi Arabia and UAE |
| Competitive landscape | Leading Companies, Market Positioning of Companies, Competitive Strategies, and Industry Risks |
Research Analyst Overview
- The offshore decommissioning market is defined by a sequence of highly specialized activities essential for the safe and environmentally responsible closure of offshore energy assets. The process begins with well plugging and abandonment, a critical phase involving reservoir isolation through precise cement barrier placement and mechanical plug application to ensure long-term well integrity management.
- This is followed by topside de-energization and hazardous materials neutralization. The subsequent platform removal stage addresses both shallow water removals and deepwater decommissioning, utilizing advanced cold-cutting techniques and modular dismantling. Operations are heavily reliant on a specialized fleet for heavy-lift vessel operations, increasingly employing single-lift methodology for topside deconstruction and the removal of jacket structure removal.
- For subsea infrastructure removal, remotely operated vehicles and autonomous underwater vehicles deploy subsea cutting tools like diamond wire saws. As the volume of aging steel jacket platforms and concrete gravity structures grows, so does the importance of effective waste stream management and circular economy principles, driving demand for material reuse and recycling and rigs-to-reefs programs.
What are the Key Data Covered in this Offshore Decommissioning Market Research and Growth Report?
-
What is the expected growth of the Offshore Decommissioning Market between 2026 and 2030?
-
USD 3.40 billion, at a CAGR of 7.9%
-
-
What segmentation does the market report cover?
-
The report is segmented by Type (Shallow water, and Deepwater), Service (Well plugging and abandonment, Platform removal, Permitting and regulatory compliance, Platform preparation, and Others), Application (Topside, and Substructure), Business Segment (Complete removal, Partial removal, and Leave in place) and Geography (Europe, North America, APAC, South America, Middle East and Africa)
-
-
Which regions are analyzed in the report?
-
Europe, North America, APAC, South America and Middle East and Africa
-
-
What are the key growth drivers and market challenges?
-
Maturation of offshore oil and gas infrastructure, High costs and monumental financial uncertainty
-
-
Who are the major players in the Offshore Decommissioning Market?
-
Aker Solutions ASA, Allseas Group SA, Archer Ltd., Baker Hughes Co., Boskalis, DeepOcean Group Holding BV, Expro Group Holdings NV, Heerema International Group, Helix Energy Solutions Group, John Wood Group PLC, Larsen and Toubro Ltd., McDermott International Ltd., Oceaneering International Inc., Ramboll Group AS, Saipem S.p.A., Schlumberger Ltd., Subsea 7 SA, TechnipFMC plc, Weatherford International Plc and Worley Ltd.
-
Market Research Insights
- Strategic late-life asset management is reshaping the offshore decommissioning market, with an emphasis on improving the asset retirement lifecycle and achieving cost compression strategies. Operators are shifting toward integrated service models and collaborative contracting models to streamline the cessation of production strategy. These frameworks often include risk-sharing agreements that improve operational efficiency improvement and optimize technical deployment frameworks.
- The end-of-life process management now involves sophisticated structural integrity assessment and advanced pigging solutions to handle legacy infrastructure degradation. This focus on efficiency is quantifiable, as campaign-based decommissioning approaches can reduce project timelines by up to 20%, while sustainable dismantling practices improve material recovery rate optimization by over 15%, enhancing alignment with environmental stewardship standards.
We can help! Our analysts can customize this offshore decommissioning market research report to meet your requirements.
 RIA -
RIA - 
