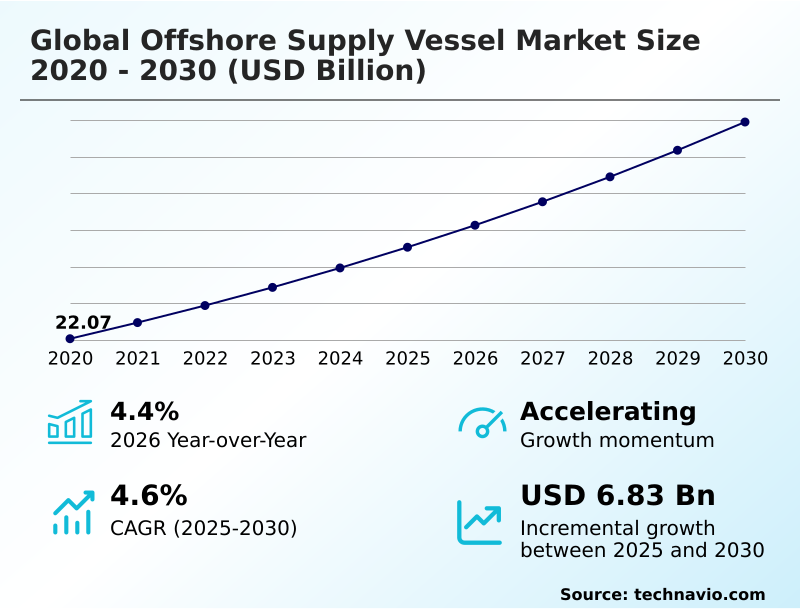
Offshore Supply Vessel Market Size 2026-2030
The offshore supply vessel market size is valued to increase by USD 6.83 billion, at a CAGR of 4.6% from 2025 to 2030. Resurgence of deepwater oil and gas exploration and production activities will drive the offshore supply vessel market.
Major Market Trends & Insights
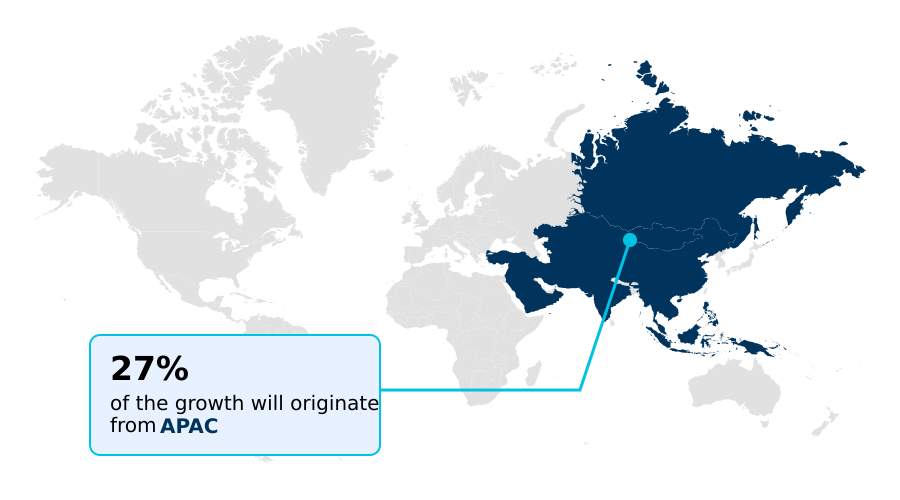
- APAC dominated the market and accounted for a 26.6% growth during the forecast period.
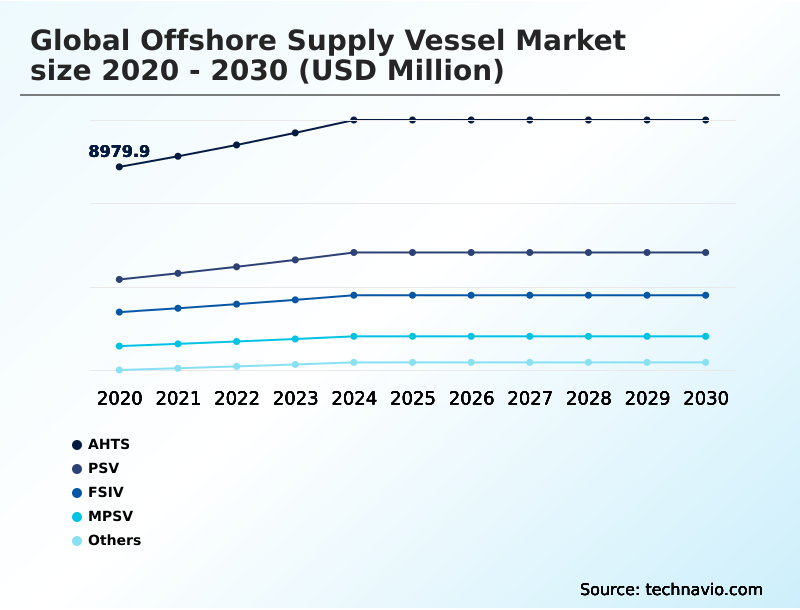
- By Type - AHTS segment was valued at USD 10.65 billion in 2024
- By End-user - Offshore oil and gas segment accounted for the largest market revenue share in 2024
Market Size & Forecast
- Market Opportunities: USD 11.82 billion
- Market Future Opportunities: USD 6.83 billion
- CAGR from 2025 to 2030 : 4.6%
Market Summary
- The Offshore Supply Vessel Market is undergoing a significant transformation, driven by renewed investment in offshore energy projects and the rapid expansion of renewable infrastructure. This evolution necessitates a focus on fleet modernization, with operators prioritizing vessels equipped with dynamic positioning systems and advanced automation to handle complex deepwater operations.
- A key trend is the adoption of hybrid propulsion systems and low-emission energy storage solutions to meet stringent environmental regulations and reduce operational costs. For instance, a vessel operator can optimize fuel consumption during standby operations by leveraging battery power, leading to significant emission reductions and enhanced efficiency.
- Simultaneously, the market is influenced by the need for specialized assets like commissioning service operation vessels to support the growing offshore wind sector. These dynamics are reshaping the competitive landscape, where technological sophistication, environmental compliance, and operational excellence in subsea construction support are paramount for sustaining growth and profitability.
- This shift requires a strategic approach to both fleet management and service delivery.
What will be the Size of the Offshore Supply Vessel Market during the forecast period?
Get Key Insights on Market Forecast (PDF) Get Free Sample
How is the Offshore Supply Vessel Market Segmented?
The offshore supply vessel industry research report provides comprehensive data (region-wise segment analysis), with forecasts and estimates in "USD million" for the period 2026-2030, as well as historical data from 2020-2024 for the following segments.
- Type
- AHTS
- PSV
- FSIV
- MPSV
- Others
- End-user
- Offshore oil and gas
- Offshore wind
- Propulsion
- Conventional diesel-powered
- LNG-powered
- Hybrid or electric
- Geography
- APAC
- China
- Australia
- India
- Europe
- UK
- Germany
- France
- North America
- US
- Canada
- Mexico
- Middle East and Africa
- Saudi Arabia
- UAE
- South Africa
- South America
- Brazil
- Argentina
- Rest of World (ROW)
- APAC
By Type Insights
The ahts segment is estimated to witness significant growth during the forecast period.
The Anchor Handling Tug Supply (AHTS) segment represents a critical vertical, defined by high-volume capacity and technical versatility essential for subsea construction support. These vessels are engineered for complex tasks like rig moves and towing operations.
Demand is propelled by a resurgence in deepwater exploration support, requiring high-bollard-pull anchor handling capabilities. Modernization is driving the adoption of advanced telematics and exhaust gas recirculation technologies to meet sustainability mandates.
As the market tightens, marketed utilization for the AHTS fleet is strengthening to 77 percent, supported by a renewed wave of offshore engineering procurement and installation investment.
This necessitates a strategic focus on asset life-extension programs and upgrades to maintain fleet operational efficiency in a competitive landscape.
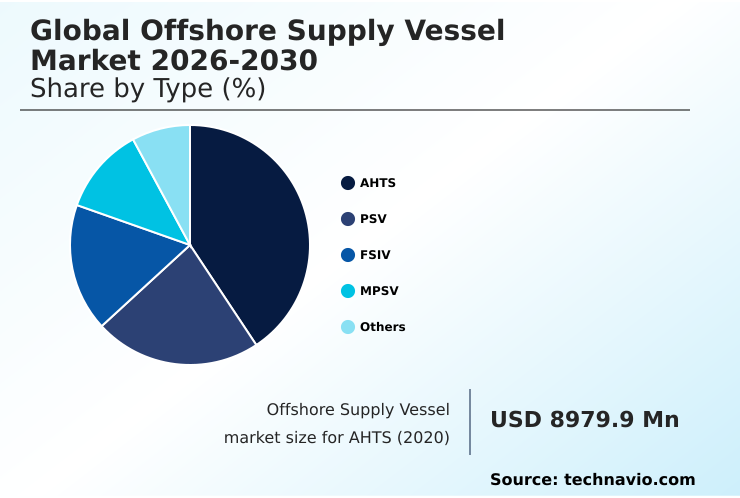
The AHTS segment was valued at USD 10.65 billion in 2024 and showed a gradual increase during the forecast period.
Regional Analysis
APAC is estimated to contribute 26.6% to the growth of the global market during the forecast period.Technavio’s analysts have elaborately explained the regional trends and drivers that shape the market during the forecast period.
See How Offshore Supply Vessel Market Demand is Rising in APAC Get Free Sample
The geographic landscape is evolving, with APAC emerging as the fastest-growing region, accounting for 26.6% of the market's incremental growth, slightly ahead of the Middle East and Africa's 23.4%.
This expansion is fueled by massive investments in offshore engineering procurement and deepwater exploration support. In this region, a focus on local content requirements is driving investment in maritime logistics infrastructure and specialized training centers.
The need for subsea robotics and advanced subsea production systems is particularly high, supporting complex marine supply operations.
This surge has created a shortage of high-specification vessels, prompting operators to prioritize fleet rejuvenation and upgrades and invest in marine transportation services to meet the technical demands of modern projects and secure a competitive edge.
Market Dynamics
Our researchers analyzed the data with 2025 as the base year, along with the key drivers, trends, and challenges. A holistic analysis of drivers will help companies refine their marketing strategies to gain a competitive advantage.
- The Offshore Supply Vessel Market's trajectory is increasingly defined by a sophisticated cost-benefit analysis of walk-to-work systems and other advanced technologies. Strategic fleet consolidation for market share is a dominant theme, as operators grapple with managing fleet obsolescence with retrofitting programs.
- The role of OSVs in decommissioning old infrastructure is creating a new, stable revenue stream, while OSV support for carbon capture infrastructure represents a significant future growth area. A detailed analysis comparing AHTS and PSV operational costs reveals nuanced trade-offs based on project-specific requirements.
- The market drivers for Jones Act-compliant vessels continue to shape the domestic landscape, particularly with the rise of offshore wind projects. Key challenges of hybrid propulsion system integration are being addressed, as the ROI of battery energy storage on supply vessels becomes more favorable; early adopters report efficiency gains more than 15% higher than conventional vessels.
- The impact of digital twin technology on fleet management is profound, enabling operators to optimize fuel consumption with predictive maintenance. Moreover, improving safety with autonomous navigation technology is a top priority, mitigating geopolitical risk impact on charter rates. The role of MPSVs in subsea telecommunications support is expanding, alongside subsea inspection using remotely operated vehicles.
- Efficiency gains from digital operational excellence are critical for compliance with IMO Tier III emission standards, as modernizing fleets for deepwater exploration becomes a necessity. Specialized vessel requirements for floating offshore wind and the benefits of LNG propulsion in emission control areas are also shaping future investment decisions.
What are the key market drivers leading to the rise in the adoption of Offshore Supply Vessel Industry?
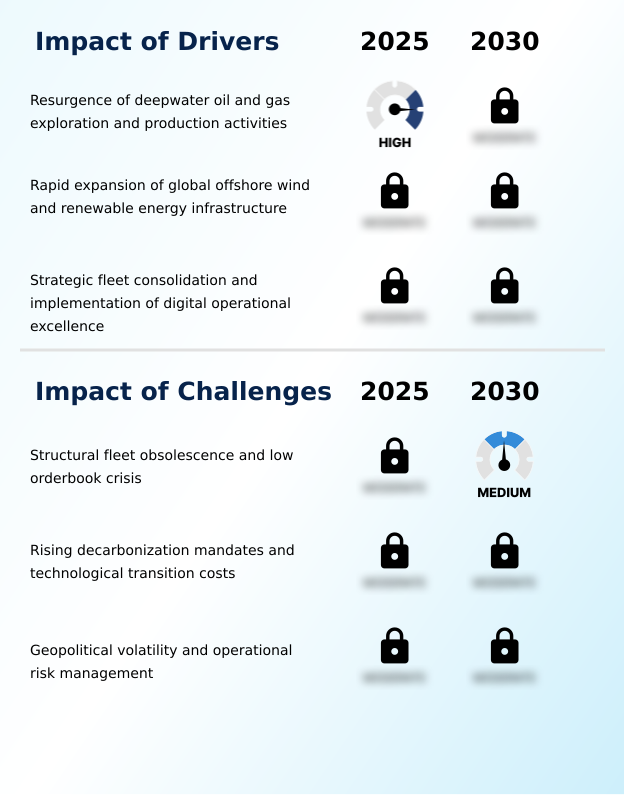
- A key driver for the market is the resurgence of deepwater oil and gas exploration and production activities, which is increasing the demand for high-specification support vessels.
- Renewed focus on deepwater hydrocarbon exploration is a primary driver, increasing demand for high-specification platform supply vessels and anchor handling tug supply vessels. These projects require advanced dynamic positioning systems and substantial deck capacities, tightening the supply of modern assets.
- Charterers are prioritizing fuel-efficient vessels, with modern fleets showing up to 15% better fuel economy than older counterparts.
- Simultaneously, unprecedented growth in the offshore wind sector diversifies the demand base, requiring specialized offshore energy support vessels for wind farm installation support. The development of floating offshore wind technology creates a new market for high-bollard-pull anchor handling.
- This dual-demand environment is fueling strategic fleet consolidation and digital operational excellence to maximize vessel utilization and profitability across both energy sectors.
What are the market trends shaping the Offshore Supply Vessel Industry?
- A primary market trend is the integration of hybrid propulsion and low-emission energy storage systems. This shift is driven by stricter regulations and demands for decarbonization from major energy producers.
- The market is undergoing a structural shift toward decarbonization, driven by the adoption of hybrid propulsion systems and advanced battery energy storage. These green shipping incentives allow for optimized engine loads, reducing emissions and fuel consumption by up to 35% during standby operations.
- This move toward electrification, supported by shore-power capabilities and maturing marine-grade batteries, is becoming a prerequisite for securing long-term charters. Furthermore, the strategic pivot to the offshore wind sector is creating demand for specialized commissioning service operation vessels with walk-to-work capabilities.
- This diversification provides predictable revenue streams, as longevity of wind projects often surpasses traditional oil and gas contracts by over a decade. The adoption of advanced motion-compensated gangways and heavy-lift cranes is essential for this segment.
What challenges does the Offshore Supply Vessel Industry face during its growth?
- The industry faces a significant challenge from structural fleet obsolescence and a low orderbook, creating a supply bottleneck for modern, high-specification vessels.
- The market faces a critical challenge from structural fleet obsolescence, with a significant portion of the global fleet now exceeding 15 years of age. These older vessels often lack the fuel-efficient propulsion and dynamic positioning systems required for modern deep-water projects, creating a bottleneck as charterers demand higher-specification tonnage.
- Compounding this, rising decarbonization mandates necessitate costly investments in hybrid propulsion systems and battery energy storage, with retrofitting costs sometimes approaching 40% of a vessel's market value. This creates a two-tiered market where eco-friendly vessels command premium rates, marginalizing conventional tonnage.
- Geopolitical volatility further complicates operations, increasing insurance premiums and security expenditures, which can elevate operating expenses by over 10% in high-risk regions.
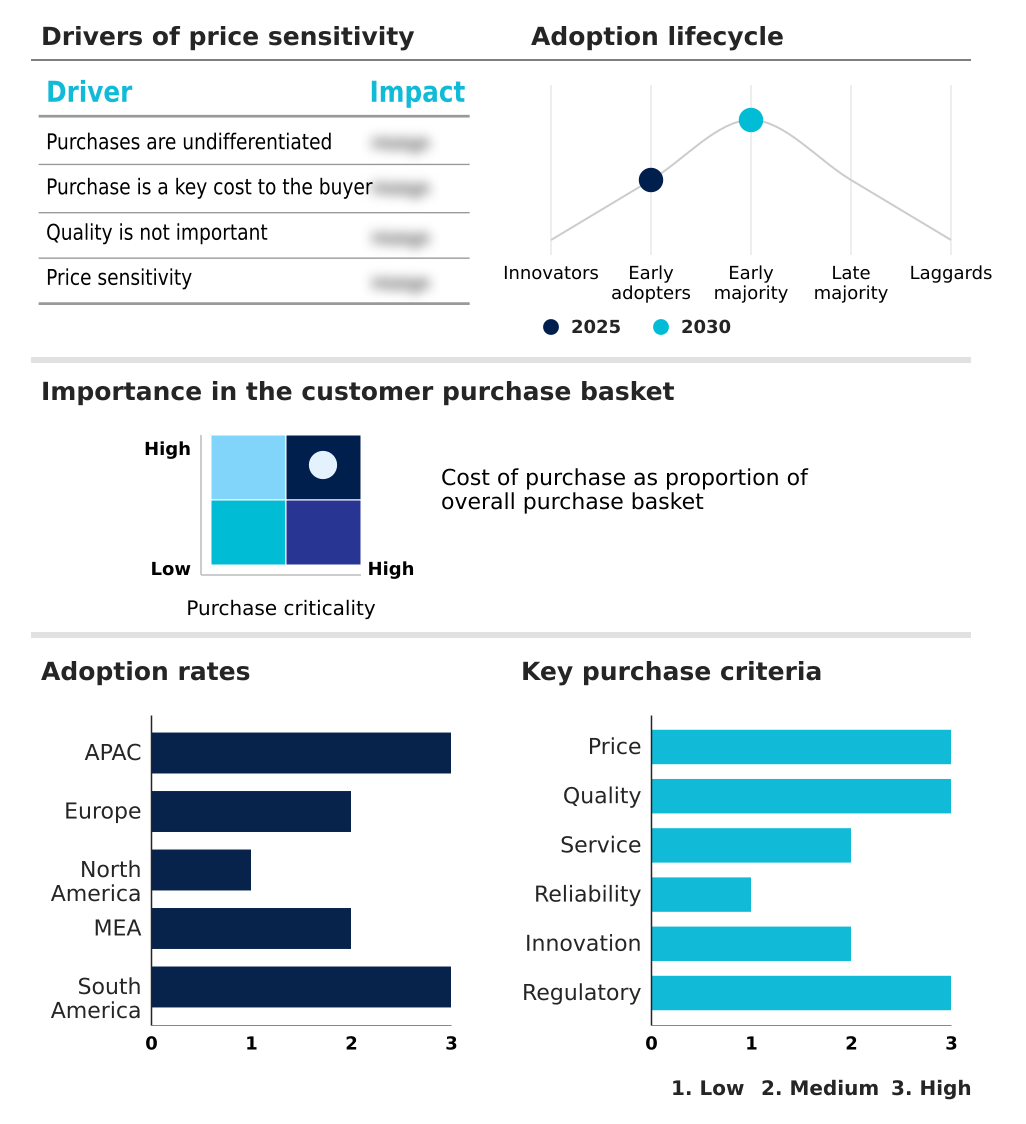
Exclusive Technavio Analysis on Customer Landscape
The offshore supply vessel market forecasting report includes the adoption lifecycle of the market, covering from the innovator’s stage to the laggard’s stage. It focuses on adoption rates in different regions based on penetration. Furthermore, the offshore supply vessel market report also includes key purchase criteria and drivers of price sensitivity to help companies evaluate and develop their market growth analysis strategies.
Customer Landscape of Offshore Supply Vessel Industry
Competitive Landscape
Companies are implementing various strategies, such as strategic alliances, offshore supply vessel market forecast, partnerships, mergers and acquisitions, geographical expansion, and product/service launches, to enhance their presence in the industry.
AP Moller Maersk AS - Key offerings center on providing specialized offshore logistics support and integrated marine supply operations for global energy projects.
The industry research and growth report includes detailed analyses of the competitive landscape of the market and information about key companies, including:
- AP Moller Maersk AS
- Bass Marine Pty Ltd.
- Bourbon Maritime
- Damen Shipyards Group
- DP World
- Eastern Shipbuilding Inc.
- Edison Chouest Offshore Co.
- Harren Group
- Harvey Gulf Intl. Marine
- Havila Shipping ASA
- Hornbeck Offshore Services
- Island Offshore Management AS
- SEACOR Marine Holdings Inc.
- Siem Offshore Inc.
- Solstad Offshore ASA
- Tidewater Inc.
- Van Aalst Group B.V.
- Vroon BV
- Wartsila Corp.
Qualitative and quantitative analysis of companies has been conducted to help clients understand the wider business environment as well as the strengths and weaknesses of key industry players. Data is qualitatively analyzed to categorize companies as pure play, category-focused, industry-focused, and diversified; it is quantitatively analyzed to categorize companies as dominant, leading, strong, tentative, and weak.
Recent Development and News in Offshore supply vessel market
- In May, 2025, Tidewater Inc. reported strong first-quarter financial performance, attributing its success to investments in fleet uptime and the integration of advanced digital tracking across its global platform.
- In April, 2025, Bourbon Corporation announced a major fleet expansion, acquiring thirteen high-specification offshore support vessels, including several diesel-electric platform supply vessels, to capitalize on rising deepwater demand.
- In March, 2025, Tidewater Inc. announced the successful acquisition of the 22-vessel fleet of Wilson Sons Ultratug, significantly strengthening its operational presence and integrated logistical solutions in the Brazilian offshore market.
- In January, 2025, Acta Marine took delivery of the Acta Pegasus, the first in a new series of advanced offshore energy support vessels featuring a methanol-ready propulsion system and designed for the offshore wind sector.
Dive into Technavio’s robust research methodology, blending expert interviews, extensive data synthesis, and validated models for unparalleled Offshore Supply Vessel Market insights. See full methodology.
| Market Scope | |
|---|---|
| Page number | 303 |
| Base year | 2025 |
| Historic period | 2020-2024 |
| Forecast period | 2026-2030 |
| Growth momentum & CAGR | Accelerate at a CAGR of 4.6% |
| Market growth 2026-2030 | USD 6832.8 million |
| Market structure | Fragmented |
| YoY growth 2025-2026(%) | 4.4% |
| Key countries | China, Australia, India, South Korea, Japan, Indonesia, UK, Germany, France, Italy, Spain, The Netherlands, US, Canada, Mexico, Saudi Arabia, UAE, South Africa, Turkey, Israel, Brazil, Argentina and Chile |
| Competitive landscape | Leading Companies, Market Positioning of Companies, Competitive Strategies, and Industry Risks |
Research Analyst Overview
- The Offshore Supply Vessel Market is defined by a push toward technological sophistication and operational efficiency. The integration of dynamic positioning systems, advanced telematics, and autonomous marine systems is now standard for supporting subsea production systems and deepwater exploration support.
- Fleet modernization is paramount, with a clear trend toward LNG-powered propulsion, hybrid propulsion systems, and battery energy storage to meet green shipping incentives and carbon pricing mechanisms. Specialized assets such as anchor handling tug supply vessels, platform supply vessels, and commissioning service operation vessels with walk-to-work systems and motion-compensated gangways are in high demand.
- These vessels are crucial for subsea construction support, subsea inspection maintenance and repair, and floating offshore wind technology projects. Boardroom decisions are heavily influenced by the need to invest in digital twin technology and predictive maintenance to enhance fleet operational efficiency, with some operators reporting a 30% reduction in unplanned downtime.
- The deployment of remotely operated vehicle deployment systems, heavy-lift cranes, and integrated marine systems is becoming a key differentiator. The industry's evolution is also shaped by the need for Jones Act-compliant vessels, the adoption of selective catalytic reduction and exhaust gas recirculation for emissions control, and investment in maritime logistics infrastructure and specialized training centers.
- Dual-fuel engines and vessel automation technologies further underscore the focus on high-bollard-pull anchor handling, low-emission energy storage, and marine propulsion systems.
What are the Key Data Covered in this Offshore Supply Vessel Market Research and Growth Report?
-
What is the expected growth of the Offshore Supply Vessel Market between 2026 and 2030?
-
USD 6.83 billion, at a CAGR of 4.6%
-
-
What segmentation does the market report cover?
-
The report is segmented by Type (AHTS, PSV, FSIV, MPSV, and Others), End-user (Offshore oil and gas, and Offshore wind), Propulsion (Conventional diesel-powered, LNG-powered, and Hybrid or electric) and Geography (APAC, Europe, North America, Middle East and Africa, South America)
-
-
Which regions are analyzed in the report?
-
APAC, Europe, North America, Middle East and Africa and South America
-
-
What are the key growth drivers and market challenges?
-
Resurgence of deepwater oil and gas exploration and production activities , Structural fleet obsolescence and low orderbook crisis
-
-
Who are the major players in the Offshore Supply Vessel Market?
-
AP Moller Maersk AS, Bass Marine Pty Ltd., Bourbon Maritime, Damen Shipyards Group, DP World, Eastern Shipbuilding Inc., Edison Chouest Offshore Co., Harren Group, Harvey Gulf Intl. Marine, Havila Shipping ASA, Hornbeck Offshore Services, Island Offshore Management AS, SEACOR Marine Holdings Inc., Siem Offshore Inc., Solstad Offshore ASA, Tidewater Inc., Van Aalst Group B.V., Vroon BV and Wartsila Corp.
-
Market Research Insights
- The market's dynamics are shaped by a strategic pivot toward operational efficiency and diversification. Key marine transportation services are being enhanced through fleet rejuvenation and upgrades, with operators achieving up to 35% improvement in fuel efficiency by adopting hybrid power.
- This focus on fleet uptime and operational excellence is critical as charterers prioritize assets that can perform complex well intervention tasks and subsea construction and maintenance with minimal downtime. The expansion into wind farm installation support and subsea cable laying provides a counter-cyclical revenue stream, with utilization rates for specialized vessels reaching 77% in key regions.
- Furthermore, the emphasis on local content requirements and integrated logistical solutions is compelling vessel owners to invest in specialized training centers and local partnerships to secure long-term contracts.
We can help! Our analysts can customize this offshore supply vessel market research report to meet your requirements.
 RIA -
RIA - 
