Offshore Wind Cable Laying Vessel Market Size 2025-2029
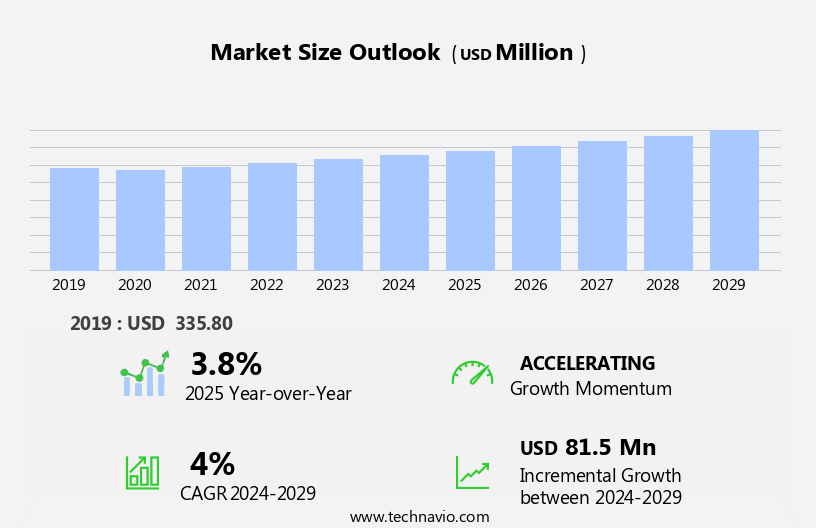
The offshore wind cable laying vessel market size is forecast to increase by USD 81.5 million, at a CAGR of 4% between 2024 and 2029.
- The market is experiencing significant growth due to the increasing demand for renewable energy, particularly offshore wind energy. This trend is driven by governments' commitments to reduce carbon emissions and the depletion of traditional energy sources. New offshore wind cable laying vessels are being introduced to meet the demand for installing and maintaining the underwater power cables required for offshore wind farms. However, the market faces challenges that could hinder its growth. Regulatory and environmental issues are major obstacles. Regulations regarding the installation and operation of offshore wind farms vary from country to country, making it essential for companies to navigate these complexities.
- Environmental concerns, such as the potential impact on marine life, must also be addressed to ensure the sustainability of offshore wind energy projects. Additionally, the high capital investment required for building and operating offshore wind cable laying vessels poses a challenge for smaller players in the market. The vessels' size, complexity, and advanced technology increase the cost of production and maintenance. Companies must carefully evaluate their resources and strategies to remain competitive in the market. Despite these challenges, the future of the market looks promising. Innovations in technology, such as the development of smaller, more cost-effective vessels, and the increasing collaboration between industry players and governments, are expected to drive growth in the market.
- Furthermore, the growing demand for renewable energy and the need for reliable and efficient cable laying solutions will continue to fuel market opportunities.
What will be the Size of the Offshore Wind Cable Laying Vessel Market during the forecast period?
The market is characterized by continuous evolution and dynamism, driven by the ongoing unfolding of market activities and evolving patterns. This market plays a crucial role in the offshore wind industry, facilitating the connection of offshore wind farms to the power grid. Risk assessment and oceanographic data are integral components of cable routing and seabed mapping, ensuring regulatory compliance and marine construction. Rock dumping and cable repair are essential for maintaining the integrity of subsea cables, while investment incentives and return on investment are key considerations for stakeholders. Environmental impact assessment and management are essential for mitigating the environmental impact of offshore wind development.
Best practices, project management, and engineering design are critical for ensuring safe and efficient cable installation and maintenance. Weather forecasting and offshore logistics are essential for optimizing heavy lift operations and workforce development. Grid integration and marine renewable energy are driving the renewable energy transition, while safety management and meteorological data are crucial for ensuring the safe and efficient operation of cable laying vessels. Technology advancement, including cable routing software and cable monitoring systems, is transforming the market, enabling more accurate and efficient cable installation and maintenance. Climate change and carbon emission reduction are also significant factors, driving the need for more sustainable and eco-friendly solutions in the offshore wind industry.
Foundation installation and cable protection are essential for ensuring the long-term viability of offshore wind farms. Geotechnical investigation and cable burial are crucial for minimizing the impact on the seabed morphology and ensuring the safe and efficient operation of offshore wind turbines. Industry standards and policy frameworks are evolving to address the unique challenges of the market. Cable termination and subsea survey are essential for ensuring the long-term reliability and performance of offshore wind farms. In summary, the market is a dynamic and evolving market, driven by the ongoing unfolding of market activities and evolving patterns. It plays a crucial role in the offshore wind industry, facilitating the connection of offshore wind farms to the power grid and enabling the renewable energy transition.
How is this Offshore Wind Cable Laying Vessel Industry segmented?
The offshore wind cable laying vessel industry research report provides comprehensive data (region-wise segment analysis), with forecasts and estimates in "USD million" for the period 2025-2029, as well as historical data from 2019-2023 for the following segments.
- Type
- Shallow water
- Deep water
- Product
- 50-150 meters
- Above 150 meters
- Below 50 meters
- Geography
- North America
- US
- Europe
- Denmark
- France
- Germany
- The Netherlands
- UK
- APAC
- China
- India
- Japan
- South Korea
- Rest of World (ROW)
- North America
By Type Insights
The shallow water segment is estimated to witness significant growth during the forecast period.
Shallow water offshore wind cable laying vessels are essential for installing and maintaining wind farms in coastal regions, particularly in areas with water depths ranging from 0 to 50 meters. These vessels are smaller and more cost-effective than deep-water counterparts, making them the go-to choice for offshore wind development in relatively stable seabed conditions. The North Sea and Baltic Sea are prime locations where these vessels are extensively employed due to their proximity to the shore. The installation process involves a series of intricate procedures, including risk assessment, oceanographic data analysis, and cable routing, which are crucial for ensuring the successful deployment of subsea cables.
Seabed mapping and regulatory compliance are also vital to prevent damage to the seabed and protect marine life. Marine construction techniques, such as rock dumping and foundation installation, are employed to secure the wind turbines in place. Cable repair and maintenance are ongoing requirements for the efficient operation of offshore wind farms. Best practices, engineering design, and project management are essential to minimize downtime and optimize return on investment. Environmental impact assessment and management, including cable fault detection and environmental impact mitigation, are critical components of the offshore wind industry's sustainability efforts. The offshore wind industry's transition to renewable energy sources is accelerating, driven by climate change concerns and investment incentives.
The integration of offshore wind farms into the grid and marine renewable energy logistics are becoming increasingly important. Safety management and meteorological data analysis are essential for ensuring the safe and efficient operation of cable laying vessels and offshore wind farms. Technology advancements, such as cable routing software and carbon emission reduction strategies, are driving innovation in the industry. Heavy lift operations, industry standards, and research & development are key areas of focus for enhancing the efficiency and sustainability of offshore wind farm construction and maintenance. Skill gaps and workforce development are also critical challenges that the industry must address to ensure the long-term success of offshore wind development.
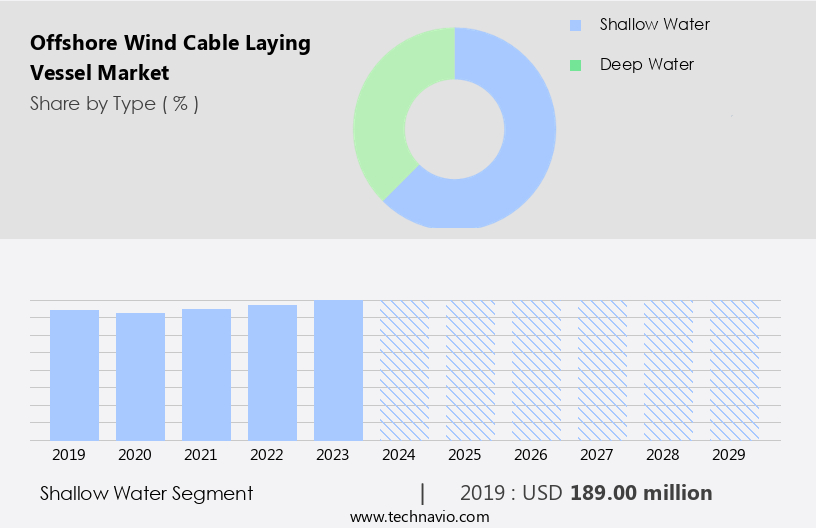
The Shallow water segment was valued at USD 189.00 million in 2019 and showed a gradual increase during the forecast period.
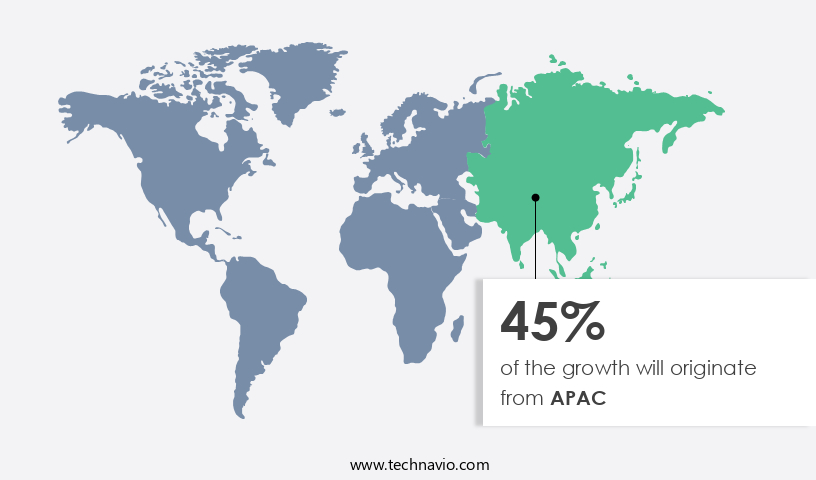
Regional Analysis
APAC is estimated to contribute 45% to the growth of the global market during the forecast period.Technavio’s analysts have elaborately explained the regional trends and drivers that shape the market during the forecast period.
Europe is the most advanced region in The market, accounting for a substantial share due to its established infrastructure and favorable policies. Key European countries, including Germany, the UK, France, Belgium, and Poland, are spearheading market growth by driving significant demand for offshore wind cable laying vessels. The UK, in particular, is leading the charge with ambitious offshore wind capacity targets. On September 3, 2024, the UK's Contract for Difference (CfD) Allocation Round 6 (AR6) awarded contracts for approximately 5.3 GW of capacity to various offshore wind developers. Orsted secured the largest CfD, receiving 2.4 GW for the Hornsea 4 project.
The offshore wind industry's expansion necessitates advanced cable laying technologies, including dynamic positioning systems, risk assessments, oceanographic data, cable routing, seabed mapping, and regulatory compliance. Marine construction, rock dumping, cable repair, subsea cable installation, and cable laying equipment are essential components of the market. Return on investment, skill gaps, energy storage, seabed morphology, and climate change are critical factors influencing market trends. Environmental impact assessment, environmental management, cable fault detection, best practices, project management, engineering design, and policy framework are crucial elements of the market's evolution. Cable burial, cable maintenance, cable monitoring systems, subsea survey, foundation installation, cable protection, geotechnical investigation, green energy, and cable routing software are essential technologies driving market growth.
Carbon emission reduction, heavy lift operations, industry standards, offshore wind farm, supply vessel, construction management, cable termination, research & development, environmental impact mitigation, platform installation, investment incentives, offshore wind turbine, weather forecasting, offshore logistics, workforce development, grid integration, marine renewable energy, safety management, meteorological data, and technology advancement are shaping the market dynamics and trends.
Market Dynamics
Our researchers analyzed the data with 2024 as the base year, along with the key drivers, trends, and challenges. A holistic analysis of drivers will help companies refine their marketing strategies to gain a competitive advantage.
What are the key market drivers leading to the rise in the adoption of Offshore Wind Cable Laying Vessel Industry?
- The surge in demand for offshore wind energy serves as the primary market catalyst.
- The market is experiencing significant growth due to the increasing demand for offshore wind energy as a reliable and sustainable source of renewable energy. Offshore wind farms, which are essential for carbon emission reduction and meeting climate goals, offer advantages over onshore wind, including higher and more consistent wind speeds, lower visual impact, and the ability to be deployed in coastal areas with high energy demand. Europe, particularly countries like the UK, Germany, and Denmark, have been pioneers in offshore wind energy development. A crucial aspect of offshore wind farm construction involves the installation and protection of power cables.
- Cable monitoring systems, subsea surveys, geotechnical investigations, and cable routing software are essential components of this process. Foundation installation and heavy lift operations are also key aspects of offshore wind farm construction, which are managed through construction management systems and industry standards. Cable termination is another critical process that ensures the efficient transfer of power from the wind turbines to the shore. In conclusion, the market is driven by the global shift towards renewable energy sources and the unique advantages offered by offshore wind power. The market involves various processes, including cable installation, protection, and monitoring, as well as foundation installation and cable termination, all of which are essential for the successful deployment of offshore wind farms.
What are the market trends shaping the Offshore Wind Cable Laying Vessel Industry?
- The introduction of new offshore wind cable laying vessels represents a significant market trend in the renewable energy sector. These advanced vessels are essential for the deployment and maintenance of offshore wind farms, making them a crucial investment for companies operating in this industry.
- The market is experiencing notable growth due to the increasing demand for renewable energy and the expansion of offshore wind farms. Advanced vessels, outfitted with cutting-edge technologies, are being introduced to address the industry's requirements. For instance, the latest cable laying vessel from Van Oord nv, named Calypso, was commissioned on October 24, 2024, for the Sofia Offshore Wind Farm project. This vessel, similar to its predecessor, the Nexus, is engineered with innovative sustainable technologies, improving operational efficiency and reducing environmental impact. Key market drivers include research and development in marine renewable energy, platform installation, investment incentives, and grid integration.
- Additionally, environmental impact mitigation, safety management, meteorological data, and workforce development are essential considerations for market participants. Offshore logistics and technology advancements are also crucial factors shaping the market landscape. Weather forecasting plays a significant role in ensuring the safe and efficient installation of offshore wind turbines. As the industry continues to evolve, safety, sustainability, and cost-effectiveness will remain key priorities.
What challenges does the Offshore Wind Cable Laying Vessel Industry face during its growth?
- The growth of the industry is significantly influenced by regulatory and environmental challenges. These complex issues necessitate careful navigation to ensure compliance and sustainability.
- The market encounters intricate regulatory and environmental complexities, necessitating meticulous adherence from market participants. Regulatory compliance is a significant challenge, involving a labyrinthine permitting process that can prolong project timelines and escalate costs. For instance, the International Maritime Organization (IMO) mandates regulations for the secure transportation of hazardous materials on board vessels, including cable laying vessels. Moreover, stringent safety standards and procedures are imposed by regulatory bodies such as the US Coast Guard and the European Union Marine Equipment Directive. Environmental considerations are also crucial in offshore wind cable laying. Oceanographic data, including seabed mapping and cable routing, are essential for minimizing potential environmental risks.
- Cable repair and maintenance, as well as marine construction techniques like rock dumping, must adhere to environmental guidelines. Energy storage solutions are increasingly being integrated into offshore wind projects to ensure grid stability and reduce reliance on fossil fuels. Skill gaps in the workforce, particularly in specialized areas like subsea cable installation and dynamic positioning system operation, pose another challenge for market growth. Despite these hurdles, the potential return on investment from offshore wind energy projects remains compelling, making it a dynamic and evolving market.
Exclusive Customer Landscape
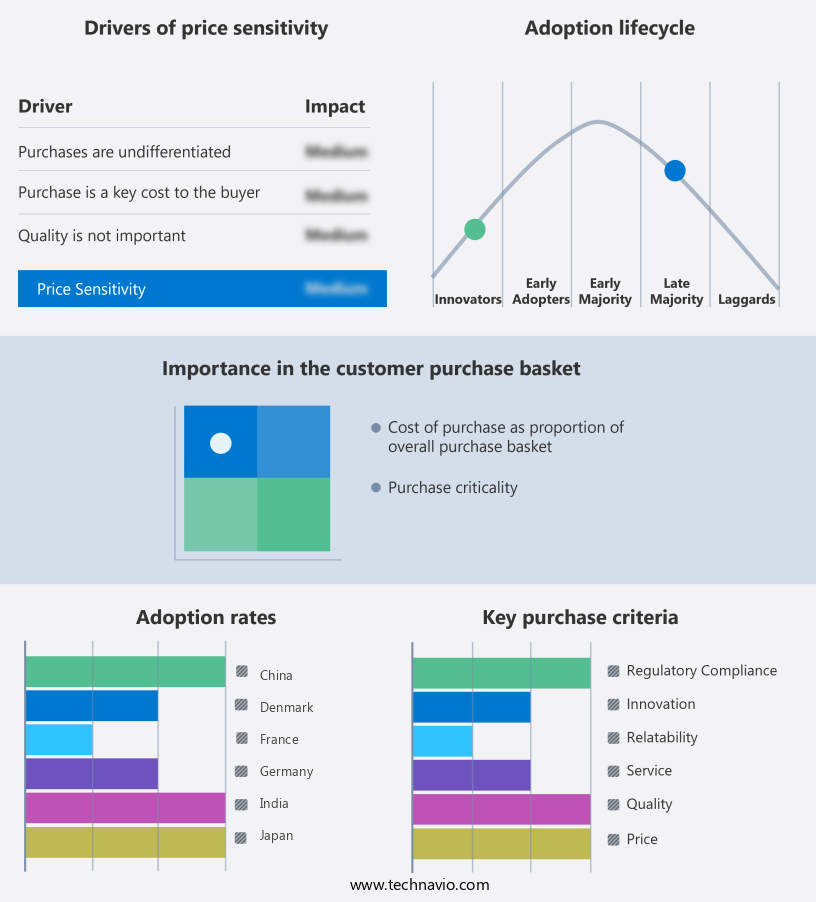
The offshore wind cable laying vessel market forecasting report includes the adoption lifecycle of the market, covering from the innovator’s stage to the laggard’s stage. It focuses on adoption rates in different regions based on penetration. Furthermore, the offshore wind cable laying vessel market report also includes key purchase criteria and drivers of price sensitivity to help companies evaluate and develop their market growth analysis strategies.
Customer Landscape
Key Companies & Market Insights
Companies are implementing various strategies, such as strategic alliances, offshore wind cable laying vessel market forecast, partnerships, mergers and acquisitions, geographical expansion, and product/service launches, to enhance their presence in the industry.
Boskalis - The company specializes in providing advanced offshore wind cable laying solutions through a fleet of state-of-the-art vessels, including the Boka Ocean, Ndurance, Bokabarge 82, Giant 7, Ndeavor, and BOKA Constructor. Our expertise lies in ensuring efficient and reliable cable installation for wind energy projects, enhancing their overall productivity and profitability. These vessels are engineered to navigate challenging offshore conditions, providing unparalleled flexibility and adaptability. With a focus on innovation and sustainability, we contribute to the growth of the renewable energy sector while minimizing environmental impact. Our team of experienced professionals is dedicated to delivering exceptional results, ensuring the success of our clients' wind energy initiatives.
The industry research and growth report includes detailed analyses of the competitive landscape of the market and information about key companies, including:
- Boskalis
- Fincantieri Spa
- Jan De Nul
- PaxOcean
- Royal IHC
- Ulstein Group ASA
- Van Oord nv
- Vouvray Acquisition Ltd.
Qualitative and quantitative analysis of companies has been conducted to help clients understand the wider business environment as well as the strengths and weaknesses of key industry players. Data is qualitatively analyzed to categorize companies as pure play, category-focused, industry-focused, and diversified; it is quantitatively analyzed to categorize companies as dominant, leading, strong, tentative, and weak.
Recent Development and News in Offshore Wind Cable Laying Vessel Market
- In February 2023, Boskalis, a leading global maritime services provider, announced the successful completion of the world's first full-scale demonstration of its innovative cable laying system, HTW10, for offshore wind farms. This advanced system, which can lay cables up to 10,000 volts, significantly increases the efficiency and capacity of offshore wind cable laying (Boskalis, 2023).
- In May 2024, Siemens Energy and James Fisher Offshore, a leading provider of engineering solutions for the offshore energy sector, formed a strategic partnership to offer integrated offshore wind solutions, combining Siemens Energy's wind turbines and grid connections with James Fisher Offshore's cable installation and maintenance services (Siemens Energy, 2024).
- In October 2024, the European Investment Bank (EIB) approved a â¬1.3 billion (USD1.4 billion) loan to fund the construction of the Dogger Bank Wind Farm, the world's largest offshore wind farm, located in the North Sea. The project will require several cable-laying vessels to connect the wind farm to the grid (European Investment Bank, 2024).
- In January 2025, Heerema Marine Contractors, a global marine contractor, launched its newbuild vessel, Aegir, the world's largest offshore wind installation and cable-laying vessel, capable of installing foundations, turbines, and laying cables in one single vessel (Heerema Marine Contractors, 2025).
Research Analyst Overview
- The market is witnessing significant advancements, driven by the increasing adoption of renewable energy sources. Cable repair technology and cable armoring are crucial components in ensuring the durability and reliability of high-voltage AC underwater cables. Oceanographic modeling and hydrographic survey are essential for accurate seabed classification and geotechnical testing, enabling efficient cable laying and installation. Jack-up rigs and construction barges are commonly used for installing rock installation systems and cable protection systems, while subsea connector termination equipment and cable splicing are vital for cable joining and connection. Cable testing equipment, marine navigation positioning systems, and environmental monitoring tools are integral to ensuring the optimal performance of cable laying vessels.
- Subsea survey vessels and crane vessels play a crucial role in cable fault location and cable insulation maintenance. High-tech subsea trenching machines facilitate the creation of protective trenches for cable protection. The integration of advanced cable sheathing and insulation materials enhances the cable's resistance to external factors, ensuring a longer lifespan. In summary, the market is characterized by continuous innovation and development, driven by the need for efficient and reliable cable installation and maintenance. Key technologies, such as cable repair, oceanographic modeling, and geotechnical testing, are transforming the industry, enabling the expansion of renewable energy infrastructure.
Dive into Technavio’s robust research methodology, blending expert interviews, extensive data synthesis, and validated models for unparalleled Offshore Wind Cable Laying Vessel Market insights. See full methodology.
|
Market Scope |
|
|
Report Coverage |
Details |
|
Page number |
186 |
|
Base year |
2024 |
|
Historic period |
2019-2023 |
|
Forecast period |
2025-2029 |
|
Growth momentum & CAGR |
Accelerate at a CAGR of 4% |
|
Market growth 2025-2029 |
USD 81.5 million |
|
Market structure |
Concentrated |
|
YoY growth 2024-2025(%) |
3.8 |
|
Key countries |
China, The Netherlands, UK, Denmark, France, US, Germany, South Korea, Japan, and India |
|
Competitive landscape |
Leading Companies, Market Positioning of Companies, Competitive Strategies, and Industry Risks |
What are the Key Data Covered in this Offshore Wind Cable Laying Vessel Market Research and Growth Report?
- CAGR of the Offshore Wind Cable Laying Vessel industry during the forecast period
- Detailed information on factors that will drive the growth and forecasting between 2025 and 2029
- Precise estimation of the size of the market and its contribution of the industry in focus to the parent market
- Accurate predictions about upcoming growth and trends and changes in consumer behaviour
- Growth of the market across Europe, APAC, North America, South America, and Middle East and Africa
- Thorough analysis of the market’s competitive landscape and detailed information about companies
- Comprehensive analysis of factors that will challenge the offshore wind cable laying vessel market growth of industry companies
We can help! Our analysts can customize this offshore wind cable laying vessel market research report to meet your requirements.
 RIA -
RIA - 
