Oilfield Casing Spools Market Size 2025-2029
The oilfield casing spools market size is forecast to increase by USD 49.8 million at a CAGR of 6.8% between 2024 and 2029.
- The market is experiencing significant growth, driven primarily by increasing investments in upstream oil and gas operations. This trend is expected to continue as energy companies focus on expanding their production capabilities to meet rising global demand. Another key driver is the development of intelligent well completion technologies, which are improving drilling efficiency and reducing operational costs. However, the market is not without challenges. Fluctuation in oil and gas prices poses a significant risk, as price volatility can impact demand and profitability. To navigate these challenges and capitalize on opportunities, companies must stay informed of market trends and be agile in their business strategies.
- By investing in innovation and operational efficiency, they can mitigate risks and maintain a competitive edge in the market. Overall, the market presents a promising landscape for growth, with opportunities for companies that can effectively address the needs of the upstream oil and gas industry while navigating the challenges of price volatility.
What will be the Size of the Oilfield Casing Spools Market during the forecast period?

- The market encompasses the production and supply of essential components used in drilling processes, including casing spools, casing heads, tubing heads, and wellhead systems. These elements play a pivotal role in ensuring structural integrity, pressure regulation, and safety in oil and gas exploration activities. Casing spools, specifically, serve as the foundation for wellbore construction and provide a seamless connection between different sections of casing. Manufacturing facilities produce casing spools in various configurations, such as straight bore, landing shoulder, threaded outlets, and studded outlets, to accommodate diverse drilling conditions. The market is driven by the increasing demand for drilling operations in both terrestrial and marine environments, where casing spools are subjected to corrosive elements and extreme pressure.
- Safety concerns are paramount in the market, as these components must maintain structural integrity under high pressure and in harsh conditions. To address this need, manufacturers prioritize low alloy materials with superior mechanical properties and ecoconscious and sustainable practices to minimize energy consumption and reduce environmental impact. Additionally, the market is focused on pressure control and fluid returns to optimize drilling efficiency and minimize operational costs.
How is this Oilfield Casing Spools Industry segmented?
The oilfield casing spools industry research report provides comprehensive data (region-wise segment analysis), with forecasts and estimates in "USD million" for the period 2025-2029, as well as historical data from 2019-2023 for the following segments.
- Type
- Stainless steel
- Low alloy steel
- Application
- Onshore
- Offshore
- Product
- 8 to 12 inch
- 12.1 to 16 inch
- Above 16 inch
- Geography
- North America
- US
- Canada
- APAC
- Australia
- China
- India
- Europe
- Norway
- Russia
- Middle East and Africa
- UAE
- South America
- Brazil
- North America
By Type Insights
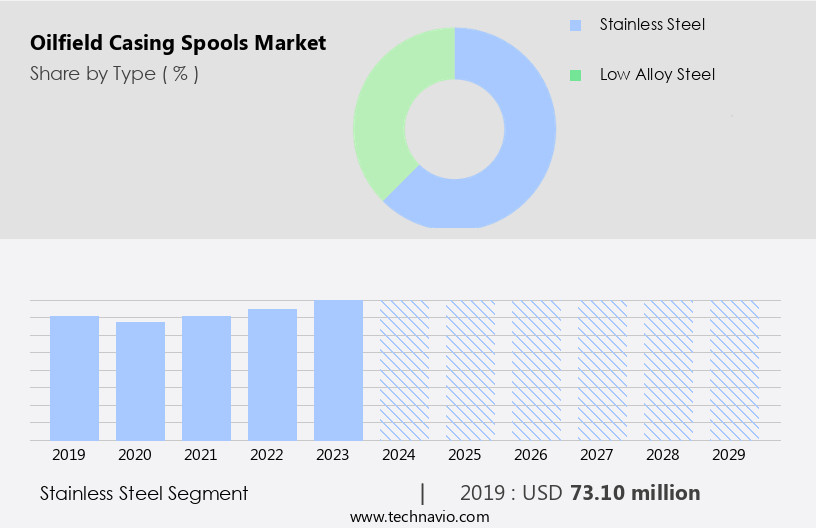
The stainless steel segment is estimated to witness significant growth during the forecast period.
The market primarily utilizes stainless steel as the preferred material due to its superior corrosion resistance. This attribute is crucial in oilfield applications, where harsh and corrosive environments are common. The longevity of stainless steel casing spools reduces replacement and maintenance costs, making them a cost-effective solution. Moreover, ecologically responsible practices are increasingly d in the oil and gas sector, with organizations such as the US Department of Energy advocating for sustainable operations. Stainless steel casing spools contribute to these objectives by minimizing the risk of leaks and spills, thereby decreasing environmental impact. Manufacturing facilities worldwide produce casing spools, catering to exploration activities in various regions, including onshore and offshore segments.
Key players in this market include major oil and gas companies and equipment providers. However, challenges such as a lack of workforce and the impact of the novel coronavirus on production units pose significant threats. Digital doors and security concerns for customers' safety are also essential considerations in the global market. The application range of casing spools includes wellhead systems, drilling rigs, pressure control, casing hangers, subsea equipment, pipe fittings, and steel casings for well completion. Protective features, such as waterproof pads, marine sector applications, and blowout preventers, further expand their usage.
Get a glance at the market report of share of various segments Request Free Sample
The Stainless steel segment was valued at USD 73.10 million in 2019 and showed a gradual increase during the forecast period.
Regional Analysis
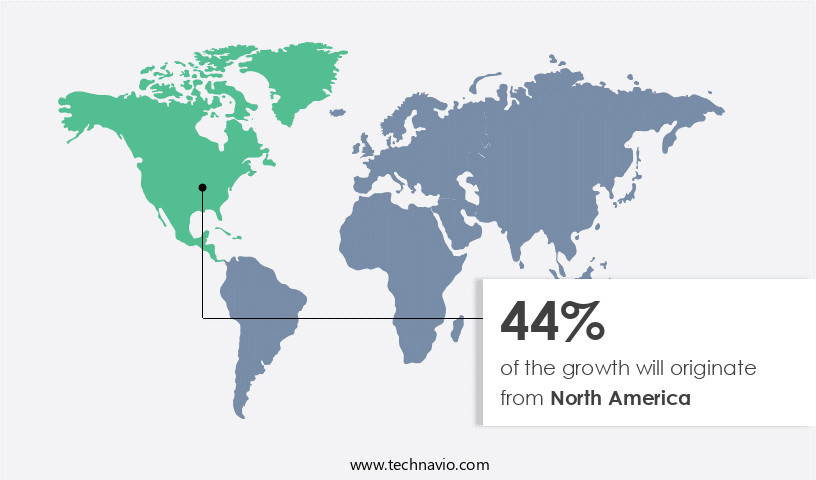
North America is estimated to contribute 44% to the growth of the global market during the forecast period.Technavio’s analysts have elaborately explained the regional trends and drivers that shape the market during the forecast period.
For more insights on the market size of various regions, Request Free Sample
The North American the market is primarily driven by the significant increase in exploration and production (E&P) activities in unconventional sources such as shale and oil sands. In 2024, the leading contributors to this regional market were the US, Canada, and Mexico, which are among the largest oil and gas producers globally. The in E&P activities in these countries, particularly in unconventional sources, is expected to increase the overall production of crude oil and natural gas. This increase will stimulate the need for various oilfield equipment, including casing spools, to support drilling and completion activities.
Casing spools are essential components of wellhead systems, used to connect and seal the casing and tubing strings during drilling processes. They come in various designs, including straight bore, landing shoulder, threaded outlets, and studded outlets, to cater to different application ranges. Manufacturing facilities in North America produce casing spools that meet stringent safety concerns, such as structural integrity, pressure control, and fluid returns. Key features of casing spools include waterproof pads, protective plastic covers, and various protective features for marine and onshore environments. Major companies in the region, including those specializing in oilfield equipment, drilling rigs, pressure control, casing hangers, subsea equipment, pipe fittings, and steel casings, are expected to benefit from the increasing demand for casing spools.
However, challenges such as a lack of workforce and the impact of the novel coronavirus on production units may hinder market growth. Security concerns, including digital doors and security imperatives, are also essential considerations for customers in the global market.
Market Dynamics
Our researchers analyzed the data with 2024 as the base year, along with the key drivers, trends, and challenges. A holistic analysis of drivers will help companies refine their marketing strategies to gain a competitive advantage.
What are the key market drivers leading to the rise in the adoption of Oilfield Casing Spools Industry?
Increasing investments in upstream oil and gas operations is the key driver of the market.
- The market has experienced notable growth due to increased investment in upstream oil and gas operations. Governments and corporations worldwide recognize the importance of energy resource security, leading to significant investments in this sector. For instance, the US government's commitment to increasing domestic energy production, as demonstrated by the Energy Independence and Economic Growth executive order, has resulted in substantial investment in upstream activities.
- Similarly, Saudi Arabia's Vision 2030 strategy aims to diversify its economy by investing heavily in the oil and gas industry. In 2024, upstream oil and gas dealmaking in the US reached USD105 billion. This trend is expected to continue as energy demand increases and governments and corporations seek to secure their energy supplies.
What are the market trends shaping the Oilfield Casing Spools Industry?
Development of intelligent well completion technologies is the upcoming market trend.
- Intelligent completion in oil and gas wells refers to the deployment of advanced technologies, including permanent downhole sensors and surface-controlled downhole flow control valves. These innovations enable remote monitoring and real-time management of production, ensuring well integrity and optimizing oil and gas flow from the reservoir. By installing remotely controlled equipment in well completion processes, operators can collect, transmit, and analyze wellbore data.
- This data supports well integrity and allows for the control of oil and gas flow from a remote location, eliminating the need for well intervention. Intelligent completion is a significant development in the oil and gas industry, enhancing operational efficiency and productivity.
What challenges does the Oilfield Casing Spools Industry face during its growth?
Fluctuation in oil and gas prices is a key challenge affecting the industry growth.
- The market experiences volatility due to oil and gas price fluctuations. This instability impacts market growth and profitability, making long-term planning challenging for operators. Oil and gas prices are influenced by geopolitical tensions, production levels, and global demand shifts, leading to unpredictable investment changes in the industry. These price swings pose a significant challenge for companies seeking stable forecasts to manage production and supply chains effectively.
- The market's instability necessitates adaptability and agility from market participants.
Exclusive Customer Landscape
The oilfield casing spools market forecasting report includes the adoption lifecycle of the market, covering from the innovator’s stage to the laggard’s stage. It focuses on adoption rates in different regions based on penetration. Furthermore, the oilfield casing spools market report also includes key purchase criteria and drivers of price sensitivity to help companies evaluate and develop their market growth analysis strategies.

Customer Landscape
Key Companies & Market Insights
Companies are implementing various strategies, such as strategic alliances, oilfield casing spools market forecast, partnerships, mergers and acquisitions, geographical expansion, and product/service launches, to enhance their presence in the industry.
Baker Hughes Co. - The company specializes in providing oilfield casing spools, engineered for secure deployment of downhole instrumentation and monitoring systems. Our solutions prioritize risk mitigation and reliability, ensuring optimal performance for energy industry applications.
The industry research and growth report includes detailed analyses of the competitive landscape of the market and information about key companies, including:
- Baker Hughes Co.
- Delta Corp.
- Jiangsu HongFei Petroleum Machinery Manufacturing Co. Ltd.
- Parveen Industries Pvt. Ltd.
- Sakward Oilfield Manufacturing Co. Ltd.
- Schlumberger Ltd.
- Sentry Wellhead Systems LLC
- Shaanxi FYPE Rigid Machinery Co. Ltd.
- UZTEL SA
- Worldwide Oilfield Machine Inc.
- Yantai Jereh Oilfield Services Group Co. Ltd.
Qualitative and quantitative analysis of companies has been conducted to help clients understand the wider business environment as well as the strengths and weaknesses of key industry players. Data is qualitatively analyzed to categorize companies as pure play, category-focused, industry-focused, and diversified; it is quantitatively analyzed to categorize companies as dominant, leading, strong, tentative, and weak.
Research Analyst Overview
The market encompasses a vital segment of the oil and gas industry, playing a crucial role in ensuring the structural integrity and pressure control during drilling processes. Casing spools, a key component of wellhead systems, are essential for securing the casing in place and providing a connection point for various components such as casing heads, tubing heads, and blowout preventers. The drilling process necessitates the use of casing spools to maintain safety concerns during the exploration activities. These spools are designed to withstand the extreme conditions encountered in drilling operations, including high temperatures, pressures, and corrosive elements. They are manufactured in facilities worldwide, catering to the diverse needs of the global market users.
Casing spools come in various designs, including straight bore, landing shoulder, threaded outlets, and studded outlets, among others. Their application range extends to both onshore and offshore segments, with the former typically involving terrestrial environments and the latter, marine environments. In marine environments, casing spools are engineered to withstand the unique challenges posed by water and other fluid returns. The manufacturing of casing spools involves stringent quality control measures to ensure the mechanical properties and energy consumption meet the required standards. The use of low alloy steels and eco-conscious practices in the production units is a growing trend in the industry.
The market faces several challenges, including the lack of workforce due to the novel coronavirus pandemic and the need for digital doors and security concerns to maintain customers' safety. The market's major players invest in research and development to innovate and offer protective features such as waterproof pads, plastic covers, and pressure control systems. The market for oilfield casing spools is diverse, with various regions contributing significantly to its growth. The application of casing spools extends beyond drilling rigs, with casing hangers, pipe fittings, and subsea equipment being essential components of the wellhead systems. The industry's senior analysts predict a promising future for the market, with the increasing demand for crude oil extraction and the need for sustainable practices driving growth.
In , the market plays a pivotal role in the oil and gas industry, ensuring the structural integrity and pressure control during drilling processes. The market's growth is driven by the increasing demand for crude oil extraction and the need for sustainable practices, with various regions contributing significantly to its growth. Despite the challenges, the market's major players continue to innovate and invest in research and development to meet the evolving needs of the industry.
|
Market Scope |
|
|
Report Coverage |
Details |
|
Page number |
202 |
|
Base year |
2024 |
|
Historic period |
2019-2023 |
|
Forecast period |
2025-2029 |
|
Growth momentum & CAGR |
Accelerate at a CAGR of 6.8% |
|
Market growth 2025-2029 |
USD 49.8 million |
|
Market structure |
Concentrated |
|
YoY growth 2024-2025(%) |
6.5 |
|
Key countries |
US, China, Russia, Canada, Brazil, Saudi Arabia, Norway, UAE, Australia, and India |
|
Competitive landscape |
Leading Companies, Market Positioning of Companies, Competitive Strategies, and Industry Risks |
What are the Key Data Covered in this Oilfield Casing Spools Market Research and Growth Report?
- CAGR of the Oilfield Casing Spools industry during the forecast period
- Detailed information on factors that will drive the growth and forecasting between 2025 and 2029
- Precise estimation of the size of the market and its contribution of the industry in focus to the parent market
- Accurate predictions about upcoming growth and trends and changes in consumer behaviour
- Growth of the market across North America, APAC, Europe, Middle East and Africa, and South America
- Thorough analysis of the market’s competitive landscape and detailed information about companies
- Comprehensive analysis of factors that will challenge the oilfield casing spools market growth of industry companies
We can help! Our analysts can customize this oilfield casing spools market research report to meet your requirements.