Oilfield Chemicals Market Analysis North America, Europe, APAC, Middle East and Africa, South America - US, Canada, China, India, Russia - Size and Forecast 2024-2028

Oilfield Chemicals Market Analysis North America, Europe, APAC, Middle East and Africa, South America - US, Canada, China, India, Russia - Size and Forecast 2024-2028

Published: Mar 2024 171 Pages SKU: IRTNTR77735

Market Overview at a Glance

$6.75 B
Market Opportunity
4.37%
CAGR
3.56
YoY growth 2023-2024(%)

Oilfield Chemicals Market Size 2024-2028 

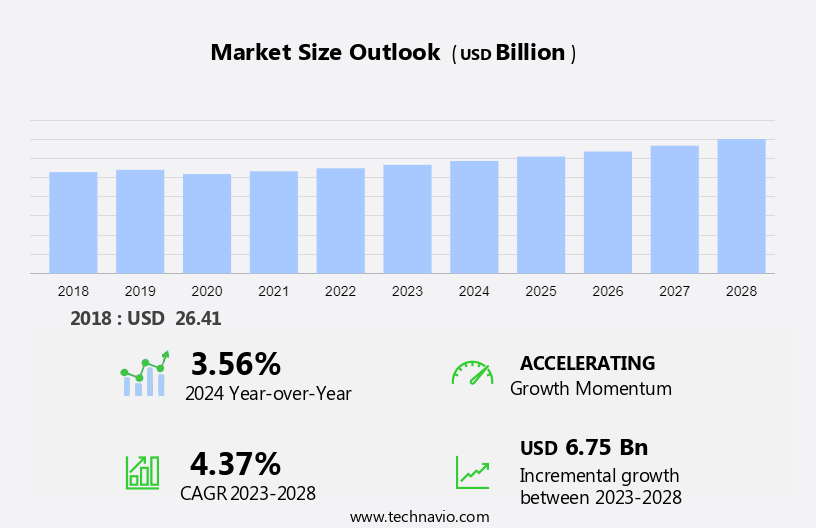
The oilfield chemicals market size is forecast to increase by USD 6.75 billion at a CAGR of 4.37% between 2023 and 2028.

  • The market's growth rate hinges on various factors, such as the increased production of crude oil, advancements in oilfield technology, and the expansion of shale gas exploration and production. These elements collectively contribute to the market's trajectory, driving its upward momentum. With the continuous improvement and adoption of innovative technologies in the oilfield sector, coupled with the heightened focus on shale gas extraction, the market is poised for significant expansion in the foreseeable future. It also includes an in-depth analysis of drivers, trends, and challenges. Our report examines historical data from 2018-2022, besides analyzing the current market scenario.

What will the Oilfield Chemicals Market Size During the Forecast Period?

Oilfield Chemicals Market Size

 Request Free Sample

How is this market segmented and which is the largest segment?

The market research report provides comprehensive data (region-wise segment analysis), with forecasts and estimates in "USD billion" for the period 2024-2028, as well as historical data from 2018-2022 for the following segments.

  • Application
    • Production
    • Well stimulation
    • Drilling fluids
    • Enhanced oil recovery
    • Others
  • Type
    • Onshore
    • Offshore
  • Geography
    • North America
      • Canada
      • US
    • Europe
    • APAC
      • China
      • India
    • Middle East and Africa
    • South America

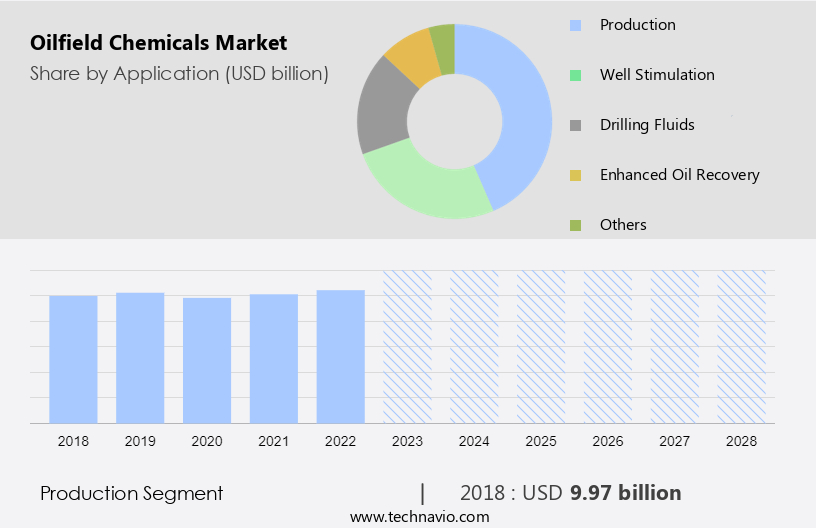
By Application Insights

  • The production segment is estimated to witness significant growth during the forecast period.

In the realm of oil exploration and production activities, oilfield chemicals play a pivotal role in ensuring efficiency and safety during drilling and well-stimulation processes. The shale gas revolution has significantly increased the demand for oilfield chemicals, particularly in crude oil production from onshore fields in developing economies. These chemicals are instrumental in optimizing operations, adhering to environmental standards, and enhancing reservoir recovery. Oilfield chemicals are applied extensively in various production processes, including drilling fluids for deep drilling activities, fracturing liquids for well stimulation, and inhibitors for preventing corrosion and the formation of emulsions on metal surfaces. Product analysis reveals that the Rheology modifiers segment dominates the market, with synthetic-based drilling fluids and micro-fibrillated cellulose (MFC) and xanthan gum being commonly used.

The inhibitors segment is also gaining traction due to its ability to mitigate impurities derived from crude oil production. Water-soluble inhibitors, such as amides and long-chain amines, are popular choices for preventing corrosion and scaling in onshore exploration activities. As the industry dynamics evolve, oilfield chemicals continue to play a crucial role in enhancing oilfield exploration endeavors while addressing the challenges of drilling in diverse geological conditions. Moreover, the shift towards renewable energy sources like solar power and wind power has led to a decline in demand for oilfield chemicals in certain applications. However, the ongoing demand for oil and gas, coupled with the need for optimization and safety in production processes, ensures that the market remains a significant player in the energy sector.

Oilfield Chemicals Market Size

Get a glance at the market report of share of various segments Request Free Sample

The Production segment was valued at USD 9.97 billion in 2018 and showed a gradual increase during the forecast period.
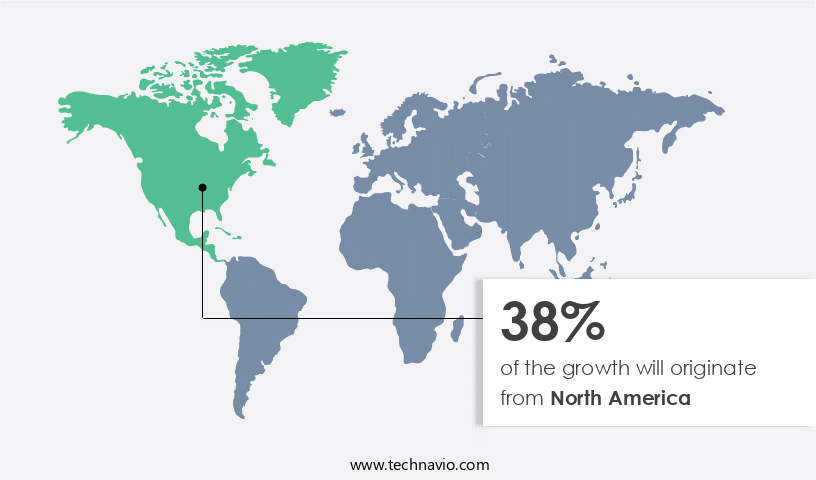
Regional Analysis

  • North America is estimated to contribute 38% to the growth of the global market during the forecast period.

Technavio's analysts have elaborately explained the regional trends and drivers that shape the market during the forecast period.

Oilfield Chemicals Market Share by Geography

For more insights on the market share of various regions Request Free Sample

In the Oil & gas industry, the application analysis of oilfield chemicals in North America experienced substantial growth in 2023, driven by the recovery of West Texas Intermediate and Brent crude prices and the significant expansion of shale oil and gas production. The level of exploration and production activities in the US and Canada significantly impacted the demand for oilfield chemicals, including solid-free fluids, fracture stimulation agents, water shut-off compounds, gravel packing additives, and acid stimulation catalysts. These chemicals are essential for post-oil extraction processes, ensuring efficient drilling and production. Advancements in technology, such as automation and IoT, have encouraged oil rig operators to adopt innovative drilling solutions, including the use of O2 for onshore and offshore projects.

The susceptibility of oil and gas infrastructure to corrosion necessitates the employment of corrosion inhibitors, such as O2-rendering agents, to maintain operational efficiency. Moreover, the market in North America caters to various applications, including drilling fluids, cementing, stimulation, and petrochemical production. The market encompasses demulsifiers, water clarifiers, biocides, scale inhibitors, paraffin inhibitors, hydrogen sulfide scavengers, and gas well foamers. The adoption of renewable energy, electric vehicles, and sustainable practices in the industry is expected to influence the future demand for oilfield chemicals. Nouryon, a leading chemical company, has been a significant player in the market, providing solutions for shale gas production and petrochemicals manufacturing.

The market's expansion is further fueled by the increasing demand for plastics and other industrial applications. In summary, the market in North America experienced robust growth in 2023, driven by the recovery of crude oil prices and the expansion of shale oil and gas production. The market caters to various applications, including drilling, cementing, stimulation, and petrochemicals production, and employs a range of chemicals, including solid-free fluids, fracture stimulation agents, water shut-off compounds, gravel packing additives, and acid stimulation catalysts. The market's future growth is expected to be influenced by technological advancements, the adoption of renewable energy, and the increasing demand for plastics and other industrial applications.

Market Dynamics

Our researchers analyzed the data with 2023 as the base year, along with the key drivers, trends, and challenges. A holistic analysis of drivers will help companies refine their marketing strategies to gain a competitive advantage.

What are the key market drivers leading to the rise in adoption of Oilfield Chemicals Market ?

Increased production of crude oil is the key driver of the market.

  • In the realm of oil exploration and production activities, the shale gas revolution has significantly boosted the necessity for oilfield chemicals. With the rise in crude oil production, the need for well-stimulation techniques, such as hydraulic fracturing (fracking) and acidizing, has become increasingly important. Oilfield chemicals, including fracturing fluids and acidizing agents, play a pivotal role in these processes by enhancing reservoir permeability and stimulating oil flow from wells. As onshore exploration activities expand in developing economies and onshore fields, maintaining flow assurance becomes crucial to prevent operational disruptions. Oilfield chemicals are applied to mitigate issues such as wax deposition, asphaltene flocculation, hydrate formation, and scale accumulation in pipelines and production facilities.
  • These additives help maintain the desired viscosity and prevent the formation of solids, ensuring the smooth progression of drilling activities. Fracturing liquids, another essential category of oilfield chemicals, are used extensively in well stimulation processes. These liquids, which include a variety of additives and surfactants, help enhance the efficiency of the fracturing process by improving the contact between the fracturing fluid and the rock formation. The industry dynamics of oilfield chemicals are influenced by various factors, including the demand for oil and gas, technological advancements, and regulatory requirements. The market for oilfield chemicals is expected to grow as oil and gas companies continue to invest in onshore exploration activities and seek to maximize hydrocarbon recovery while ensuring operational efficiency and safety. The decline in demand for oilfield chemicals in solar power and wind power industries may, however, pose a challenge to market growth.

What are the market trends shaping the Oilfield Chemicals Market?

Rising oilfield activities due to deepwater drilling operations is the upcoming trend in the market.

  • In the realm of oil exploration and production activities, the significance of oilfield chemicals has grown exponentially due to the shale gas revolution and the increase in crude oil production. These essential chemicals play a pivotal role in enhancing efficiency, ensuring safety, and managing downhole conditions during drilling and well stimulation. In deepwater environments, where corrosive conditions such as high salinity and the presence of hydrogen sulfide (H2S) are prevalent, oilfield chemicals act as crucial protectants for equipment, pipelines, and infrastructure. The market encompasses a wide array of products used in various stages of oil exploration and production. These include drilling fluids for optimizing drilling operations, deep drilling activities for managing impurities, and the formation of emulsions.
  • The inhibitors segment, which comprises corrosion inhibitors and scale inhibitors, is a key component of this market. These inhibitors prevent the formation of emulsions and protect metal surfaces from corrosion. Moreover, oilfield chemicals are indispensable in onshore exploration activities, particularly in developing economies and onshore fields, where investments in advanced technologies are on the rise. In the realm of well stimulation and reservoir recovery, oilfield chemicals such as rheology modifiers, synthetic-based drilling fluids, and fracturing liquids play a vital role. Micro-fibrillated cellulose (MFC) and xanthan gum are popular rheology modifiers that help manage downhole conditions and improve reservoir access.

What challenges does the Oilfield Chemicals Market face during its growth?

Increasing corrosion of materials in oilfields is a key challenge affecting the market growth.

  • In the realm of oil exploration and production activities, the significance of oilfield chemicals has grown substantially. The shale gas revolution and the increase in crude oil production have necessitated greater efficiency, safety, and optimization in drilling and well-stimulation processes. Oilfield chemicals play a pivotal role in reservoir recovery, formation of emulsions, and addressing impurities in derived oil products. The onshore exploration activities in developing economies and onshore fields have led to increased investments in oilfield chemicals. Solar power and wind power, as alternative energy sources, have caused a decline in demand for traditional oil-based energy, making it crucial for oilfield companies to maintain their operations and meet production targets.
  • Oilfield chemicals are essential in various aspects of oilfield operations, including drilling fluids, deep drilling activities, and inhibitors. Synthetic-based drilling fluids, such as those containing Rheology modifiers like micro-fibrillated cellulose (MFC), xanthan gum, and fracturing liquids, are used to enhance drilling efficiency and ensure safety. Inhibitors, including water-soluble inhibitors, amides, and long-chain amines, are employed to protect metal surfaces from corrosion, a common issue in oilfield equipment. Corrosion, which can lead to equipment failures and unplanned downtime, is a significant challenge in the industry dynamics. The market encompasses a wide range of products, including drilling fluids, deep drilling chemicals, and inhibitors.

Exclusive Customer Landscape

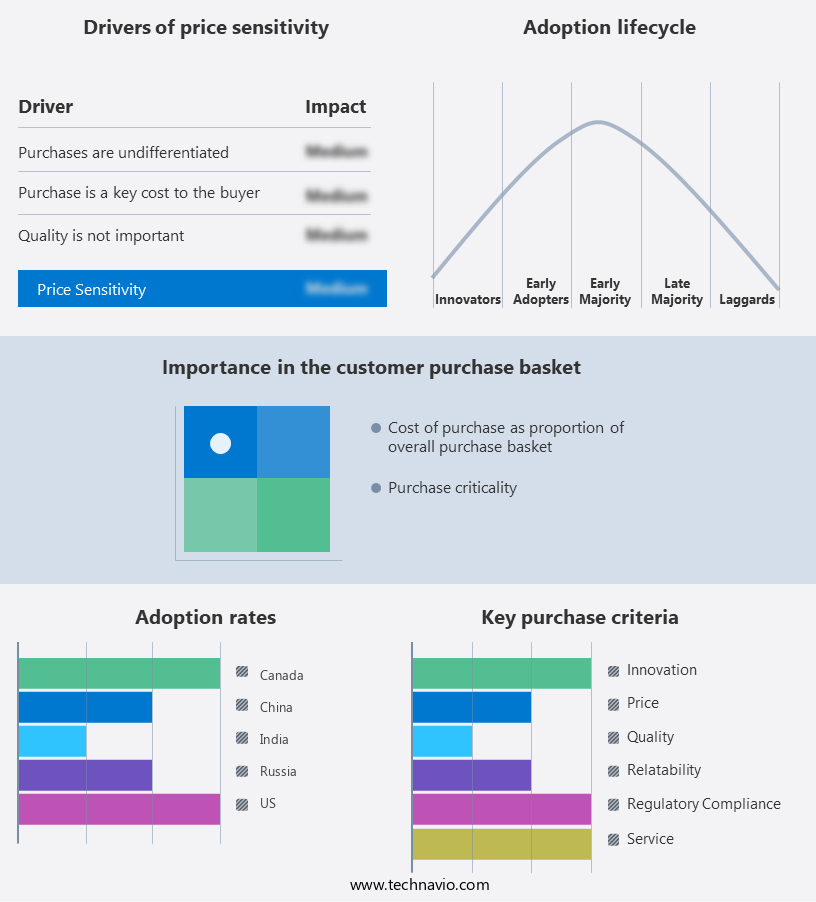
The market forecasting report includes the adoption lifecycle of the market, covering from the innovator's stage to the laggard's stage. It focuses on adoption rates in different regions based on penetration. Furthermore, the market report also includes key purchase criteria and drivers of price sensitivity to help companies evaluate and develop their market growth analysis strategies.

Oilfield Chemicals Market Share by Geography

 Customer Landscape

Key Companies & Market Insights

Companies are implementing various strategies, such as strategic alliances, market forecast, partnerships, mergers and acquisitions, geographical expansion, and product/service launches, to enhance their presence in the market.

The market research and growth report includes detailed analyses of the competitive landscape of the market and information about key companies, including:

  • 3M Co.
  • Ashland Inc.
  • Baker Hughes Co.
  • BASF SE
  • Chevron Corp.
  • Clariant International Ltd.
  • Croda International Plc
  • Evonik Industries AG
  • FMC Corp.
  • Halliburton Co.
  • Kao Corp.
  • Qixia Aotong Chemical Co. Ltd.
  • Sasol Ltd.
  • Schlumberger Ltd.
  • Solvay SA
  • The Lubrizol Corp.
  • The SNF Group
  • Yantai Humon Group Co. Ltd.
  • Artek Surfin Chemicals Ltd.
  • Huntsman International LLC

Qualitative and quantitative analysis of companies has been conducted to help clients understand the wider business environment as well as the strengths and weaknesses of key market players. Data is qualitatively analyzed to categorize companies as pure play, category-focused, industry-focused, and diversified; it is quantitatively analyzed to categorize companies as dominant, leading, strong, tentative, and weak.

Research Analyst Overview

The market plays a crucial role in the oil and gas industry. These chemicals are essential for various applications such as drilling, completion, production, and enhancement of oil and gas reserves. The market for Oilfield Chemicals is driven by several factors including the increasing demand for oil and gas, the need for enhanced oil recovery, and the growing focus on environmental sustainability. The market encompasses a wide range of products including biocides, corrosion inhibitors, demulsifiers, scale inhibitors, and surfactants. These chemicals help in enhancing the productivity of oil and gas wells, reducing downtime, and minimizing operational costs. The market for Oilfield Chemicals is expected to grow significantly due to the increasing exploration and production activities in various regions including North America, Europe, Asia Pacific, and the Middle East and Africa.

Moreover, the market is also being driven by the ongoing technological advancements in the oil and gas industry, which are leading to the development of new and more efficient chemicals. The demand for Oilfield Chemicals is also being driven by the stringent regulations regarding the environmental sustainability of oil and gas operations. These regulations are leading to the adoption of eco-friendly chemicals, which are expected to be a major trend in the market in the coming years. In conclusion, the market is a dynamic and growing market, driven by various factors including the increasing demand for oil and gas, the need for enhanced oil recovery, and the growing focus on environmental sustainability. The market is expected to continue growing in the coming years, driven by the ongoing technological advancements and the adoption of eco-friendly chemicals.

The Oilfield Chemicals Market plays a pivotal role in the upstream oil industry, encompassing a diverse range of specialized chemicals used in various applications, including oilfield waste management, drilling fluid optimization, oilfield production chemicals, and gas exploration chemicals. These chemicals facilitate drilling and production processes, ensuring wellbore stability, enhancing reservoir stimulation, and controlling corrosion. Drilling fluid optimization involves the use of oilfield chemicals for managing yield stress, filtration, and rheology to optimize drilling performance and prevent formation damage. Workover chemicals and fracking chemicals are essential for well workovers and hydraulic fracturing, respectively. Infrastructure corrosion control is another critical application, ensuring the longevity of oil and gas infrastructure.

Gas exploration chemicals, such as gas injection chemicals, are used to enhance reservoir engineering and improve hydrocarbon exploration. Downhole corrosion prevention and environmental impact assessment are essential components of oilfield safety, minimizing the impact on the environment while ensuring sustainable and low-carbon oil production. Oilfield logistics and automation streamline operations, reducing costs and improving efficiency. Carbon capture, storage, and sustainable oil are the future of the oilfield chemicals market, as the industry transitions towards more environmentally-friendly practices. The market's continued growth is driven by the increasing demand for oil and gas, advancements in reservoir engineering, and the need for improved oilfield safety and environmental sustainability.

The Oilfield Chemicals Market is a critical sector that supports the global energy industry, encompassing drilling mud rheology modifiers, filtration agents for drilling fluid, formation damage control agents, hydraulic fracturing chemicals, and completion fluids. These chemicals ensure efficient drilling, wellbore integrity, and enhanced oil recovery. However, the market faces challenges, including oilfield environmental impact, chemical safety, and the transition to renewable energy sources. Innovations in oilfield automation, downhole technology, and digital oilfield solutions are addressing these challenges. The energy transition, driven by energy efficiency, energy innovation, and clean energy technologies, is transforming the market. The formulation of green energy alternatives, such as geothermal energy, hydropower, and carbon sequestration, is a growing trend. The circular economy and chemical safety are essential considerations in the oilfield chemicals market. Energy security, energy independence, and fossil fuel alternatives are also shaping the market.

As the industry evolves, energy storage and smart grid technologies are becoming increasingly important. The integration of renewable energy sources and the adoption of clean energy technologies are expected to significantly impact the oilfield chemicals market in the future. The focus on energy efficiency and reducing the carbon footprint is driving the development of new, eco-friendly oilfield chemicals.

Oilfield Chemicals Market Scope

Report Coverage

Details

Page number

171

Base year

2023

Historic period

2018 - 2022

Forecast period

2024-2028

Growth momentum & CAGR

Accelerate at a CAGR of 4.37%

Market growth 2024-2028

USD 6.75 billion

Market structure

USD Fragmented

YoY growth 2023-2024(%)

3.56

Key countries

US, Canada, China, India, and Russia

Competitive landscape

Leading Companies, Market Positioning of Companies, Competitive Strategies, and Industry Risks

Market dynamics

Parent market analysis, Market growth inducers and obstacles, Fast-growing and slow-growing segment analysis, Market growth and Forecasting, COVID 19 impact and recovery analysis and future consumer dynamics, Market condition analysis for forecast period

Customization purview

If our report has not included the data that you are looking for, you can reach out to our analysts and get segments customized.

Request Free Sample

What are the Key Data Covered in this Market Research and Growth Report?

  • CAGR of the market during the forecast period
  • Detailed information on factors that will drive the market growth and forecasting between 2024 and 2028
  • Precise estimation of the size of the market  and its contribution of the market in focus to the parent market
  • Accurate predictions about upcoming market growth and trends and changes in consumer behaviour
  • Growth of the market across North America, Europe, APAC, Middle East and Africa, and South America
  • Thorough analysis of the market's competitive landscape and detailed information about companies
  • Comprehensive analysis of factors that will challenge the growth of market companies

We can help! Our analysts can customize this market research report to meet your requirements. Get in touch

1 Executive Summary

  • 1.1 Market overview
    • Exhibit 01: Executive Summary – Chart on Market Overview
    • Exhibit 02: Executive Summary – Data Table on Market Overview
    • Exhibit 03: Executive Summary – Chart on Global Market Characteristics
    • Exhibit 04: Executive Summary – Chart on Market by Geography
    • Exhibit 05: Executive Summary – Chart on Market Segmentation by Application
    • Exhibit 06: Executive Summary – Chart on Market Segmentation by Type
    • Exhibit 07: Executive Summary – Chart on Incremental Growth
    • Exhibit 08: Executive Summary – Data Table on Incremental Growth
    • Exhibit 09: Executive Summary – Chart on Vendor Market Positioning

2 Market Landscape

  • 2.1 Market ecosystem
    • Exhibit 10: Parent market
    • Exhibit 11: Market Characteristics

3 Market Sizing

  • 3.1 Market definition
    • Exhibit 12: Offerings of vendors included in the market definition
  • 3.2 Market segment analysis
    • Exhibit 13: Market segments
  • 3.3 Market size 2023
    • 3.4 Market outlook: Forecast for 2023-2028
      • Exhibit 14: Chart on Global - Market size and forecast 2023-2028 ($ billion)
      • Exhibit 15: Data Table on Global - Market size and forecast 2023-2028 ($ billion)
      • Exhibit 16: Chart on Global Market: Year-over-year growth 2023-2028 (%)
      • Exhibit 17: Data Table on Global Market: Year-over-year growth 2023-2028 (%)

    4 Historic Market Size

    • 4.1 Global oilfield chemicals market 2018 - 2022
      • Exhibit 18: Historic Market Size – Data Table on global oilfield chemicals market 2018 - 2022 ($ billion)
    • 4.2 Application Segment Analysis 2018 - 2022
      • Exhibit 19: Historic Market Size – Application Segment 2018 - 2022 ($ billion)
    • 4.3 Type Segment Analysis 2018 - 2022
      • Exhibit 20: Historic Market Size – Type Segment 2018 - 2022 ($ billion)
    • 4.4 Geography Segment Analysis 2018 - 2022
      • Exhibit 21: Historic Market Size – Geography Segment 2018 - 2022 ($ billion)
    • 4.5 Country Segment Analysis 2018 - 2022
      • Exhibit 22: Historic Market Size – Country Segment 2018 - 2022 ($ billion)

    5 Five Forces Analysis

    • 5.1 Five forces summary
      • Exhibit 23: Five forces analysis - Comparison between 2023 and 2028
    • 5.2 Bargaining power of buyers
      • Exhibit 24: Chart on Bargaining power of buyers – Impact of key factors 2023 and 2028
    • 5.3 Bargaining power of suppliers
      • Exhibit 25: Bargaining power of suppliers – Impact of key factors in 2023 and 2028
    • 5.4 Threat of new entrants
      • Exhibit 26: Threat of new entrants – Impact of key factors in 2023 and 2028
    • 5.5 Threat of substitutes
      • Exhibit 27: Threat of substitutes – Impact of key factors in 2023 and 2028
    • 5.6 Threat of rivalry
      • Exhibit 28: Threat of rivalry – Impact of key factors in 2023 and 2028
    • 5.7 Market condition
      • Exhibit 29: Chart on Market condition - Five forces 2023 and 2028

    6 Market Segmentation by Application

    • 6.1 Market segments
      • Exhibit 30: Chart on Application - Market share 2023-2028 (%)
      • Exhibit 31: Data Table on Application - Market share 2023-2028 (%)
    • 6.2 Comparison by Application
      • Exhibit 32: Chart on Comparison by Application
      • Exhibit 33: Data Table on Comparison by Application
    • 6.3 Production - Market size and forecast 2023-2028
      • Exhibit 34: Chart on Production - Market size and forecast 2023-2028 ($ billion)
      • Exhibit 35: Data Table on Production - Market size and forecast 2023-2028 ($ billion)
      • Exhibit 36: Chart on Production - Year-over-year growth 2023-2028 (%)
      • Exhibit 37: Data Table on Production - Year-over-year growth 2023-2028 (%)
    • 6.4 Well stimulation - Market size and forecast 2023-2028
      • Exhibit 38: Chart on Well stimulation - Market size and forecast 2023-2028 ($ billion)
      • Exhibit 39: Data Table on Well stimulation - Market size and forecast 2023-2028 ($ billion)
      • Exhibit 40: Chart on Well stimulation - Year-over-year growth 2023-2028 (%)
      • Exhibit 41: Data Table on Well stimulation - Year-over-year growth 2023-2028 (%)
    • 6.5 Drilling fluids - Market size and forecast 2023-2028
      • Exhibit 42: Chart on Drilling fluids - Market size and forecast 2023-2028 ($ billion)
      • Exhibit 43: Data Table on Drilling fluids - Market size and forecast 2023-2028 ($ billion)
      • Exhibit 44: Chart on Drilling fluids - Year-over-year growth 2023-2028 (%)
      • Exhibit 45: Data Table on Drilling fluids - Year-over-year growth 2023-2028 (%)
    • 6.6 Enhanced oil recovery - Market size and forecast 2023-2028
      • Exhibit 46: Chart on Enhanced oil recovery - Market size and forecast 2023-2028 ($ billion)
      • Exhibit 47: Data Table on Enhanced oil recovery - Market size and forecast 2023-2028 ($ billion)
      • Exhibit 48: Chart on Enhanced oil recovery - Year-over-year growth 2023-2028 (%)
      • Exhibit 49: Data Table on Enhanced oil recovery - Year-over-year growth 2023-2028 (%)
    • 6.7 Others - Market size and forecast 2023-2028
      • Exhibit 50: Chart on Others - Market size and forecast 2023-2028 ($ billion)
      • Exhibit 51: Data Table on Others - Market size and forecast 2023-2028 ($ billion)
      • Exhibit 52: Chart on Others - Year-over-year growth 2023-2028 (%)
      • Exhibit 53: Data Table on Others - Year-over-year growth 2023-2028 (%)
    • 6.8 Market opportunity by Application
      • Exhibit 54: Market opportunity by Application ($ billion)
      • Exhibit 55: Data Table on Market opportunity by Application ($ billion)

    7 Market Segmentation by Type

    • 7.1 Market segments
      • Exhibit 56: Chart on Type - Market share 2023-2028 (%)
      • Exhibit 57: Data Table on Type - Market share 2023-2028 (%)
    • 7.2 Comparison by Type
      • Exhibit 58: Chart on Comparison by Type
      • Exhibit 59: Data Table on Comparison by Type
    • 7.3 Onshore - Market size and forecast 2023-2028
      • Exhibit 60: Chart on Onshore - Market size and forecast 2023-2028 ($ billion)
      • Exhibit 61: Data Table on Onshore - Market size and forecast 2023-2028 ($ billion)
      • Exhibit 62: Chart on Onshore - Year-over-year growth 2023-2028 (%)
      • Exhibit 63: Data Table on Onshore - Year-over-year growth 2023-2028 (%)
    • 7.4 Offshore - Market size and forecast 2023-2028
      • Exhibit 64: Chart on Offshore - Market size and forecast 2023-2028 ($ billion)
      • Exhibit 65: Data Table on Offshore - Market size and forecast 2023-2028 ($ billion)
      • Exhibit 66: Chart on Offshore - Year-over-year growth 2023-2028 (%)
      • Exhibit 67: Data Table on Offshore - Year-over-year growth 2023-2028 (%)
    • 7.5 Market opportunity by Type
      • Exhibit 68: Market opportunity by Type ($ billion)
      • Exhibit 69: Data Table on Market opportunity by Type ($ billion)

    8 Customer Landscape

    • 8.1 Customer landscape overview
      • Exhibit 70: Analysis of price sensitivity, lifecycle, customer purchase basket, adoption rates, and purchase criteria

    9 Geographic Landscape

    • 9.1 Geographic segmentation
      • Exhibit 71: Chart on Market share by geography 2023-2028 (%)
      • Exhibit 72: Data Table on Market share by geography 2023-2028 (%)
    • 9.2 Geographic comparison
      • Exhibit 73: Chart on Geographic comparison
      • Exhibit 74: Data Table on Geographic comparison
    • 9.3 North America - Market size and forecast 2023-2028
      • Exhibit 75: Chart on North America - Market size and forecast 2023-2028 ($ billion)
      • Exhibit 76: Data Table on North America - Market size and forecast 2023-2028 ($ billion)
      • Exhibit 77: Chart on North America - Year-over-year growth 2023-2028 (%)
      • Exhibit 78: Data Table on North America - Year-over-year growth 2023-2028 (%)
    • 9.4 Europe - Market size and forecast 2023-2028
      • Exhibit 79: Chart on Europe - Market size and forecast 2023-2028 ($ billion)
      • Exhibit 80: Data Table on Europe - Market size and forecast 2023-2028 ($ billion)
      • Exhibit 81: Chart on Europe - Year-over-year growth 2023-2028 (%)
      • Exhibit 82: Data Table on Europe - Year-over-year growth 2023-2028 (%)
    • 9.5 APAC - Market size and forecast 2023-2028
      • Exhibit 83: Chart on APAC - Market size and forecast 2023-2028 ($ billion)
      • Exhibit 84: Data Table on APAC - Market size and forecast 2023-2028 ($ billion)
      • Exhibit 85: Chart on APAC - Year-over-year growth 2023-2028 (%)
      • Exhibit 86: Data Table on APAC - Year-over-year growth 2023-2028 (%)
    • 9.6 Middle East and Africa - Market size and forecast 2023-2028
      • Exhibit 87: Chart on Middle East and Africa - Market size and forecast 2023-2028 ($ billion)
      • Exhibit 88: Data Table on Middle East and Africa - Market size and forecast 2023-2028 ($ billion)
      • Exhibit 89: Chart on Middle East and Africa - Year-over-year growth 2023-2028 (%)
      • Exhibit 90: Data Table on Middle East and Africa - Year-over-year growth 2023-2028 (%)
    • 9.7 South America - Market size and forecast 2023-2028
      • Exhibit 91: Chart on South America - Market size and forecast 2023-2028 ($ billion)
      • Exhibit 92: Data Table on South America - Market size and forecast 2023-2028 ($ billion)
      • Exhibit 93: Chart on South America - Year-over-year growth 2023-2028 (%)
      • Exhibit 94: Data Table on South America - Year-over-year growth 2023-2028 (%)
    • 9.8 US - Market size and forecast 2023-2028
      • Exhibit 95: Chart on US - Market size and forecast 2023-2028 ($ billion)
      • Exhibit 96: Data Table on US - Market size and forecast 2023-2028 ($ billion)
      • Exhibit 97: Chart on US - Year-over-year growth 2023-2028 (%)
      • Exhibit 98: Data Table on US - Year-over-year growth 2023-2028 (%)
    • 9.9 China - Market size and forecast 2023-2028
      • Exhibit 99: Chart on China - Market size and forecast 2023-2028 ($ billion)
      • Exhibit 100: Data Table on China - Market size and forecast 2023-2028 ($ billion)
      • Exhibit 101: Chart on China - Year-over-year growth 2023-2028 (%)
      • Exhibit 102: Data Table on China - Year-over-year growth 2023-2028 (%)
    • 9.10 Russia - Market size and forecast 2023-2028
      • Exhibit 103: Chart on Russia - Market size and forecast 2023-2028 ($ billion)
      • Exhibit 104: Data Table on Russia - Market size and forecast 2023-2028 ($ billion)
      • Exhibit 105: Chart on Russia - Year-over-year growth 2023-2028 (%)
      • Exhibit 106: Data Table on Russia - Year-over-year growth 2023-2028 (%)
    • 9.11 Canada - Market size and forecast 2023-2028
      • Exhibit 107: Chart on Canada - Market size and forecast 2023-2028 ($ billion)
      • Exhibit 108: Data Table on Canada - Market size and forecast 2023-2028 ($ billion)
      • Exhibit 109: Chart on Canada - Year-over-year growth 2023-2028 (%)
      • Exhibit 110: Data Table on Canada - Year-over-year growth 2023-2028 (%)
    • 9.12 India - Market size and forecast 2023-2028
      • Exhibit 111: Chart on India - Market size and forecast 2023-2028 ($ billion)
      • Exhibit 112: Data Table on India - Market size and forecast 2023-2028 ($ billion)
      • Exhibit 113: Chart on India - Year-over-year growth 2023-2028 (%)
      • Exhibit 114: Data Table on India - Year-over-year growth 2023-2028 (%)
    • 9.13 Market opportunity by geography
      • Exhibit 115: Market opportunity by geography ($ billion)
      • Exhibit 116: Data Tables on Market opportunity by geography ($ billion)

    10 Drivers, Challenges, and Trends

    • 10.1 Market drivers
      • 10.2 Market challenges
        • 10.3 Impact of drivers and challenges
          • Exhibit 117: Impact of drivers and challenges in 2023 and 2028
        • 10.4 Market trends

          11 Vendor Landscape

          • 11.1 Overview
            • 11.2 Vendor landscape
              • Exhibit 118: Overview on Criticality of inputs and Factors of differentiation
            • 11.3 Landscape disruption
              • Exhibit 119: Overview on factors of disruption
            • 11.4 Industry risks
              • Exhibit 120: Impact of key risks on business

            12 Vendor Analysis

            • 12.1 Vendors covered
              • Exhibit 121: Vendors covered
            • 12.2 Market positioning of vendors
              • Exhibit 122: Matrix on vendor position and classification
            • 12.3 3M Co.
              • Exhibit 123: 3M Co. - Overview
              • Exhibit 124: 3M Co. - Business segments
              • Exhibit 125: 3M Co. - Key news
              • Exhibit 126: 3M Co. - Key offerings
              • Exhibit 127: 3M Co. - Segment focus
            • 12.4 Ashland Inc.
              • Exhibit 128: Ashland Inc. - Overview
              • Exhibit 129: Ashland Inc. - Business segments
              • Exhibit 130: Ashland Inc. - Key news
              • Exhibit 131: Ashland Inc. - Key offerings
              • Exhibit 132: Ashland Inc. - Segment focus
            • 12.5 Baker Hughes Co.
              • Exhibit 133: Baker Hughes Co. - Overview
              • Exhibit 134: Baker Hughes Co. - Business segments
              • Exhibit 135: Baker Hughes Co. - Key news
              • Exhibit 136: Baker Hughes Co. - Key offerings
              • Exhibit 137: Baker Hughes Co. - Segment focus
            • 12.6 BASF SE
              • Exhibit 138: BASF SE - Overview
              • Exhibit 139: BASF SE - Business segments
              • Exhibit 140: BASF SE - Key news
              • Exhibit 141: BASF SE - Key offerings
              • Exhibit 142: BASF SE - Segment focus
            • 12.7 Clariant International Ltd.
              • Exhibit 143: Clariant International Ltd. - Overview
              • Exhibit 144: Clariant International Ltd. - Business segments
              • Exhibit 145: Clariant International Ltd. - Key news
              • Exhibit 146: Clariant International Ltd. - Key offerings
              • Exhibit 147: Clariant International Ltd. - Segment focus
            • 12.8 Croda International Plc
              • Exhibit 148: Croda International Plc - Overview
              • Exhibit 149: Croda International Plc - Business segments
              • Exhibit 150: Croda International Plc - Key offerings
              • Exhibit 151: Croda International Plc - Segment focus
            • 12.9 Evonik Industries AG
              • Exhibit 152: Evonik Industries AG - Overview
              • Exhibit 153: Evonik Industries AG - Business segments
              • Exhibit 154: Evonik Industries AG - Key news
              • Exhibit 155: Evonik Industries AG - Key offerings
              • Exhibit 156: Evonik Industries AG - Segment focus
            • 12.10 FMC Corp.
              • Exhibit 157: FMC Corp. - Overview
              • Exhibit 158: FMC Corp. - Product / Service
              • Exhibit 159: FMC Corp. - Key offerings
            • 12.11 Halliburton Co.
              • Exhibit 160: Halliburton Co. - Overview
              • Exhibit 161: Halliburton Co. - Business segments
              • Exhibit 162: Halliburton Co. - Key news
              • Exhibit 163: Halliburton Co. - Key offerings
              • Exhibit 164: Halliburton Co. - Segment focus
            • 12.12 Huntsman International LLC
              • Exhibit 165: Huntsman International LLC - Overview
              • Exhibit 166: Huntsman International LLC - Business segments
              • Exhibit 167: Huntsman International LLC - Key news
              • Exhibit 168: Huntsman International LLC - Key offerings
              • Exhibit 169: Huntsman International LLC - Segment focus
            • 12.13 Kao Corp.
              • Exhibit 170: Kao Corp. - Overview
              • Exhibit 171: Kao Corp. - Business segments
              • Exhibit 172: Kao Corp. - Key offerings
              • Exhibit 173: Kao Corp. - Segment focus
            • 12.14 Sasol Ltd.
              • Exhibit 174: Sasol Ltd. - Overview
              • Exhibit 175: Sasol Ltd. - Business segments
              • Exhibit 176: Sasol Ltd. - Key news
              • Exhibit 177: Sasol Ltd. - Key offerings
              • Exhibit 178: Sasol Ltd. - Segment focus
            • 12.15 Schlumberger Ltd.
              • Exhibit 179: Schlumberger Ltd. - Overview
              • Exhibit 180: Schlumberger Ltd. - Business segments
              • Exhibit 181: Schlumberger Ltd. - Key news
              • Exhibit 182: Schlumberger Ltd. - Key offerings
              • Exhibit 183: Schlumberger Ltd. - Segment focus
            • 12.16 Solvay SA
              • Exhibit 184: Solvay SA - Overview
              • Exhibit 185: Solvay SA - Business segments
              • Exhibit 186: Solvay SA - Key news
              • Exhibit 187: Solvay SA - Key offerings
              • Exhibit 188: Solvay SA - Segment focus
            • 12.17 The Lubrizol Corp.
              • Exhibit 189: The Lubrizol Corp. - Overview
              • Exhibit 190: The Lubrizol Corp. - Product / Service
              • Exhibit 191: The Lubrizol Corp. - Key offerings

            13 Appendix

            • 13.1 Scope of the report
              • 13.2 Inclusions and exclusions checklist
                • Exhibit 192: Inclusions checklist
                • Exhibit 193: Exclusions checklist
              • 13.3 Currency conversion rates for US$
                • Exhibit 194: Currency conversion rates for US$
              • 13.4 Research methodology
                • Exhibit 195: Research methodology
                • Exhibit 196: Validation techniques employed for market sizing
                • Exhibit 197: Information sources
              • 13.5 List of abbreviations
                • Exhibit 198: List of abbreviations

              Research Methodology

              Technavio presents a detailed picture of the market by way of study, synthesis, and summation of data from multiple sources. The analysts have presented the various facets of the market with a particular focus on identifying the key industry influencers. The data thus presented is comprehensive, reliable, and the result of extensive research, both primary and secondary.

              INFORMATION SOURCES

              Primary sources

              • Manufacturers and suppliers
              • Channel partners
              • Industry experts
              • Strategic decision makers

              Secondary sources

              • Industry journals and periodicals
              • Government data
              • Financial reports of key industry players
              • Historical data
              • Press releases

              DATA ANALYSIS

              Data Synthesis

              • Collation of data
              • Estimation of key figures
              • Analysis of derived insights

              Data Validation

              • Triangulation with data models
              • Reference against proprietary databases
              • Corroboration with industry experts

              REPORT WRITING

              Qualitative

              • Market drivers
              • Market challenges
              • Market trends
              • Five forces analysis

              Quantitative

              • Market size and forecast
              • Market segmentation
              • Geographical insights
              • Competitive landscape

              Interested in this report?

              Get your sample now to see our research methodology and insights!

              Download Now

              Frequently Asked Questions

              Oilfield Chemicals market growth will increase by $ 6.75 bn during 2024-2028.

              The Oilfield Chemicals market is expected to grow at a CAGR of 4.37% during 2024-2028.

              Oilfield Chemicals market is segmented by Application( Production, Well stimulation, Drilling fluids, Enhanced oil recovery, Others) Type( Onshore, Offshore)

              3M Co., Ashland Inc., Baker Hughes Co., BASF SE, Chevron Corp., Clariant International Ltd., Croda International Plc, Evonik Industries AG, FMC Corp., Halliburton Co., Kao Corp., Qixia Aotong Chemical Co. Ltd., Sasol Ltd., Schlumberger Ltd., Solvay SA, The Lubrizol Corp., The SNF Group, Yantai Humon Group Co. Ltd., Artek Surfin Chemicals Ltd., Huntsman International LLC are a few of the key vendors in the Oilfield Chemicals market.

              North America will register the highest growth rate of 38% among the other regions. Therefore, the Oilfield Chemicals market in North America is expected to garner significant business opportunities for the vendors during the forecast period.

              US, Canada, China, India, Russia

              • Increased production of crude oilAs oil and gas companies strive to maximize hydrocarbon recovery is the driving factor this market.
              • meet growing energy demands is the driving factor this market.
              • and enhance operational efficiency is the driving factor this market.
              • the demand for oilfield chemicals increases. Increased crude oil production frequently requires well-stimulation techniques is the driving factor this market.
              • including hydraulic fracturing (fracking) and acidizing. Oilfield chemicals such as fracturing fluids and acidizing agents is the driving factor this market.
              • are essential in these processes to enhance reservoir permeability and stimulate oil flow from wells. As crude oil production rises is the driving factor this market.
              • maintaining flow assurance becomes crucial to prevent operational disruptions. Oilfield chemicals are applied to address issues such as wax deposition is the driving factor this market.
              • asphaltene flocculation is the driving factor this market.
              • hydrate formation is the driving factor this market.
              • and scale accumulation in pipelines and production facilities is the driving factor this market.
              • ensuring continuous and efficient oil flow. The production of crude oil often involves the separation of oil and water. Oilfield chemicals designed for emulsion breaking are applied to facilitate efficient separation is the driving factor this market.
              • improving the quality of the produced hydrocarbons. The increased production of crude oil may involve the extraction of sour or acidic crude containing hydrogen sulfide (H2S) and carbon dioxide (CO2). Scavenger chemicals are used to reduce or eliminate these corrosive and toxic components is the driving factor this market.
              • protecting infrastructure and ensuring safety. Increased production in crude oil necessitates the use of various oilfield chemicals to address operational challenges is the driving factor this market.
              • optimize recovery is the driving factor this market.
              • and ensure the integrity of production systems is the driving factor this market.
              • which is expected to fuel the global oilfield market growth during the forecast period. is the driving factor this market.

              The Oilfield Chemicals market vendors should focus on grabbing business opportunities from the Production segment as it accounted for the largest market share in the base year.