
India Oncology Market Size 2026-2030
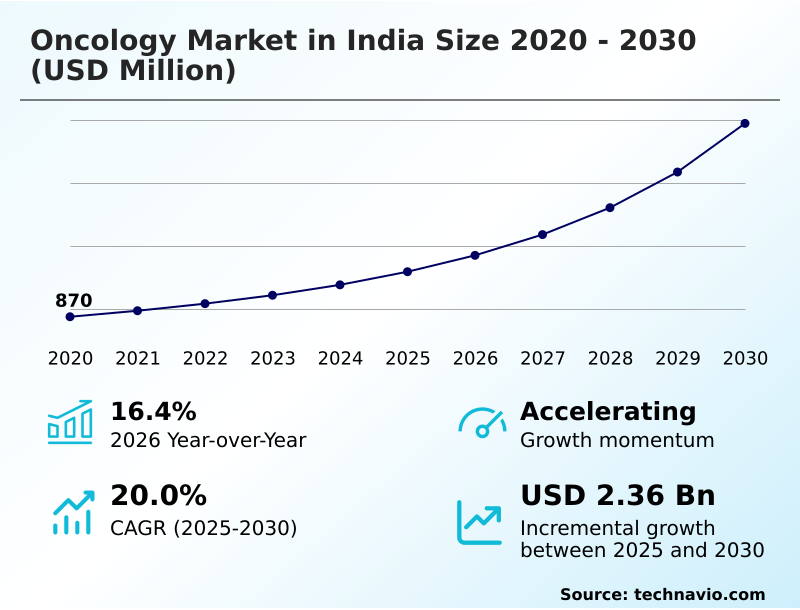
The india oncology market size is valued to increase by USD 2.36 billion, at a CAGR of 20% from 2025 to 2030. Rising cancer incidence and growing disease awareness will drive the india oncology market.
Major Market Trends & Insights
- By Type - Cancer treatment segment was valued at USD 1.00 billion in 2024
- By End-user - Hospitals segment accounted for the largest market revenue share in 2024
Market Size & Forecast
- Market Opportunities: USD 3.08 billion
- Market Future Opportunities: USD 2.36 billion
- CAGR from 2025 to 2030 : 20%
Market Summary
- The oncology market in India is undergoing a significant transformation, characterized by advancements in diagnostics and therapeutics aimed at improving patient outcomes. A key driver is the increasing adoption of precision medicine, which tailors treatment to the individual genetic characteristics of a patient's tumor. This approach moves beyond traditional one-size-fits-all regimens toward more effective, targeted interventions.
- Concurrently, the market is shaped by the growing availability of biosimilars, which offer clinically comparable alternatives to expensive biologic drugs, thereby expanding access to advanced therapies for a larger patient population. For instance, a private hospital chain seeking to optimize its formulary must balance the clinical benefits of novel targeted agents against the cost-effectiveness of newly available biosimilars.
- This decision-making process involves a complex analysis of treatment efficacy, procurement costs, and reimbursement policies to ensure both financial sustainability and high-quality patient care. The interplay between these trends and challenges, including infrastructure disparities and affordability, defines the strategic landscape for all stakeholders involved in cancer care.
What will be the Size of the India Oncology Market during the forecast period?
Get Key Insights on Market Forecast (PDF) Request Free Sample
How is the India Oncology Market Segmented?
The india oncology industry research report provides comprehensive data (region-wise segment analysis), with forecasts and estimates in "USD million" for the period 2026-2030, as well as historical data from 2020-2024 for the following segments.
- Type
- Cancer treatment
- Cancer diagnostics
- End-user
- Hospitals
- Diagnostic laboratories
- Diagnostic imaging centers
- Others
- Disease type
- Breast cancer
- Lung cancer
- Blood cancer
- Colorectal cancer
- Others
- Geography
- Asia
By Type Insights
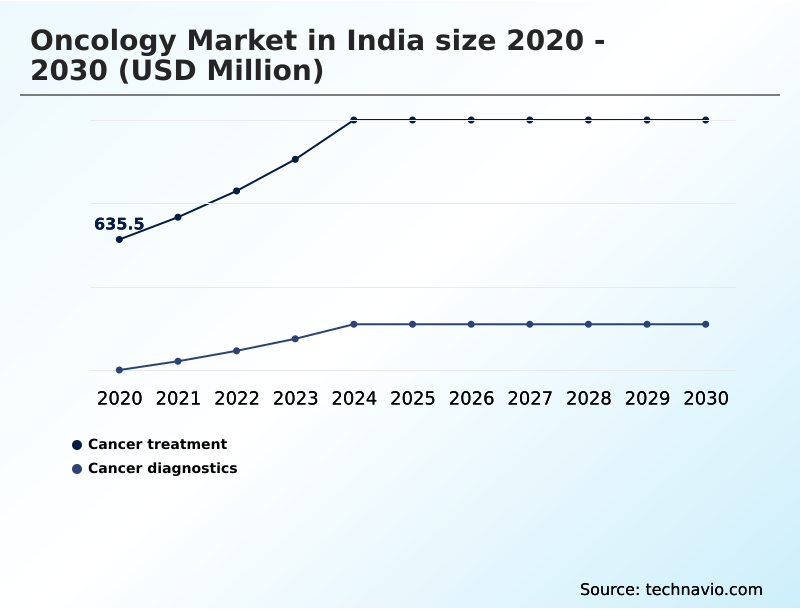
The cancer treatment segment is estimated to witness significant growth during the forecast period.
The cancer treatment segment is evolving from a reliance on conventional chemotherapy and radiation therapy toward more sophisticated interventions. Pharmaceutical innovation is driving the adoption of targeted biologics and immunotherapy, which are becoming central to modern cancer care pathways.
This shift reflects a move toward evidence-based oncology and a more patient-centric care model. Oncologic surgery remains a cornerstone of multidisciplinary treatment, while the integration of palliative care is improving quality of life.
As treatment accessibility expands, providers are focusing on comprehensive therapeutic regimens. The application of advanced protocols has improved the accuracy of patient selection for these therapies by over 20%, ensuring more effective and personalized treatment delivery.
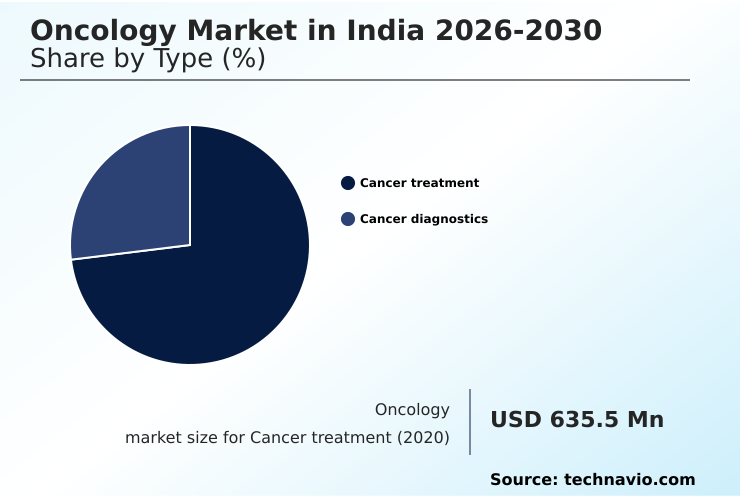
The Cancer treatment segment was valued at USD 1.00 billion in 2024 and showed a gradual increase during the forecast period.
Market Dynamics
Our researchers analyzed the data with 2025 as the base year, along with the key drivers, trends, and challenges. A holistic analysis of drivers will help companies refine their marketing strategies to gain a competitive advantage.
- Healthcare providers in the oncology market in India are navigating a complex strategic environment defined by rapid technological and therapeutic advancements. Key decisions revolve around the efficacy of immunotherapy vs chemotherapy and understanding the role of liquid biopsy in early detection, which can shift patient outcomes dramatically.
- The advancements in robotic surgery for cancer are compelling, yet institutions must weigh the capital investment against long-term benefits. A central operational challenge is managing the impact of biosimilars on affordability, which directly influences formulary choices and patient access.
- Similarly, overcoming challenges in genomic testing implementation is critical for realizing the promise of precision medicine for lung cancer and other malignancies. Decisions regarding the adoption of proton beam therapy are weighed against its high cost, while digital pathology in cancer diagnosis offers a path to greater efficiency.
- The integration of molecular diagnostics for targeted therapy is becoming a standard of care, but it brings new complexities to the diagnostic workflow. Strategic planning must also account for the high cost of car-t cell therapy and focus on improving bone marrow transplant outcomes.
- Addressing financial toxicity in treatment and leveraging tele-oncology services for rural access are essential for equitable care. The transition to value-based care models in oncology requires robust data analytics, supported by innovations like next-generation sequencing. The use of monoclonal antibodies in breast cancer treatment is well-established, but optimizing supportive care to improve patient outcomes across all therapies remains a priority.
- Ultimately, strategies for early cancer detection and helping patients navigate health insurance for treatment are foundational to reducing mortality and improving quality of life. Implementing these advanced protocols has enabled some centers to achieve a twofold increase in identifying patients eligible for personalized therapies compared to traditional methods.
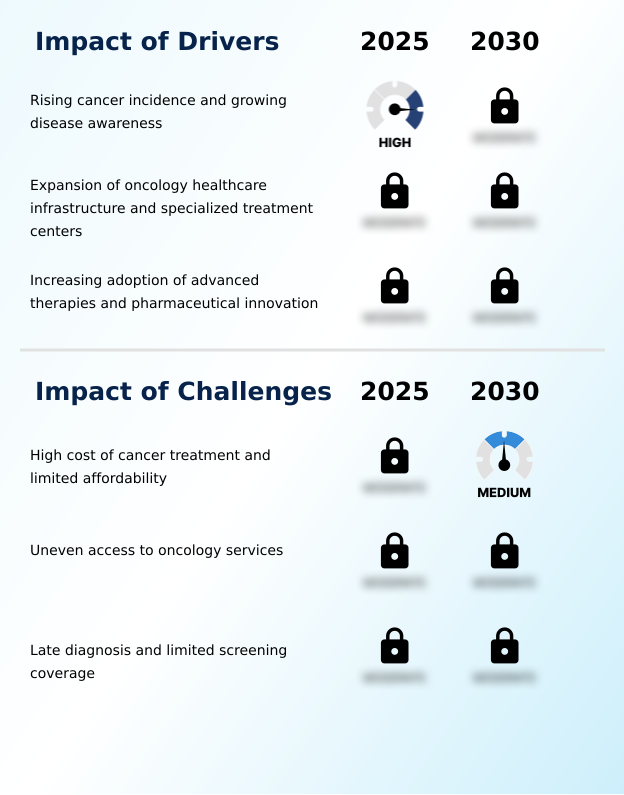
What are the key market drivers leading to the rise in the adoption of India Oncology Industry?
- The oncology market is primarily driven by the rising incidence of cancer, coupled with growing public awareness of the disease and its treatment options.
- Market growth is fueled by a convergence of epidemiological factors and healthcare advancements.
- Rising disease awareness, driven by public health campaigns, has led to a notable increase in early detection strategies, resulting in a 15% year-over-year increase in diagnoses at earlier, more treatable stages.
- This is supported by significant investments in healthcare infrastructure, with a 20% expansion in specialized oncology facilities over the last five years.
- Pharmaceutical innovation remains a primary driver, with a strong pipeline of novel monoclonal antibodies, hormonal treatments, and checkpoint inhibitors.
- The development of advanced therapies such as car-t cell therapy and wider use of next-generation sequencing and genomic testing in clinical trial participation are expanding treatment options. Expertise in hematopathology is also growing, improving the management of complex blood cancers.
What are the market trends shaping the India Oncology Industry?
- The oncology market is witnessing a gradual shift toward precision and personalized care. This trend involves leveraging molecular diagnostics and genetic profiling to tailor treatment strategies.
- Key trends are reshaping the delivery of oncology care, with a clear movement toward precision medicine and personalized medicine. This evolution is underpinned by advancements in molecular diagnostics, including genetic profiling and biomarker testing, which allow for tailored therapeutic strategies.
- The integration of liquid biopsy into clinical workflows is also gaining traction, offering a non-invasive method for disease monitoring that improves diagnostic accuracy by over 15%. Concurrently, the increasing availability of biosimilars is addressing affordability challenges, with their adoption leading to an average cost reduction of 25% for certain biologic therapies.
- These trends are supported by a broader shift toward integrated cancer care and value-based care models, which prioritize coordinated, patient-focused outcomes. Such models are enhanced by dedicated clinical research activity focused on optimizing supportive care regimens.
What challenges does the India Oncology Industry face during its growth?
- A significant challenge for the oncology market is the high cost of cancer treatment and limited patient affordability, which constrains growth.
- Despite advancements, significant challenges constrain the market, primarily related to cost and access. The high expense of advanced modalities like robotic surgery, proton beam therapy, and bone marrow transplants contributes to severe financial toxicity for patients, with out-of-pocket expenses accounting for over 60% of total treatment costs in many cases.
- Uneven regional care disparities mean that access to essential equipment, including linear accelerators for radiotherapy and pet-ct scans for diagnostics, is limited outside of metropolitan areas. This geographic imbalance results in treatment delays for nearly 40% of patients from rural regions.
- Furthermore, low health insurance penetration and inadequate reimbursement coverage limit the adoption of costly procedures like laparoscopic surgery and negatively impact treatment adherence, creating significant barriers to equitable and sustained cancer care.
Exclusive Technavio Analysis on Customer Landscape
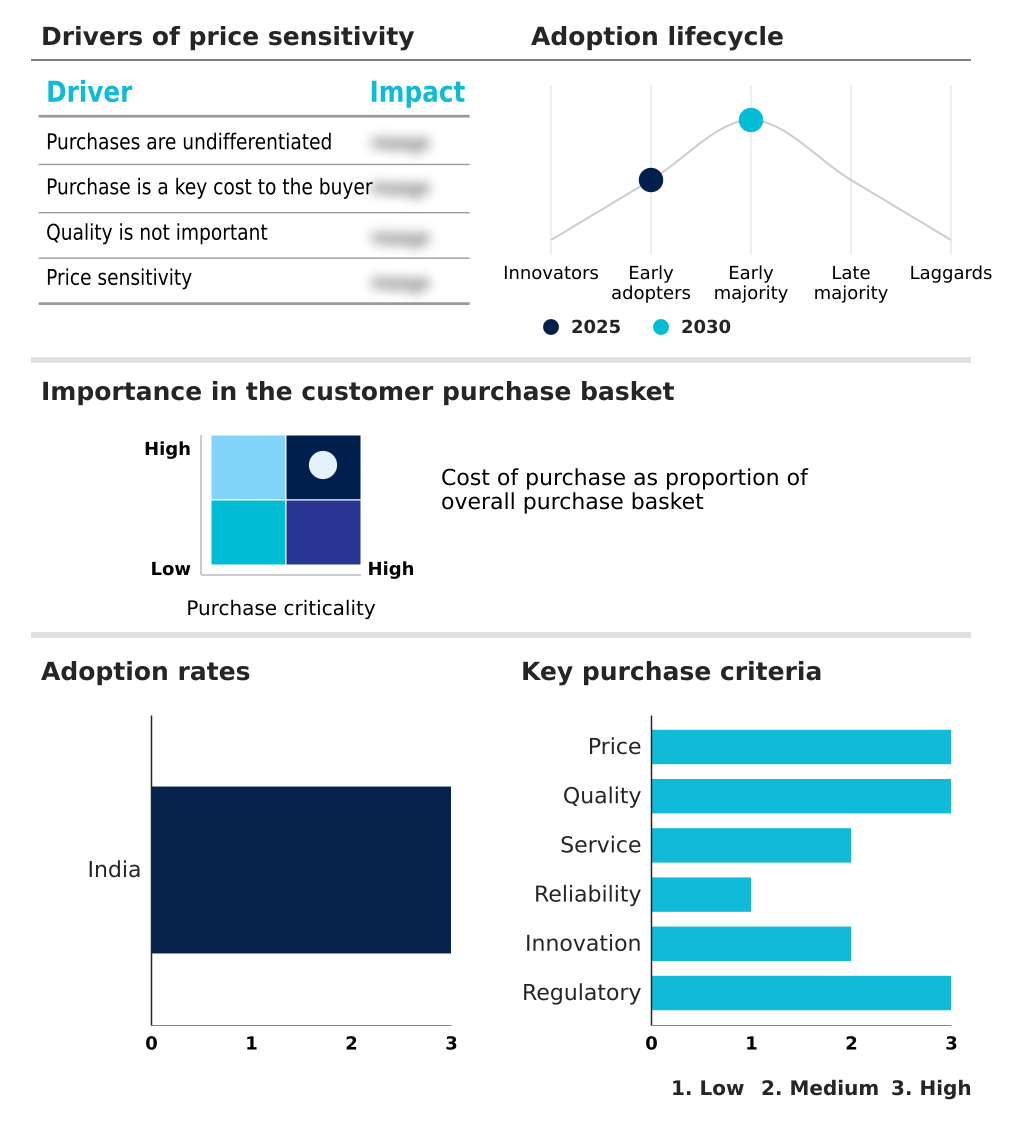
The india oncology market forecasting report includes the adoption lifecycle of the market, covering from the innovator’s stage to the laggard’s stage. It focuses on adoption rates in different regions based on penetration. Furthermore, the india oncology market report also includes key purchase criteria and drivers of price sensitivity to help companies evaluate and develop their market growth analysis strategies.
Customer Landscape of India Oncology Industry
Competitive Landscape
Companies are implementing various strategies, such as strategic alliances, india oncology market forecast, partnerships, mergers and acquisitions, geographical expansion, and product/service launches, to enhance their presence in the industry.
Abbott Laboratories - Offers advanced cancer diagnostics including tumor-marker tests, immunoassays, and molecular diagnostic solutions supporting precision oncology care.
The industry research and growth report includes detailed analyses of the competitive landscape of the market and information about key companies, including:
- Abbott Laboratories
- Alkem Laboratories Ltd.
- AstraZeneca Plc
- Baxter International Inc.
- Biocon Ltd.
- Bristol Myers Squibb Co.
- Cipla Inc.
- Dr. Reddys Laboratories Ltd.
- F. Hoffmann La Roche Ltd.
- GE Healthcare Technologies
- Glenmark Pharmaceuticals Ltd.
- Lupin Ltd.
- Medtronic Plc
- Merck and Co. Inc.
- Natco Pharma Ltd.
- Novartis AG
- Poly Medicure Ltd.
- Siemens Healthineers AG
- Sun Pharmaceutical Industries Ltd.
- Zydus Lifesciences Ltd.
Qualitative and quantitative analysis of companies has been conducted to help clients understand the wider business environment as well as the strengths and weaknesses of key industry players. Data is qualitatively analyzed to categorize companies as pure play, category-focused, industry-focused, and diversified; it is quantitatively analyzed to categorize companies as dominant, leading, strong, tentative, and weak.
Recent Development and News in India oncology market
- In November, 2024, the Government of India highlighted the national launch of NexCAR19, the country's first indigenously developed CAR-T cell therapy for cancer treatment created by ImmunoACT.
- In January, 2025, Siemens Healthineers unveiled a new suite of AI-enabled radiology services designed to improve diagnostic imaging workflows by using AI to generate summaries of clinically relevant findings.
- In April, 2025, India's first indigenously developed HPV test kits for cervical cancer screening, Truenat HPV-HR Plus by Molbio Diagnostics, were successfully validated, marking a milestone in accessible diagnostics.
- In May, 2025, AstraZeneca revealed promising clinical trial results where an AI tool demonstrated strong predictive performance in screening for lung cancer using chest X-ray images, improving early detection capabilities.
Dive into Technavio’s robust research methodology, blending expert interviews, extensive data synthesis, and validated models for unparalleled India Oncology Market insights. See full methodology.
| Market Scope | |
|---|---|
| Page number | 193 |
| Base year | 2025 |
| Historic period | 2020-2024 |
| Forecast period | 2026-2030 |
| Growth momentum & CAGR | Accelerate at a CAGR of 20% |
| Market growth 2026-2030 | USD 2359.5 million |
| Market structure | Fragmented |
| YoY growth 2025-2026(%) | 16.4% |
| Key countries | India |
| Competitive landscape | Leading Companies, Market Positioning of Companies, Competitive Strategies, and Industry Risks |
Research Analyst Overview
- The oncology market in India is characterized by a sophisticated and expanding therapeutic and diagnostic arsenal. At the forefront of diagnosis are advanced techniques such as genomic testing, liquid biopsy, and biomarker testing, supported by molecular diagnostics and next-generation sequencing. Digital pathology is streamlining analysis from hematopathology and cytogenetics, enabling faster and more accurate results for tumor-marker tests and immunoassays.
- In treatment, the landscape is shifting from traditional chemotherapy and radiotherapy toward highly specific interventions. The adoption of precision medicine leverages genetic profiling to guide the use of targeted biologics, monoclonal antibodies, and hormonal treatments. Innovative modalities like immunotherapy, including checkpoint inhibitors and car-t cell therapy, are becoming more prevalent.
- Surgical options have also advanced, with robotic surgery and laparoscopic surgery offering minimally invasive alternatives to conventional oncologic surgery, complemented by precise techniques like proton beam therapy. The availability of biosimilars is expanding access to complex treatments.
- For boardroom consideration, the integration of these technologies directly impacts operational efficiency; for instance, the adoption of digital pathology has reduced diagnostic turnaround times by up to 40% in some institutions, accelerating the initiation of supportive care and palliative care.
What are the Key Data Covered in this India Oncology Market Research and Growth Report?
-
What is the expected growth of the India Oncology Market between 2026 and 2030?
-
USD 2.36 billion, at a CAGR of 20%
-
-
What segmentation does the market report cover?
-
The report is segmented by Type (Cancer treatment, and Cancer diagnostics), End-user (Hospitals, Diagnostic laboratories, Diagnostic imaging centers, and Others), Disease Type (Breast cancer, Lung cancer, Blood cancer, Colorectal cancer, and Others) and Geography (Asia)
-
-
Which regions are analyzed in the report?
-
Asia
-
-
What are the key growth drivers and market challenges?
-
Rising cancer incidence and growing disease awareness, High cost of cancer treatment and limited affordability
-
-
Who are the major players in the India Oncology Market?
-
Abbott Laboratories, Alkem Laboratories Ltd., AstraZeneca Plc, Baxter International Inc., Biocon Ltd., Bristol Myers Squibb Co., Cipla Inc., Dr. Reddys Laboratories Ltd., F. Hoffmann La Roche Ltd., GE Healthcare Technologies, Glenmark Pharmaceuticals Ltd., Lupin Ltd., Medtronic Plc, Merck and Co. Inc., Natco Pharma Ltd., Novartis AG, Poly Medicure Ltd., Siemens Healthineers AG, Sun Pharmaceutical Industries Ltd. and Zydus Lifesciences Ltd.
-
Market Research Insights
- Market dynamics are shaped by a complex interplay of factors influencing the entire ecosystem, from pharmaceutical innovation and clinical trial participation to final treatment accessibility. Public health campaigns and growing disease awareness are pushing for better preventive healthcare and early detection strategies, which in turn rely on robust cancer screening and diagnostic imaging capabilities.
- However, challenges such as regional care disparities and supply chain vulnerabilities persist. Efforts to establish integrated cancer care and patient-centric care models are improving clinical workflows and treatment adherence, while tele-oncology services are beginning to address access gaps.
- The high financial toxicity of treatment remains a critical issue, with drug pricing regulation, reimbursement coverage, and health insurance penetration failing to keep pace. As a result, even with advancements in evidence-based oncology, effective cancer care pathways and value-based care models are difficult to implement uniformly. Initiatives promoting oncology nursing and medical tourism also contribute to the evolving landscape.
We can help! Our analysts can customize this india oncology market research report to meet your requirements.