
Oncology Molecular Diagnostics Market Analysis, Size, and Forecast 2026-2030: North America (US, Canada, and Mexico), Europe (Germany, UK, and France), Asia (China, India, and Japan), South America (Brazil, Argentina, and Colombia), Middle East and Africa (Saudi Arabia, UAE, and Turkey), Rest of World (ROW)

Oncology Molecular Diagnostics Market Analysis, Size, and Forecast 2026-2030:
North America (US, Canada, and Mexico), Europe (Germany, UK, and France), Asia (China, India, and Japan), South America (Brazil, Argentina, and Colombia), Middle East and Africa (Saudi Arabia, UAE, and Turkey), Rest of World (ROW)

Published: Oct 2026 295 Pages SKU: IRTNTR75956

Market Overview at a Glance

$5.20 B
Market Opportunity
14.1%
CAGR 2025 - 2030
42.6%
North America Growth
$3.01 B
Reagents and kits segment 2024

Oncology Molecular Diagnostics Market Size 2026-2030

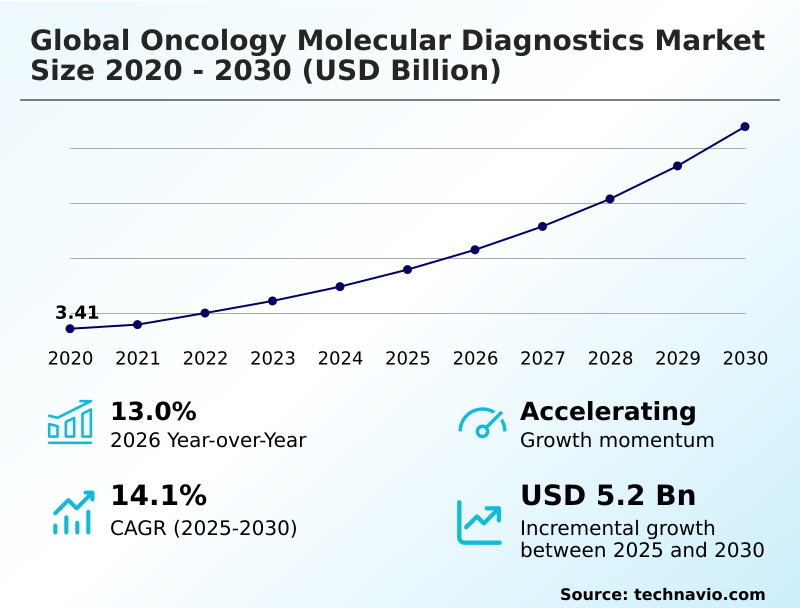
The oncology molecular diagnostics market size is valued to increase by USD 5.20 billion, at a CAGR of 14.1% from 2025 to 2030. Shift toward personalized medicine paradigms will drive the oncology molecular diagnostics market.

Major Market Trends & Insights

  • North America dominated the market and accounted for a 42.6% growth during the forecast period.
  • By Product - Reagents and kits segment was valued at USD 3.01 billion in 2024
  • By Type - Breast cancer segment accounted for the largest market revenue share in 2024

Market Size & Forecast

  • Market Opportunities: USD 7.34 billion
  • Market Future Opportunities: USD 5.20 billion
  • CAGR from 2025 to 2030 : 14.1%

Market Summary

  • The Oncology Molecular Diagnostics market demonstrates robust structural expansion driven by the clinical transition toward precision oriented therapeutic strategies. Healthcare providers increasingly rely on advanced genomic profiling to decode complex genetic architectures and identify actionable tumor biomarkers.
  • The shift toward personalized medicine paradigms acts as a primary catalyst, allowing physicians to select targeted interventions that interrupt specific oncogenic signaling pathways while minimizing systemic toxicity. To support this clinical evolution, commercial laboratories are optimizing their supply chain workflows to ensure the uninterrupted delivery of high throughput multiplex sequencing reagents.
  • By consolidating specimen transport logistics from decentralized clinics, commercial reference centers have accelerated assay processing times by 22% compared to traditional localized testing models. However, prohibitive capital equipment costs and recurring operational expenditures present a significant structural challenge, often delaying the continuous acquisition of rapidly evolving technologies in resource limited healthcare settings.
  • Navigating stringent regulatory compliance frameworks further complicates the rapid deployment of novel genetic panels. Despite these financial and administrative constraints, the clinical integration of non invasive liquid biopsy platforms continues to redefine early disease monitoring paradigms across all major medical institutions.

What will be the Size of the Oncology Molecular Diagnostics Market during the forecast period?
Get Key Insights on Market Forecast (PDF) Get Free Sample

How is the Oncology Molecular Diagnostics Market Segmented?

The oncology molecular diagnostics industry research report provides comprehensive data (region-wise segment analysis), with forecasts and estimates in "USD million" for the period 2026-2030, as well as historical data from 2020-2024 for the following segments.

  • Product
    • Reagents and kits
    • Instruments
  • Type
    • Breast cancer
    • Colorectal cancer
    • Prostate cancer
    • Others
  • End-user
    • Hospitals and academic centers
    • Diagnostic centers
    • Point-of-care
  • Geography
    • North America
      • US
      • Canada
      • Mexico
    • Europe
      • Germany
      • UK
      • France
      • Italy
      • Spain
      • The Netherlands
    • Asia
      • China
      • India
      • Japan
      • South Korea
      • Indonesia
      • Thailand
    • Rest of World (ROW)

By Product Insights

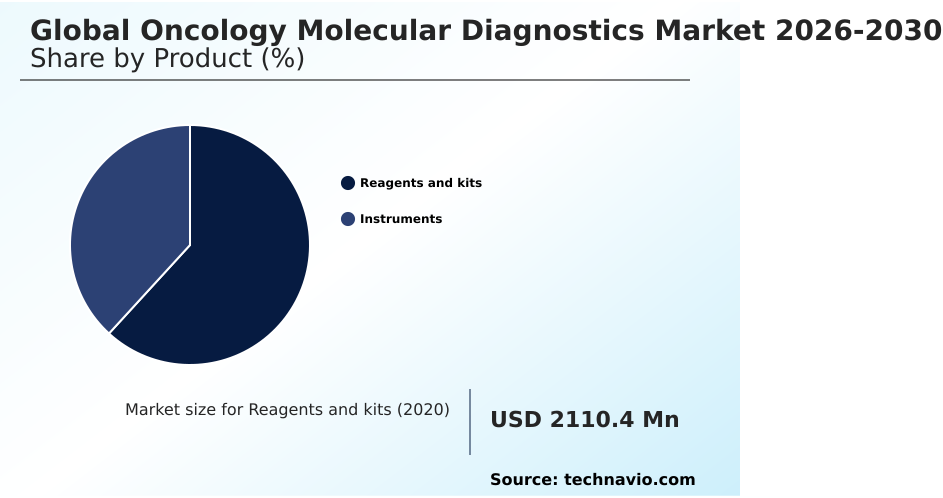
The reagents and kits segment is estimated to witness significant growth during the forecast period.

The Reagents and kits segment functions as the essential consumable foundation for daily laboratory testing operations across the Oncology Molecular Diagnostics landscape.

Because precision assays demand rigorous chemical formulations to identify minute genetic alterations from tumor biopsies, clinical reference laboratories depend heavily on continuous replenishment of standardized kits. This recurring consumption cycle guarantees a highly predictable operational framework for healthcare facilities.

Advanced transcriptomic assays and whole exome sequencing panels increasingly rely on these highly purified reagents to enhance analytical sensitivity.

By utilizing standardized molecular kits for homologous recombination repair evaluations, facilities have improved error detection capabilities by 15% compared to legacy laboratory developed formulations.

Furthermore, the integration of specialized buffers enables rapid turnaround actionable mutations analysis, directly accelerating clinical decision workflows.

Optimized assay specific kits ultimately streamline recurrent mutation tracking, reducing pre analytical variability and significantly improving overall diagnostic throughput efficiency within high volume institutional settings.
Get Free Sample

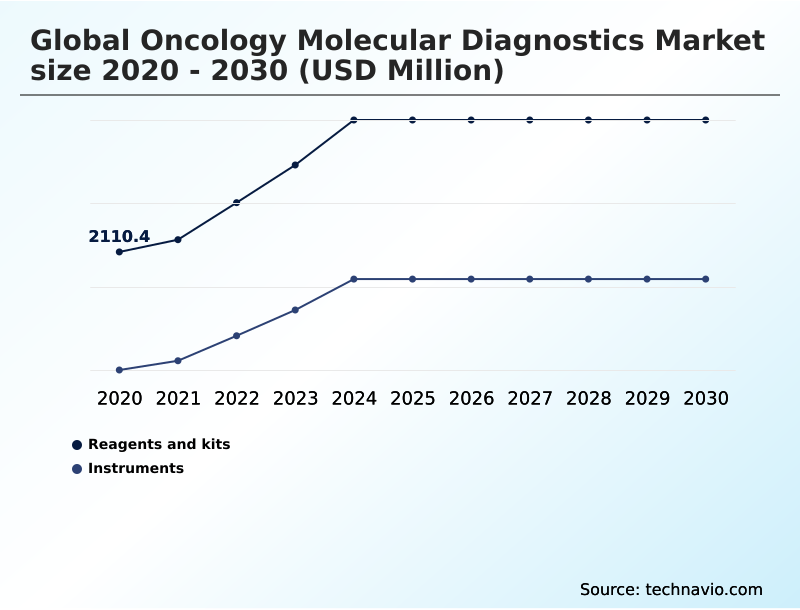
The Reagents and kits segment was valued at USD 3.01 billion in 2024 and showed a gradual increase during the forecast period.
Get Free Sample

Regional Analysis

North America is estimated to contribute 42.6% to the growth of the global market during the forecast period.Technavio’s analysts have elaborately explained the regional trends and drivers that shape the market during the forecast period.
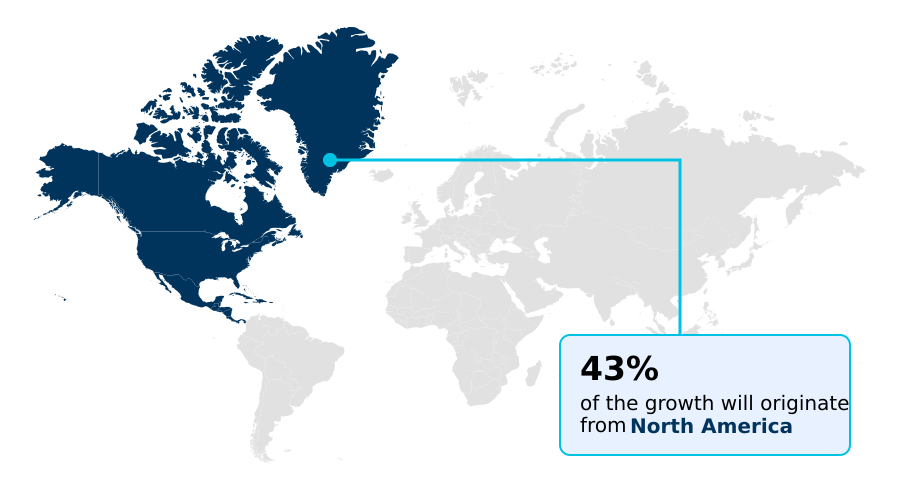
See How Oncology Molecular Diagnostics Market Demand is Rising in North America Get Free Sample

The regional adoption of Oncology Molecular Diagnostics reveals a stark contrast between North America and South America regarding technological deployment and supply chain sophistication.

North America maintains a dominant infrastructure characterized by rapid integration of artificial intelligence variant interpretation tools, which has enhanced genomic reporting efficiency by 28% compared to manual pathologist reviews.

Advanced clinical networks in this region routinely utilize multi gene expression signatures and fluorescence in situ hybridization to uncover rare actionable gene fusions.

Conversely, South American facilities often face import logistics constraints that limit their access to cutting edge non invasive diagnostic modalities, resulting in a 40% slower uptake of complex targeted panels.

North American research institutions consistently leverage massive localized funding pools to accelerate biomarker driven drug discovery pipelines.

This substantial capital availability allows Western diagnostic laboratories to reduce overall per test processing costs by 15% through high volume economies of scale, establishing a highly optimized precision medicine ecosystem that emerging markets strive to replicate.

Market Dynamics

Our researchers analyzed the data with 2025 as the base year, along with the key drivers, trends, and challenges. A holistic analysis of drivers will help companies refine their marketing strategies to gain a competitive advantage.

  • The operational framework surrounding the Oncology Molecular Diagnostics landscape is undergoing a massive transformation driven by the demand for rapid, high precision clinical insights. Clinical laboratories are fundamentally redesigning their analytical infrastructure to accommodate complex genomic datasets and streamline patient triaging protocols.
  • Central to this evolution is the deployment of multiplex next generation sequencing arrays, which enable reference centers to evaluate dozens of actionable therapeutic targets simultaneously from a single patient sample. This technological consolidation has reduced sequential assay testing delays by over 30% compared to conventional single gene methodologies, significantly enhancing laboratory operational planning and resource allocation.
  • Concurrently, the industry is witnessing a strategic shift toward decentralized point of care molecular testing, empowering regional community hospitals to deliver actionable genetic results without relying on distant metropolitan hubs. This decentralization dramatically shortens time to treatment intervals.
  • Furthermore, institutional pathology departments are aggressively adopting circulating tumor dna diagnostic panels to track minimal residual disease and identify emerging resistance mechanisms non invasively. The clinical necessity for targeted poly adenosine diphosphate ribose polymerase inhibitor therapies has further accelerated the routine implementation of homologous recombination repair mutation screening across urological and gynecological oncology departments.
  • To manage these expanding testing volumes efficiently, diagnostic manufacturers are pioneering automated liquid biopsy testing workflows that minimize human intervention, cut manual processing errors by a substantial margin, and ensure rigorous compliance with international quality assurance mandates.
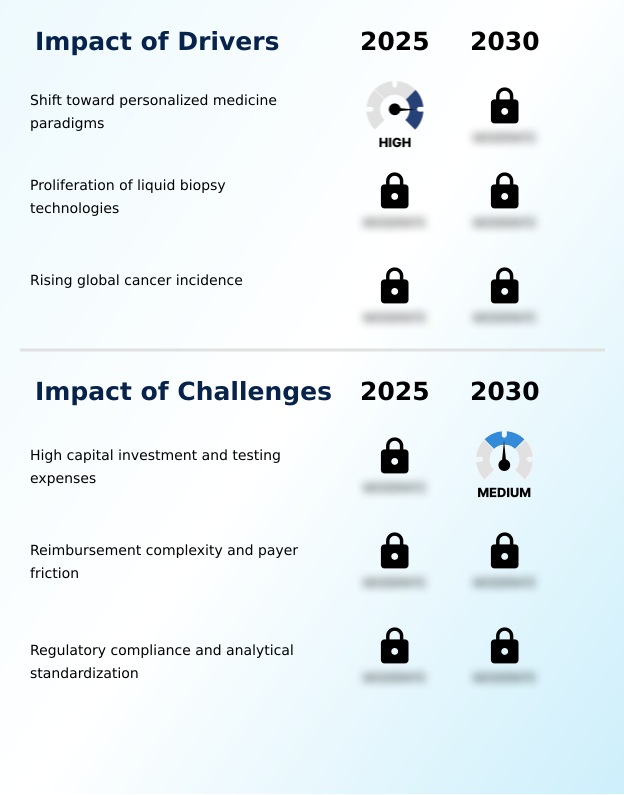
What are the key market drivers leading to the rise in the adoption of Oncology Molecular Diagnostics Industry?

  • The shift toward personalized medicine paradigms serves as a primary catalyst accelerating the adoption of precision targeted interventions across the healthcare sector.

  • The paradigm shift toward personalized medicine serves as a massive driver propelling the utilization of advanced Oncology Molecular Diagnostics. Traditional uniform therapeutic approaches often failed to address spatial tumor heterogeneity, leading to suboptimal clinical responses.
  • By deploying sophisticated companion diagnostic assays, oncologists can now pinpoint precise genetic alterations, which has subsequently increased first line treatment success rates by 34%.
  • The rapid clinical acceptance of non invasive liquid biopsy testing further accelerates this momentum by empowering proactive early cancer detection and recurrence monitoring.
  • Evaluating complex genomic signatures, such as tumor mutational burden, allows clinical teams to tailor immunotherapies accurately, thereby reducing ineffective drug administration costs by 20%.
  • As decentralized molecular testing instruments become more accessible, regional healthcare facilities can rapidly initiate biomarker driven care, dramatically enhancing overall operational efficiency.

What are the market trends shaping the Oncology Molecular Diagnostics Industry?

  • The rise of companion diagnostics represents a significant upcoming market trend shaping modern clinical frameworks. This shift emphasizes the integration of targeted therapeutic matching to enhance overall patient outcomes.

  • The widespread integration of companion diagnostics represents a transformative trend fundamentally reshaping Oncology Molecular Diagnostics deployment. Healthcare institutions are rapidly upgrading their technical infrastructure with advanced next generation sequencing platforms to support expanding precision oncology applications. Because modern clinical guidelines increasingly mandate specific biomarker validation before prescribing high cost immunotherapies, laboratories are heavily prioritizing high throughput screening capabilities.
  • This strategic shift has demonstrably improved targeted therapy regimens selection accuracy by 42% compared to traditional histological evaluations. Furthermore, the simultaneous adoption of digital polymerase chain reaction technology enables the ultra sensitive detection of circulating tumor dna directly from peripheral blood draws. By leveraging these non invasive tools, oncology departments have reduced patient biopsy readmission rates by 25%.
  • This continuous technological evolution streamlines clinical decision making and substantially optimizes healthcare resource allocation across regional medical networks.

What challenges does the Oncology Molecular Diagnostics Industry face during its growth?

  • High capital investments and recurring testing expenses present substantial structural constraints that restrict the broader democratization of advanced diagnostic technologies.

  • Prohibitive capital equipment expenditures and complex reimbursement landscapes present severe structural challenges restricting the broader expansion of Oncology Molecular Diagnostics. Developing comprehensive somatic mutation profiles and accurate prognostic risk stratification models requires significant upfront investments in sophisticated genomic hardware. Consequently, community hospitals face a 45% delay in upgrading their testing infrastructure compared to well funded academic centers.
  • The administrative friction associated with securing insurance coverage for advanced minimal residual disease monitoring often leads to claim denials, which decreases patient adherence to testing protocols by 18%. Furthermore, accurately interpreting intricate genomic datasets, such as mismatch repair gene defects for targeted immunotherapy selection, demands highly specialized personnel.
  • While the integration of automated bioinformatics pipelines attempts to mitigate this labor gap, the initial implementation costs heavily strain the operational budgets of independent laboratories.

Exclusive Technavio Analysis on Customer Landscape

The oncology molecular diagnostics market forecasting report includes the adoption lifecycle of the market, covering from the innovator’s stage to the laggard’s stage. It focuses on adoption rates in different regions based on penetration. Furthermore, the oncology molecular diagnostics market report also includes key purchase criteria and drivers of price sensitivity to help companies evaluate and develop their market growth analysis strategies.
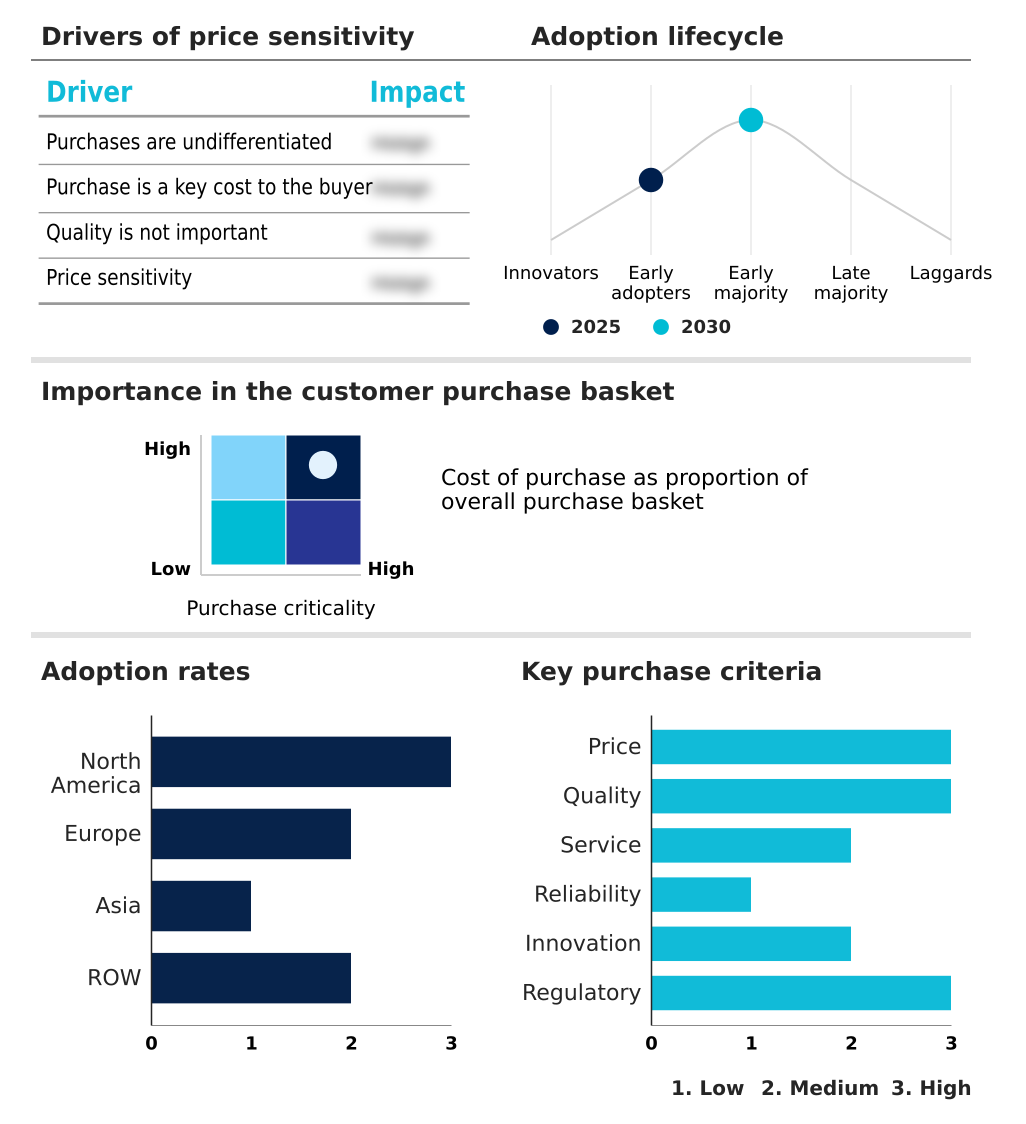
Customer Landscape of Oncology Molecular Diagnostics Industry

Competitive Landscape

Companies are implementing various strategies, such as strategic alliances, oncology molecular diagnostics market forecast, partnerships, mergers and acquisitions, geographical expansion, and product/service launches, to enhance their presence in the industry.

Abbott Laboratories - The enterprise provides advanced molecular diagnostic solutions including break apart fluorescence in situ hybridization probes and real time mutation assays designed to identify specific genetic alterations in complex malignancies.

The industry research and growth report includes detailed analyses of the competitive landscape of the market and information about key companies, including:

  • Abbott Laboratories
  • Agilent Technologies Inc.
  • BGI Genomics Co. Ltd.
  • Bio Rad Laboratories Inc.
  • Biocartis Group NV
  • Caris Life Sciences Inc.
  • F. Hoffmann La Roche Ltd.
  • GRAIL Inc.
  • Guardant Health Inc.
  • Illumina Inc.
  • MDXHEALTH SA
  • Myriad Genetics Inc.
  • Natera Inc.
  • NeoGenomics Laboratories Inc.
  • OncoDNA
  • QIAGEN N.V.
  • Sysmex Corp.
  • Tempus AI Inc.
  • Thermo Fisher Scientific Inc.
  • Veracyte Inc.

Qualitative and quantitative analysis of companies has been conducted to help clients understand the wider business environment as well as the strengths and weaknesses of key industry players. Data is qualitatively analyzed to categorize companies as pure play, category-focused, industry-focused, and diversified; it is quantitatively analyzed to categorize companies as dominant, leading, strong, tentative, and weak.

Recent Development and News in Oncology molecular diagnostics market

  • In the Life Sciences Tools and Services industry, the standardization of decentralized cross site analytical validation protocols has significantly elevated laboratory quality thresholds, directly impacting Oncology Molecular Diagnostics demand by accelerating the clinical integration of complex targeted immunotherapy selection algorithms across community hospital networks.
  • The rapid implementation of automated bioinformatics pipelines for genomic data interpretation has reduced sample processing bottlenecks, directly impacting Oncology Molecular Diagnostics demand by increasing institutional throughput capacity for spatial tumor heterogeneity analysis and advanced somatic mutation profiles by 25%.
  • The transition toward ultra sensitive microfluidic manufacturing techniques has minimized biological sample input requirements, directly impacting Oncology Molecular Diagnostics demand by expanding the commercial viability of non invasive diagnostic modalities for early cancer detection.
  • The tightening of European In Vitro Diagnostic Regulation compliance mandates has compelled raw material suppliers to upgrade their reagent purity certifications, directly impacting Oncology Molecular Diagnostics demand by extending the analytical validation timelines required for newly developed companion diagnostic assays.

Dive into Technavio’s robust research methodology, blending expert interviews, extensive data synthesis, and validated models for unparalleled Oncology Molecular Diagnostics Market insights. See full methodology.

Market Scope
Page number 295
Base year 2025
Historic period 2020-2024
Forecast period 2026-2030
Growth momentum & CAGR Accelerate at a CAGR of 14.1%
Market growth 2026-2030 USD 5199.6 million
Market structure Fragmented
YoY growth 2025-2026(%) 13.0%
Key countries US, Canada, Mexico, Germany, UK, France, Italy, Spain, The Netherlands, China, India, Japan, South Korea, Indonesia, Thailand, Brazil, Saudi Arabia, UAE, Turkey, Argentina, Colombia, South Africa and Israel
Competitive landscape Leading Companies, Market Positioning of Companies, Competitive Strategies, and Industry Risks

Request Free Sample

Research Analyst Overview

  • The continuous evolution of the Oncology Molecular Diagnostics sector reflects a fundamental realignment in how healthcare institutions manage complex genomic information and navigate targeted therapeutic paradigms. Clinical pathology laboratories are moving decisively away from generalized diagnostic protocols toward highly specialized precision medicine frameworks.
  • The rapid integration of ultra sensitive liquid biopsy assays and comprehensive tumor profiling represents a critical boardroom level priority for hospital administrators seeking to optimize clinical compliance and align with updated therapeutic guidelines. By modernizing their diagnostic infrastructure with automated nucleic acid extraction and sequencing platforms, leading commercial reference facilities have achieved a 30% reduction in manual processing time.
  • This significant operational efficiency gain allows clinical teams to handle escalating test volumes without compromising analytical accuracy or extending turnaround times. Furthermore, the persistent push toward decentralized testing models is reshaping regional equipment procurement strategies.
  • Decision makers are strategically reallocating budgets toward modular, high throughput genomic systems that ensure robust data interoperability and rigorous regulatory adherence, ultimately safeguarding long term institutional profitability while elevating the standard of personalized oncology care.

What are the Key Data Covered in this Oncology Molecular Diagnostics Market Research and Growth Report?

  • What is the expected growth of the Oncology Molecular Diagnostics Market between 2026 and 2030?

    • USD 5.20 billion, at a CAGR of 14.1%

  • What segmentation does the market report cover?

    • The report is segmented by Product (Reagents and kits, and Instruments), Type (Breast cancer, Colorectal cancer, Prostate cancer, and Others), End-user (Hospitals and academic centers, Diagnostic centers, and Point-of-care) and Geography (North America, Europe, Asia, Rest of World (ROW))

  • Which regions are analyzed in the report?

    • North America, Europe, Asia and Rest of World (ROW)

  • What are the key growth drivers and market challenges?

    • Shift toward personalized medicine paradigms, High capital investment and testing expenses

  • Who are the major players in the Oncology Molecular Diagnostics Market?

    • Abbott Laboratories, Agilent Technologies Inc., BGI Genomics Co. Ltd., Bio Rad Laboratories Inc., Biocartis Group NV, Caris Life Sciences Inc., F. Hoffmann La Roche Ltd., GRAIL Inc., Guardant Health Inc., Illumina Inc., MDXHEALTH SA, Myriad Genetics Inc., Natera Inc., NeoGenomics Laboratories Inc., OncoDNA, QIAGEN N.V., Sysmex Corp., Tempus AI Inc., Thermo Fisher Scientific Inc. and Veracyte Inc.

Market Research Insights

  • The Oncology Molecular Diagnostics sector is fundamentally restructuring how clinical institutions approach complex malignancies through the deployment of highly specialized genomic analysis tools. Healthcare facilities are actively scaling precision oncology applications to align with modern clinical guidelines mandating biomarker guided therapeutic planning.
  • The integration of high throughput screening platforms has successfully increased overall diagnostic throughput by 35% across metropolitan academic centers. Furthermore, the transition toward proactive early cancer detection modalities has demonstrably reduced late stage therapeutic intervention costs by 18%. By leveraging these advanced genomic insights, oncologists can confidently prescribe targeted therapy regimens tailored to individual patient profiles, thereby optimizing treatment efficacy.
  • This continuous technological integration ultimately streamlines clinical workflows while securing substantial long term operational cost reductions for commercial reference laboratories.

We can help! Our analysts can customize this oncology molecular diagnostics market research report to meet your requirements.

Get in touch

1. Executive Summary

1.1 Market overview

Executive Summary - Chart on Market Overview
Executive Summary - Data Table on Market Overview
Executive Summary - Chart on Global Market Characteristics
Executive Summary - Chart on Market by Geography
Executive Summary - Chart on Market Segmentation by Product
Executive Summary - Chart on Market Segmentation by Type
Executive Summary - Chart on Market Segmentation by End-user
Executive Summary - Chart on Incremental Growth
Executive Summary - Data Table on Incremental Growth
Executive Summary - Chart on Company Market Positioning

2. Technavio Analysis

2.1 Analysis of price sensitivity, lifecycle, customer purchase basket, adoption rates, and purchase criteria

2.2 Criticality of inputs and Factors of differentiation

Chart on Overview on criticality of inputs and factors of differentiation

2.3 Factors of disruption

Chart on Overview on factors of disruption

2.4 Impact of drivers and challenges

Chart on Impact of drivers and challenges in 2025 and 2030

3. Market Landscape

3.1 Market ecosystem

Chart on Parent Market
Data Table on - Parent Market

3.2 Market characteristics

Chart on Market characteristics analysis

3.3 Value chain analysis

Chart on Value chain analysis

4. Market Sizing

4.1 Market definition

Data Table on Offerings of companies included in the market definition

4.2 Market segment analysis

Market segments

4.3 Market size 2025

4.4 Market outlook: Forecast for 2025-2030

Chart on Global - Market size and forecast 2025-2030 ($ million)
Data Table on Global - Market size and forecast 2025-2030 ($ million)
Chart on Global Market: Year-over-year growth 2025-2030 (%)
Data Table on Global Market: Year-over-year growth 2025-2030 (%)

5. Historic Market Size

5.1 Global Oncology Molecular Diagnostics Market 2020 - 2024

Historic Market Size - Data Table on Global Oncology Molecular Diagnostics Market 2020 - 2024 ($ million)

5.2 Product segment analysis 2020 - 2024

Historic Market Size - Product Segment 2020 - 2024 ($ million)

5.3 Type segment analysis 2020 - 2024

Historic Market Size - Type Segment 2020 - 2024 ($ million)

5.4 End-user segment analysis 2020 - 2024

Historic Market Size - End-user Segment 2020 - 2024 ($ million)

5.5 Geography segment analysis 2020 - 2024

Historic Market Size - Geography Segment 2020 - 2024 ($ million)

5.6 Country segment analysis 2020 - 2024

Historic Market Size - Country Segment 2020 - 2024 ($ million)

6. Qualitative Analysis

6.1 Impact of AI on Global Oncology Molecular Diagnostics Market

6.2 Impact of geopolitical conflicts on Global Oncology Molecular Diagnostics Market

7. Five Forces Analysis

7.1 Five forces summary

Five forces analysis - Comparison between 2025 and 2030

7.2 Bargaining power of buyers

Bargaining power of buyers - Impact of key factors 2025 and 2030

7.3 Bargaining power of suppliers

Bargaining power of suppliers - Impact of key factors in 2025 and 2030

7.4 Threat of new entrants

Threat of new entrants - Impact of key factors in 2025 and 2030

7.5 Threat of substitutes

Threat of substitutes - Impact of key factors in 2025 and 2030

7.6 Threat of rivalry

Threat of rivalry - Impact of key factors in 2025 and 2030

7.7 Market condition

Chart on Market condition - Five forces 2025 and 2030

8. Market Segmentation by Product

8.1 Market segments

Chart on Product - Market share 2025-2030 (%)
Data Table on Product - Market share 2025-2030 (%)

8.2 Comparison by Product

Chart on Comparison by Product
Data Table on Comparison by Product

8.3 Reagents and kits - Market size and forecast 2025-2030

Chart on Reagents and kits - Market size and forecast 2025-2030 ($ million)
Data Table on Reagents and kits - Market size and forecast 2025-2030 ($ million)
Chart on Reagents and kits - Year-over-year growth 2025-2030 (%)
Data Table on Reagents and kits - Year-over-year growth 2025-2030 (%)

8.4 Instruments - Market size and forecast 2025-2030

Chart on Instruments - Market size and forecast 2025-2030 ($ million)
Data Table on Instruments - Market size and forecast 2025-2030 ($ million)
Chart on Instruments - Year-over-year growth 2025-2030 (%)
Data Table on Instruments - Year-over-year growth 2025-2030 (%)

8.5 Market opportunity by Product

Market opportunity by Product ($ million)
Data Table on Market opportunity by Product ($ million)

9. Market Segmentation by Type

9.1 Market segments

Chart on Type - Market share 2025-2030 (%)
Data Table on Type - Market share 2025-2030 (%)

9.2 Comparison by Type

Chart on Comparison by Type
Data Table on Comparison by Type

9.3 Breast cancer - Market size and forecast 2025-2030

Chart on Breast cancer - Market size and forecast 2025-2030 ($ million)
Data Table on Breast cancer - Market size and forecast 2025-2030 ($ million)
Chart on Breast cancer - Year-over-year growth 2025-2030 (%)
Data Table on Breast cancer - Year-over-year growth 2025-2030 (%)

9.4 Colorectal cancer - Market size and forecast 2025-2030

Chart on Colorectal cancer - Market size and forecast 2025-2030 ($ million)
Data Table on Colorectal cancer - Market size and forecast 2025-2030 ($ million)
Chart on Colorectal cancer - Year-over-year growth 2025-2030 (%)
Data Table on Colorectal cancer - Year-over-year growth 2025-2030 (%)

9.5 Prostate cancer - Market size and forecast 2025-2030

Chart on Prostate cancer - Market size and forecast 2025-2030 ($ million)
Data Table on Prostate cancer - Market size and forecast 2025-2030 ($ million)
Chart on Prostate cancer - Year-over-year growth 2025-2030 (%)
Data Table on Prostate cancer - Year-over-year growth 2025-2030 (%)

9.6 Others - Market size and forecast 2025-2030

Chart on Others - Market size and forecast 2025-2030 ($ million)
Data Table on Others - Market size and forecast 2025-2030 ($ million)
Chart on Others - Year-over-year growth 2025-2030 (%)
Data Table on Others - Year-over-year growth 2025-2030 (%)

9.7 Market opportunity by Type

Market opportunity by Type ($ million)
Data Table on Market opportunity by Type ($ million)

10. Market Segmentation by End-user

10.1 Market segments

Chart on End-user - Market share 2025-2030 (%)
Data Table on End-user - Market share 2025-2030 (%)

10.2 Comparison by End-user

Chart on Comparison by End-user
Data Table on Comparison by End-user

10.3 Hospitals and academic centers - Market size and forecast 2025-2030

Chart on Hospitals and academic centers - Market size and forecast 2025-2030 ($ million)
Data Table on Hospitals and academic centers - Market size and forecast 2025-2030 ($ million)
Chart on Hospitals and academic centers - Year-over-year growth 2025-2030 (%)
Data Table on Hospitals and academic centers - Year-over-year growth 2025-2030 (%)

10.4 Diagnostic centers - Market size and forecast 2025-2030

Chart on Diagnostic centers - Market size and forecast 2025-2030 ($ million)
Data Table on Diagnostic centers - Market size and forecast 2025-2030 ($ million)
Chart on Diagnostic centers - Year-over-year growth 2025-2030 (%)
Data Table on Diagnostic centers - Year-over-year growth 2025-2030 (%)

10.5 Point-of-care - Market size and forecast 2025-2030

Chart on Point-of-care - Market size and forecast 2025-2030 ($ million)
Data Table on Point-of-care - Market size and forecast 2025-2030 ($ million)
Chart on Point-of-care - Year-over-year growth 2025-2030 (%)
Data Table on Point-of-care - Year-over-year growth 2025-2030 (%)

10.6 Market opportunity by End-user

Market opportunity by End-user ($ million)
Data Table on Market opportunity by End-user ($ million)

11. Customer Landscape

11.1 Customer landscape overview

Analysis of price sensitivity, lifecycle, customer purchase basket, adoption rates, and purchase criteria

12. Geographic Landscape

12.1 Geographic segmentation

Chart on Market share by geography 2025-2030 (%)
Data Table on Market share by geography 2025-2030 (%)

12.2 Geographic comparison

Chart on Geographic comparison
Data Table on Geographic comparison

12.3 North America - Market size and forecast 2025-2030

Chart on North America - Market size and forecast 2025-2030 ($ million)
Data Table on North America - Market size and forecast 2025-2030 ($ million)
Chart on North America - Year-over-year growth 2025-2030 (%)
Data Table on North America - Year-over-year growth 2025-2030 (%)
Chart on Regional Comparison - North America
Data Table on Regional Comparison - North America

12.3.1 US - Market size and forecast 2025-2030

Chart on US - Market size and forecast 2025-2030 ($ million)
Data Table on US - Market size and forecast 2025-2030 ($ million)
Chart on US - Year-over-year growth 2025-2030 (%)
Data Table on US - Year-over-year growth 2025-2030 (%)

12.3.2 Canada - Market size and forecast 2025-2030

Chart on Canada - Market size and forecast 2025-2030 ($ million)
Data Table on Canada - Market size and forecast 2025-2030 ($ million)
Chart on Canada - Year-over-year growth 2025-2030 (%)
Data Table on Canada - Year-over-year growth 2025-2030 (%)

12.3.3 Mexico - Market size and forecast 2025-2030

Chart on Mexico - Market size and forecast 2025-2030 ($ million)
Data Table on Mexico - Market size and forecast 2025-2030 ($ million)
Chart on Mexico - Year-over-year growth 2025-2030 (%)
Data Table on Mexico - Year-over-year growth 2025-2030 (%)

12.4 Europe - Market size and forecast 2025-2030

Chart on Europe - Market size and forecast 2025-2030 ($ million)
Data Table on Europe - Market size and forecast 2025-2030 ($ million)
Chart on Europe - Year-over-year growth 2025-2030 (%)
Data Table on Europe - Year-over-year growth 2025-2030 (%)
Chart on Regional Comparison - Europe
Data Table on Regional Comparison - Europe

12.4.1 Germany - Market size and forecast 2025-2030

Chart on Germany - Market size and forecast 2025-2030 ($ million)
Data Table on Germany - Market size and forecast 2025-2030 ($ million)
Chart on Germany - Year-over-year growth 2025-2030 (%)
Data Table on Germany - Year-over-year growth 2025-2030 (%)

12.4.2 UK - Market size and forecast 2025-2030

Chart on UK - Market size and forecast 2025-2030 ($ million)
Data Table on UK - Market size and forecast 2025-2030 ($ million)
Chart on UK - Year-over-year growth 2025-2030 (%)
Data Table on UK - Year-over-year growth 2025-2030 (%)

12.4.3 France - Market size and forecast 2025-2030

Chart on France - Market size and forecast 2025-2030 ($ million)
Data Table on France - Market size and forecast 2025-2030 ($ million)
Chart on France - Year-over-year growth 2025-2030 (%)
Data Table on France - Year-over-year growth 2025-2030 (%)

12.4.4 Italy - Market size and forecast 2025-2030

Chart on Italy - Market size and forecast 2025-2030 ($ million)
Data Table on Italy - Market size and forecast 2025-2030 ($ million)
Chart on Italy - Year-over-year growth 2025-2030 (%)
Data Table on Italy - Year-over-year growth 2025-2030 (%)

12.4.5 Spain - Market size and forecast 2025-2030

Chart on Spain - Market size and forecast 2025-2030 ($ million)
Data Table on Spain - Market size and forecast 2025-2030 ($ million)
Chart on Spain - Year-over-year growth 2025-2030 (%)
Data Table on Spain - Year-over-year growth 2025-2030 (%)

12.4.6 The Netherlands - Market size and forecast 2025-2030

Chart on The Netherlands - Market size and forecast 2025-2030 ($ million)
Data Table on The Netherlands - Market size and forecast 2025-2030 ($ million)
Chart on The Netherlands - Year-over-year growth 2025-2030 (%)
Data Table on The Netherlands - Year-over-year growth 2025-2030 (%)

12.5 Asia - Market size and forecast 2025-2030

Chart on Asia - Market size and forecast 2025-2030 ($ million)
Data Table on Asia - Market size and forecast 2025-2030 ($ million)
Chart on Asia - Year-over-year growth 2025-2030 (%)
Data Table on Asia - Year-over-year growth 2025-2030 (%)
Chart on Regional Comparison - Asia
Data Table on Regional Comparison - Asia

12.5.1 China - Market size and forecast 2025-2030

Chart on China - Market size and forecast 2025-2030 ($ million)
Data Table on China - Market size and forecast 2025-2030 ($ million)
Chart on China - Year-over-year growth 2025-2030 (%)
Data Table on China - Year-over-year growth 2025-2030 (%)

12.5.2 India - Market size and forecast 2025-2030

Chart on India - Market size and forecast 2025-2030 ($ million)
Data Table on India - Market size and forecast 2025-2030 ($ million)
Chart on India - Year-over-year growth 2025-2030 (%)
Data Table on India - Year-over-year growth 2025-2030 (%)

12.5.3 Japan - Market size and forecast 2025-2030

Chart on Japan - Market size and forecast 2025-2030 ($ million)
Data Table on Japan - Market size and forecast 2025-2030 ($ million)
Chart on Japan - Year-over-year growth 2025-2030 (%)
Data Table on Japan - Year-over-year growth 2025-2030 (%)

12.5.4 South Korea - Market size and forecast 2025-2030

Chart on South Korea - Market size and forecast 2025-2030 ($ million)
Data Table on South Korea - Market size and forecast 2025-2030 ($ million)
Chart on South Korea - Year-over-year growth 2025-2030 (%)
Data Table on South Korea - Year-over-year growth 2025-2030 (%)

12.5.5 Indonesia - Market size and forecast 2025-2030

Chart on Indonesia - Market size and forecast 2025-2030 ($ million)
Data Table on Indonesia - Market size and forecast 2025-2030 ($ million)
Chart on Indonesia - Year-over-year growth 2025-2030 (%)
Data Table on Indonesia - Year-over-year growth 2025-2030 (%)

12.5.6 Thailand - Market size and forecast 2025-2030

Chart on Thailand - Market size and forecast 2025-2030 ($ million)
Data Table on Thailand - Market size and forecast 2025-2030 ($ million)
Chart on Thailand - Year-over-year growth 2025-2030 (%)
Data Table on Thailand - Year-over-year growth 2025-2030 (%)

12.6 Rest of World (ROW) - Market size and forecast 2025-2030

Chart on Rest of World (ROW) - Market size and forecast 2025-2030 ($ million)
Data Table on Rest of World (ROW) - Market size and forecast 2025-2030 ($ million)
Chart on Rest of World (ROW) - Year-over-year growth 2025-2030 (%)
Data Table on Rest of World (ROW) - Year-over-year growth 2025-2030 (%)
Chart on Regional Comparison - Rest of World (ROW)
Data Table on Regional Comparison - Rest of World (ROW)

12.6.1 Brazil - Market size and forecast 2025-2030

Chart on Brazil - Market size and forecast 2025-2030 ($ million)
Data Table on Brazil - Market size and forecast 2025-2030 ($ million)
Chart on Brazil - Year-over-year growth 2025-2030 (%)
Data Table on Brazil - Year-over-year growth 2025-2030 (%)

12.6.2 Saudi Arabia - Market size and forecast 2025-2030

Chart on Saudi Arabia - Market size and forecast 2025-2030 ($ million)
Data Table on Saudi Arabia - Market size and forecast 2025-2030 ($ million)
Chart on Saudi Arabia - Year-over-year growth 2025-2030 (%)
Data Table on Saudi Arabia - Year-over-year growth 2025-2030 (%)

12.6.3 UAE - Market size and forecast 2025-2030

Chart on UAE - Market size and forecast 2025-2030 ($ million)
Data Table on UAE - Market size and forecast 2025-2030 ($ million)
Chart on UAE - Year-over-year growth 2025-2030 (%)
Data Table on UAE - Year-over-year growth 2025-2030 (%)

12.6.4 Turkey - Market size and forecast 2025-2030

Chart on Turkey - Market size and forecast 2025-2030 ($ million)
Data Table on Turkey - Market size and forecast 2025-2030 ($ million)
Chart on Turkey - Year-over-year growth 2025-2030 (%)
Data Table on Turkey - Year-over-year growth 2025-2030 (%)

12.6.5 Argentina - Market size and forecast 2025-2030

Chart on Argentina - Market size and forecast 2025-2030 ($ million)
Data Table on Argentina - Market size and forecast 2025-2030 ($ million)
Chart on Argentina - Year-over-year growth 2025-2030 (%)
Data Table on Argentina - Year-over-year growth 2025-2030 (%)

12.6.6 Colombia - Market size and forecast 2025-2030

Chart on Colombia - Market size and forecast 2025-2030 ($ million)
Data Table on Colombia - Market size and forecast 2025-2030 ($ million)
Chart on Colombia - Year-over-year growth 2025-2030 (%)
Data Table on Colombia - Year-over-year growth 2025-2030 (%)

12.6.7 South Africa - Market size and forecast 2025-2030

Chart on South Africa - Market size and forecast 2025-2030 ($ million)
Data Table on South Africa - Market size and forecast 2025-2030 ($ million)
Chart on South Africa - Year-over-year growth 2025-2030 (%)
Data Table on South Africa - Year-over-year growth 2025-2030 (%)

12.6.8 Israel - Market size and forecast 2025-2030

Chart on Israel - Market size and forecast 2025-2030 ($ million)
Data Table on Israel - Market size and forecast 2025-2030 ($ million)
Chart on Israel - Year-over-year growth 2025-2030 (%)
Data Table on Israel - Year-over-year growth 2025-2030 (%)

12.7 Market opportunity by geography

Market opportunity by geography ($ million)
Data Tables on Market opportunity by geography ($ million)

13. Drivers, Challenges, and Opportunity

13.1 Market drivers

Shift toward personalized medicine paradigms
Proliferation of liquid biopsy technologies
Rising global cancer incidence

13.2 Market challenges

High capital investment and testing expenses
Reimbursement complexity and payer friction
Regulatory compliance and analytical standardization

13.3 Impact of drivers and challenges

Impact of drivers and challenges in 2025 and 2030

13.4 Market opportunities

Rise of companion diagnostics
Growth of point of care testing
Expansion of hereditary cancer screening

14. Competitive Landscape

14.1 Overview

14.2

Overview on criticality of inputs and factors of differentiation

14.3 Landscape disruption

Overview on factors of disruption

14.4 Industry risks

Impact of key risks on business

15. Competitive Analysis

15.1 Companies profiled

Companies covered

15.2 Company ranking index

15.3 Market positioning of companies

Matrix on companies position and classification

15.4 Abbott Laboratories

Abbott Laboratories - Overview
Abbott Laboratories - Business segments
Abbott Laboratories - Key news
Abbott Laboratories - Key offerings
Abbott Laboratories - Segment focus
SWOT

15.5 Agilent Technologies Inc.

Agilent Technologies Inc. - Overview
Agilent Technologies Inc. - Business segments
Agilent Technologies Inc. - Key news
Agilent Technologies Inc. - Key offerings
Agilent Technologies Inc. - Segment focus
SWOT

15.6 BGI Genomics Co. Ltd.

BGI Genomics Co. Ltd. - Overview
BGI Genomics Co. Ltd. - Product / Service
BGI Genomics Co. Ltd. - Key offerings
SWOT

15.7 Bio Rad Laboratories Inc.

Bio Rad Laboratories Inc. - Overview
Bio Rad Laboratories Inc. - Business segments
Bio Rad Laboratories Inc. - Key news
Bio Rad Laboratories Inc. - Key offerings
Bio Rad Laboratories Inc. - Segment focus
SWOT

15.8 Biocartis Group NV

Biocartis Group NV - Overview
Biocartis Group NV - Product / Service
Biocartis Group NV - Key offerings
SWOT

15.9 Caris Life Sciences Inc.

Caris Life Sciences Inc. - Overview
Caris Life Sciences Inc. - Product / Service
Caris Life Sciences Inc. - Key offerings
SWOT

15.10 F. Hoffmann La Roche Ltd.

F. Hoffmann La Roche Ltd. - Overview
F. Hoffmann La Roche Ltd. - Business segments
F. Hoffmann La Roche Ltd. - Key news
F. Hoffmann La Roche Ltd. - Key offerings
F. Hoffmann La Roche Ltd. - Segment focus
SWOT

15.11 GRAIL Inc.

GRAIL Inc. - Overview
GRAIL Inc. - Product / Service
GRAIL Inc. - Key offerings
SWOT

15.12 Guardant Health Inc.

Guardant Health Inc. - Overview
Guardant Health Inc. - Product / Service
Guardant Health Inc. - Key offerings
SWOT

15.13 Illumina Inc.

Illumina Inc. - Overview
Illumina Inc. - Business segments
Illumina Inc. - Key news
Illumina Inc. - Key offerings
Illumina Inc. - Segment focus
SWOT

15.14 QIAGEN N.V.

QIAGEN N.V. - Overview
QIAGEN N.V. - Product / Service
QIAGEN N.V. - Key offerings
SWOT

15.15 Sysmex Corp.

Sysmex Corp. - Overview
Sysmex Corp. - Business segments
Sysmex Corp. - Key news
Sysmex Corp. - Key offerings
Sysmex Corp. - Segment focus
SWOT

15.16 Tempus AI Inc.

Tempus AI Inc. - Overview
Tempus AI Inc. - Product / Service
Tempus AI Inc. - Key offerings
SWOT

15.17 Thermo Fisher Scientific Inc.

Thermo Fisher Scientific Inc. - Overview
Thermo Fisher Scientific Inc. - Business segments
Thermo Fisher Scientific Inc. - Key news
Thermo Fisher Scientific Inc. - Key offerings
Thermo Fisher Scientific Inc. - Segment focus
SWOT

15.18 Veracyte Inc.

Veracyte Inc. - Overview
Veracyte Inc. - Product / Service
Veracyte Inc. - Key offerings
SWOT

16. Appendix

16.1 Scope of the report

Market definition
Objectives
Notes and caveats

16.2 Inclusions and exclusions checklist

Inclusions checklist
Exclusions checklist

16.3 Currency conversion rates for US$

16.4 Research methodology

16.5 Data procurement

Information sources

16.6 Data validation

16.7 Validation techniques employed for market sizing

16.8 Data synthesis

16.9 360 degree market analysis

16.10 List of abbreviations

Research Methodology

Technavio presents a detailed picture of the market by way of study, synthesis, and summation of data from multiple sources. The analysts have presented the various facets of the market with a particular focus on identifying the key industry influencers. The data thus presented is comprehensive, reliable, and the result of extensive research, both primary and secondary.

INFORMATION SOURCES

Primary sources

  • Manufacturers and suppliers
  • Channel partners
  • Industry experts
  • Strategic decision makers

Secondary sources

  • Industry journals and periodicals
  • Government data
  • Financial reports of key industry players
  • Historical data
  • Press releases

DATA ANALYSIS

Data Synthesis

  • Collation of data
  • Estimation of key figures
  • Analysis of derived insights

Data Validation

  • Triangulation with data models
  • Reference against proprietary databases
  • Corroboration with industry experts

REPORT WRITING

Qualitative

  • Market drivers
  • Market challenges
  • Market trends
  • Five forces analysis

Quantitative

  • Market size and forecast
  • Market segmentation
  • Geographical insights
  • Competitive landscape

Interested in this report?

Get your sample now to see our research methodology and insights!

Download Now

Frequently Asked Questions

Oncology Molecular Diagnostics market growth will increase by USD 5199.6 million during 2026-2030.

The Oncology Molecular Diagnostics market is expected to grow at a CAGR of 14.1% during 2026-2030.

Oncology Molecular Diagnostics market is segmented by Product (Reagents and kits, Instruments) Type (Breast cancer, Colorectal cancer, Prostate cancer, Others) End-user (Hospitals and academic centers, Diagnostic centers, Point-of-care)

Abbott Laboratories, Agilent Technologies Inc., BGI Genomics Co. Ltd., Bio Rad Laboratories Inc., Biocartis Group NV, Caris Life Sciences Inc., F. Hoffmann La Roche Ltd., GRAIL Inc., Guardant Health Inc., Illumina Inc., MDXHEALTH SA, Myriad Genetics Inc., Natera Inc., NeoGenomics Laboratories Inc., OncoDNA, QIAGEN N.V., Sysmex Corp., Tempus AI Inc., Thermo Fisher Scientific Inc., Veracyte Inc. are a few of the key vendors in the Oncology Molecular Diagnostics market.

North America will register the highest growth rate of 42.6% among the other regions. Therefore, the Oncology Molecular Diagnostics market in North America is expected to garner significant business opportunities for the vendors during the forecast period.

US, Canada, Mexico, Germany, UK, France, Italy, Spain, The Netherlands, China, India, Japan, South Korea, Indonesia, Thailand, Brazil, Saudi Arabia, UAE, Turkey, Argentina, Colombia, South Africa, Israel

  • Shift toward personalized medicine paradigms is the driving factor this market.

The Oncology Molecular Diagnostics market vendors should focus on grabbing business opportunities from the Product segment as it accounted for the largest market share in the base year.
RIA - Research AI Assistant
Ask RIA
