



US Online Gambling Market Size 2026-2030
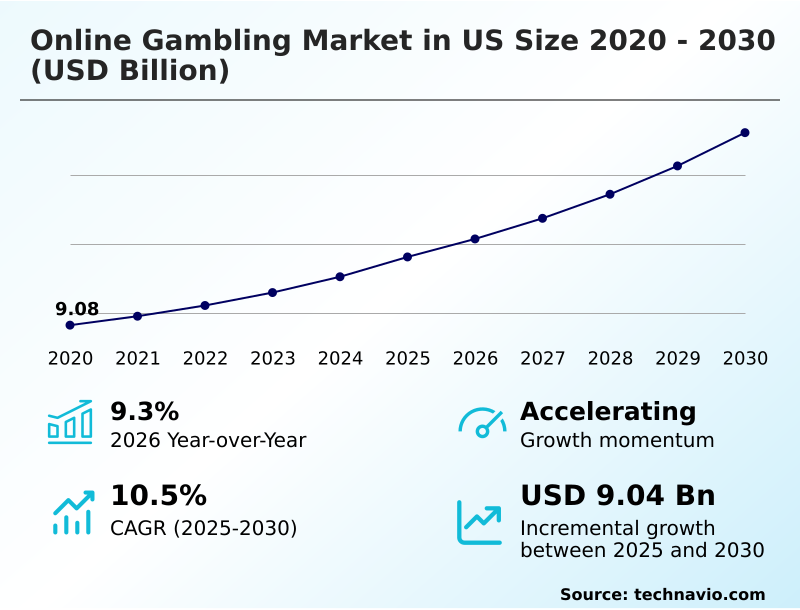
The us online gambling market size is valued to increase by USD 9.04 billion, at a CAGR of 10.5% from 2025 to 2030. Expansive legislative state legalization efforts create new regulated regional gaming territories will drive the us online gambling market.
Major Market Trends & Insights
- By End-user - Casual gamblers segment was valued at USD 5.53 billion in 2024
- By Type - Sports betting segment accounted for the largest market revenue share in 2024
Market Size & Forecast
- Market Opportunities: USD 13.99 billion
- Market Future Opportunities: USD 9.04 billion
- CAGR from 2025 to 2030 : 10.5%
Market Summary
- The Online Gambling Market demonstrates robust expansion fueled by sophisticated digital infrastructure and evolving consumer entertainment preferences. Operators continuously refine their supply chain operations by optimizing digital payment processing rails to handle high-frequency low-denomination transactions securely. By upgrading backend data processing systems leading platforms have successfully reduced transaction latency improving real-time betting execution speeds by 30%.
- Expansive state-level legalization efforts act as a primary driver unlocking new regional territories and instantly expanding the total addressable consumer base for licensed digital sportsbooks. Conversely rising state regulatory tax rate hikes present a formidable challenge compressing corporate profit margins and compelling operators to strictly restructure their promotional budgets to maintain operational viability.
- Advancements in application programming interfaces enable seamless integration between media broadcasting and mobile wagering platforms. This structural convergence transforms passive sports viewership into an active highly participatory consumer experience. The continuous refinement of secure cloud database compliance ensures that high-volume digital wagering remains both resilient and firmly aligned with stringent regulatory frameworks.
What will be the Size of the US Online Gambling Market during the forecast period?
Get Key Insights on Market Forecast (PDF) Get Free Sample
How is the US Online Gambling Market Segmented?
The us online gambling industry research report provides comprehensive data (region-wise segment analysis), with forecasts and estimates in "USD million" for the period 2026-2030, as well as historical data from 2020-2024 for the following segments.
- End-user
- Casual gamblers
- Professional gamblers
- High-rollers
- Type
- Sports betting
- Casino games
- Poker
- Bingo
- Lottery
- Device
- Desktop
- Mobile
- Geography
- North America
- US
- North America
By End-user Insights
The casual gamblers segment is estimated to witness significant growth during the forecast period.
The casual gamblers segment drives sustained transaction volumes within the digital entertainment ecosystem by emphasizing accessible low-stakes wagering and rapid social engagement. Operators capture this demographic by deploying interactive gaming portfolios that minimize cognitive friction and amplify entertainment value.
Utilizing certified random number generators ensures fair gameplay which builds critical trust among recreational users. By integrating virtual live dealer casinos platforms replicate the social atmosphere of physical venues successfully boosting session lengths.
Furthermore the introduction of dynamic in-play prop wagers allows these users to place spontaneous bets during high-profile sporting events significantly elevating overall platform activity. Tailored gamified promotional rewards increase consumer retention metrics by 22% directly optimizing user lifetime value.
This strategic segmentation enables operators to convert sporadic participation into consistent engagement effectively stabilizing revenue streams while minimizing customer acquisition costs.
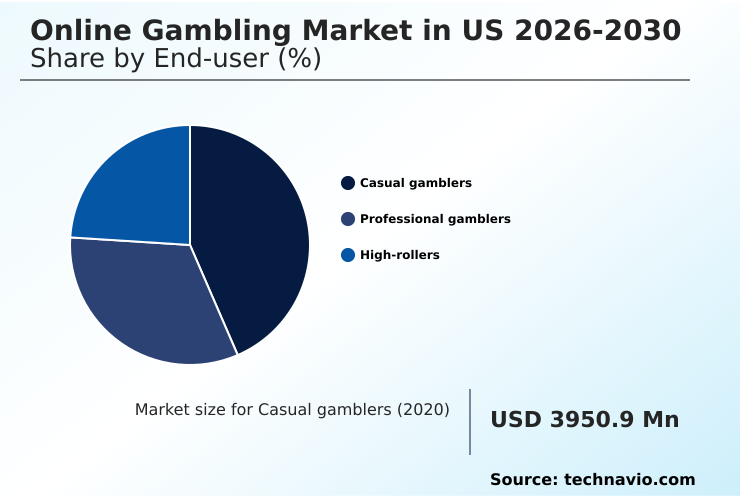
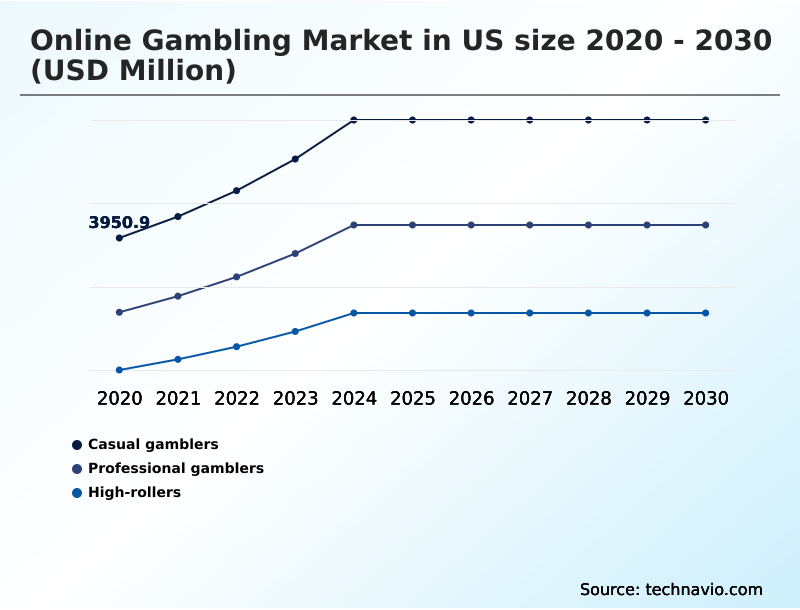
The Casual gamblers segment was valued at USD 5.53 billion in 2024 and showed a gradual increase during the forecast period.
Market Dynamics
Our researchers analyzed the data with 2025 as the base year, along with the key drivers, trends, and challenges. A holistic analysis of drivers will help companies refine their marketing strategies to gain a competitive advantage.
- The sustained operational success of digital wagering enterprises heavily depends on deploying sophisticated technical architectures that seamlessly blend regulatory compliance with engaging consumer experiences. As the domestic regulatory environment fragments strict mobile sports wagering platform compliance becomes paramount to avoid severe operational penalties and ensure uninterrupted service delivery.
- Operators optimizing their backend infrastructure report a 25% improvement in cross-state regulatory auditing efficiency compared to platforms utilizing legacy compliance software. The strategic live dealer casino studio integration has fundamentally altered user engagement paradigms allowing digital platforms to replicate the immersive atmosphere of physical entertainment venues.
- Simultaneously the introduction of peer-to-peer prediction market contracts broadens the target demographic by attracting analytically minded participants who prefer event-based trading over traditional odds. To capture casual consumers developers prioritize robust automated virtual slot machine software ensuring fair randomized outcomes that build long-term user trust.
- Maximizing these diverse digital assets requires precise digital sports handle optimization strategies which empower operators to dynamically adjust promotional spending and betting lines in real time based on fluctuating consumer demand.
- By continuously refining these interconnected systems leading digital providers enhance their overall supply chain resilience streamline their customer acquisition workflows and maintain a decisive competitive advantage in an increasingly saturated digital entertainment environment. This meticulous synchronization of compliance frameworks and interactive product portfolios ensures that digital platforms can sustain elevated transactional volumes while strictly adhering to evolving state mandates.
What are the key market drivers leading to the rise in the adoption of US Online Gambling Industry?
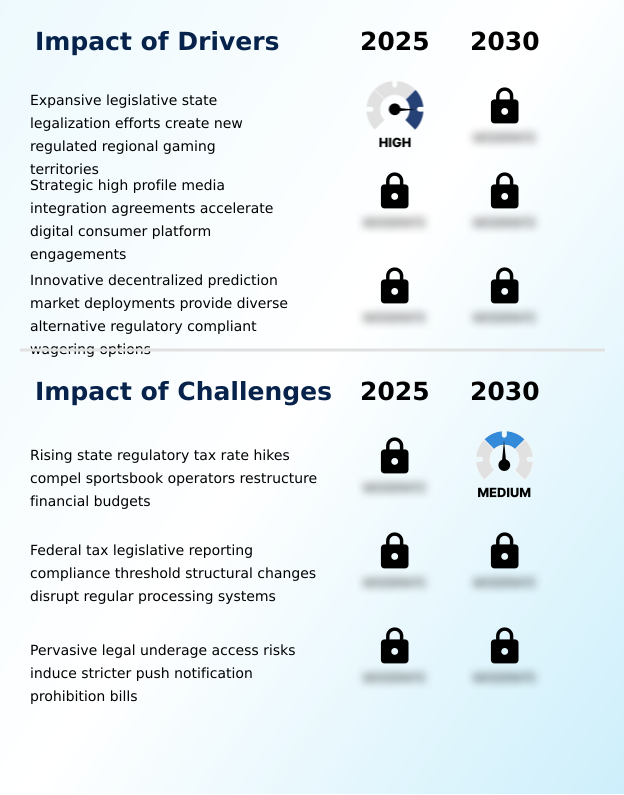
- Expansive state-level legalization efforts continually establish new regulated regional gaming territories.
- The continuous expansion of regulated digital territories serves as the primary catalyst accelerating domestic platform adoption. The systematic rollout of progressive state-level licensing regimes instantly unlocks millions of untapped consumers for licensed digital operators.
- To capitalize on these newly accessible demographics developers are actively deploying advanced real-time micro-betting engines within dynamic digital sportsbook architecture.
- The seamless integration of interactive betting lines and sophisticated mobile wagering applications has increased in-game wagering volumes by 35% across major athletic broadcasts.
- Furthermore by utilizing resilient cloud-hosted gaming servers operators have reduced system downtime by 20% during peak sporting events.
- The strategic implementation of personalized omnichannel loyalty programs successfully translates this spontaneous engagement into long-term brand dedication optimizing customer acquisition costs and stabilizing overall enterprise profitability.
What are the market trends shaping the US Online Gambling Industry?
- The rapid commercial emergence of regulated real-world prediction markets fundamentally restructures consumer behavior. This structural shift redirects engagement toward dynamic contract-based event trading.
- The mainstream normalization of sophisticated event forecasting fundamentally restructures modern consumer entertainment preferences. Consumers are rapidly transitioning away from purely randomized mechanics toward analytical fractional contract shares and decentralized prediction markets that emulate traditional financial exchanges. This behavioral shift forces operators to integrate robust event-based contract trading modules and highly intuitive stock-market-style interfaces directly into their primary applications.
- By deploying these predictive contract exchanges platforms have successfully increased daily user retention rates by 28% and reduced off-season engagement drop-offs by 22%. Furthermore the development of comprehensive cross-platform entertainment ecosystems allows users to seamlessly navigate between sportsbooks and automated sweepstakes engines.
- These structural innovations enable enterprise gaming providers to capture discretionary consumer capital more effectively driving sustained platform loyalty while diversifying long-term operational revenue streams.
What challenges does the US Online Gambling Industry face during its growth?
- Rising state regulatory tax rate hikes compel sportsbook operators to completely restructure their internal financial budgets.
- The aggressive implementation of stringent state-level consumer protection mandates introduces severe operational friction across the digital entertainment landscape. Regulatory bodies increasingly mandate the deployment of comprehensive monthly consumer financial invoicing to ensure long-term market stability. Implementing these reporting frameworks alongside advanced compliance management software has inadvertently increased backend administrative costs by 15% for major operators.
- Furthermore integrating robust fraud detection systems and highly secure biometric authentication gateways extends mobile application onboarding times causing an 18% increase in initial user registration abandonment. To maintain absolute security developers must constantly update their digital wallet tokenization and algorithmic odds management protocols.
- These compounding technical requirements force organizations to divert essential capital away from product innovation severely compressing corporate profit margins.
Exclusive Technavio Analysis on Customer Landscape
The us online gambling market forecasting report includes the adoption lifecycle of the market, covering from the innovator’s stage to the laggard’s stage. It focuses on adoption rates in different regions based on penetration. Furthermore, the us online gambling market report also includes key purchase criteria and drivers of price sensitivity to help companies evaluate and develop their market growth analysis strategies.
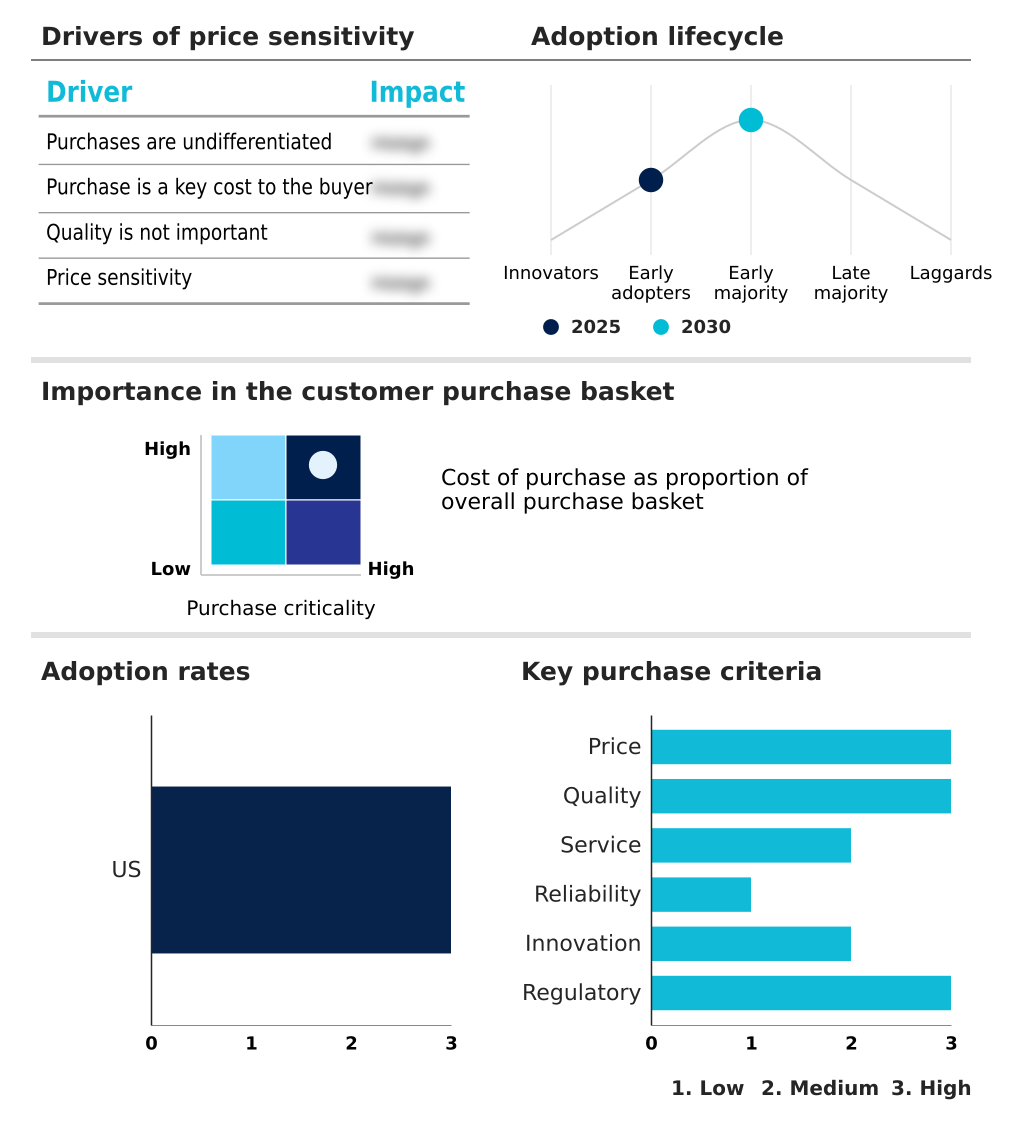
Customer Landscape of US Online Gambling Industry
Competitive Landscape
Companies are implementing various strategies, such as strategic alliances, us online gambling market forecast, partnerships, mergers and acquisitions, geographical expansion, and product/service launches, to enhance their presence in the industry.
Ballys Corp. - The platform delivers comprehensive interactive entertainment solutions integrating digital sports wagering real-time casino gaming and advanced interactive betting systems to maximize consumer engagement and streamline digital transaction processes.
The industry research and growth report includes detailed analyses of the competitive landscape of the market and information about key companies, including:
- Ballys Corp.
- Bet365 Group Ltd.
- Betfred Group
- BetMGM LLC
- BetParx
- Borgata Online
- Caesars Digital
- DraftKings Inc.
- Entain Plc
- ESPN India
- Fanatics Inc.
- FanDuel Inc.
- Hard Rock Digital
- Mohegan
- PlayStar
- PointsBet Holdings Limited
- Prime Sportsbook
- Resorts Digital Gaming LLC
- Rush Street Interactive Inc.
- World Series of Poker
Qualitative and quantitative analysis of companies has been conducted to help clients understand the wider business environment as well as the strengths and weaknesses of key industry players. Data is qualitatively analyzed to categorize companies as pure play, category-focused, industry-focused, and diversified; it is quantitatively analyzed to categorize companies as dominant, leading, strong, tentative, and weak.
Recent Development and News in Us online gambling market
- In the Casinos and Gaming industry the rapid deployment of cloud-based gaming server architectures has reduced latency for live-action broadcasting by 35% directly driving demand within the Online Gambling market for real-time micro-betting features and synchronized in-play athletic wagering.
- The widespread adoption of biometric identity verification standards across physical gaming terminals has accelerated digital checkout integrations improving mobile application onboarding speeds by 40% and significantly lowering customer acquisition friction for virtual betting platforms.
- Strict regulatory implementations of responsible gaming transparency protocols have compelled operators to integrate automated monthly consumer financial invoicing systems enhancing digital user trust and supporting the sustained expansion of compliant interactive gaming portfolios.
- The integration of high-definition video streaming technologies inside traditional physical casino floors has enabled the creation of hybrid live-dealer matrices increasing user engagement rates by 28% and expanding the remote participation capabilities of modern digital sportsbooks.
Dive into Technavio’s robust research methodology, blending expert interviews, extensive data synthesis, and validated models for unparalleled US Online Gambling Market insights. See full methodology.
| Market Scope | |
|---|---|
| Page number | 188 |
| Base year | 2025 |
| Historic period | 2020-2024 |
| Forecast period | 2026-2030 |
| Growth momentum & CAGR | Accelerate at a CAGR of 10.5% |
| Market growth 2026-2030 | USD 9040.0 million |
| Market structure | Fragmented |
| YoY growth 2025-2026(%) | 9.3% |
| Key countries | US |
| Competitive landscape | Leading Companies, Market Positioning of Companies, Competitive Strategies, and Industry Risks |
Research Analyst Overview
- The digital wagering ecosystem is undergoing a profound structural transformation driven by the rapid adoption of decentralized architecture and sophisticated financial modeling. Boardroom executives are increasingly prioritizing the development of decentralized prediction markets and event-based contract trading platforms to diversify corporate revenue streams beyond traditional athletic outcomes.
- This strategic product expansion requires immense computational power and the integration of highly secure digital wallet tokenization to protect volatile consumer funds. By deploying advanced real-time micro-betting engines operators have increased in-game transaction speeds by 40% drastically improving real-time liability management.
- The implementation of robust algorithmic odds management allows risk assessment teams to adjust betting lines instantaneously preventing substantial financial exposure during unpredictable sporting events. Furthermore the integration of sophisticated fraud detection systems and biometric authentication gateways ensures that high-volume digital environments remain fully compliant with stringent state and federal financial regulations.
- These synchronized technological deployments empower enterprise operators to optimize their digital product portfolios secure long-term consumer trust and maintain strict operational resilience in a highly scrutinized regulatory landscape.
What are the Key Data Covered in this US Online Gambling Market Research and Growth Report?
-
What is the expected growth of the US Online Gambling Market between 2026 and 2030?
-
USD 9.04 billion, at a CAGR of 10.5%
-
-
What segmentation does the market report cover?
-
The report is segmented by End-user (Casual gamblers, Professional gamblers, and High-rollers), Type (Sports betting, Casino games, Poker, Bingo, and Lottery), Device (Desktop, and Mobile) and Geography (North America)
-
-
Which regions are analyzed in the report?
-
North America
-
-
What are the key growth drivers and market challenges?
-
Expansive legislative state legalization efforts create new regulated regional gaming territories, Rising state regulatory tax rate hikes compel sportsbook operators restructure financial budgets
-
-
Who are the major players in the US Online Gambling Market?
-
Ballys Corp., Bet365 Group Ltd., Betfred Group, BetMGM LLC, BetParx, Borgata Online, Caesars Digital, DraftKings Inc., Entain Plc, ESPN India, Fanatics Inc., FanDuel Inc., Hard Rock Digital, Mohegan, PlayStar, PointsBet Holdings Limited, Prime Sportsbook, Resorts Digital Gaming LLC, Rush Street Interactive Inc. and World Series of Poker
-
Market Research Insights
- The Online Gambling Market relies on highly secure technical architectures to facilitate massive transaction volumes and dynamic consumer interactions. By deploying robust application programming interfaces operators have improved live match synchronization speeds by 25% drastically enhancing the user experience during high-stakes sporting events.
- The integration of frictionless mobile interfaces has reduced user onboarding abandonment rates by 18% streamlining the transition from registration to active participation. Furthermore instantaneous payment rails and sophisticated digital checkout integrations allow platforms to process financial withdrawals 40% faster than legacy systems.
- These measurable operational enhancements drive sustained engagement lower customer acquisition costs and ensure strict alignment with modern compliance standards across diverse regulatory jurisdictions.
We can help! Our analysts can customize this us online gambling market research report to meet your requirements.
 RIA -

