US Onshore Drilling Fluid Market by Product Type, Method and Type - Forecast and Analysis 2024-2028

US Onshore Drilling Fluid Market by Product Type, Method and Type - Forecast and Analysis 2024-2028

Published: Mar 2024 145 Pages SKU: IRTNTR77760

Market Overview at a Glance

$401.08 Mn
Market Opportunity
4.45%
CAGR
4.25
YoY growth 2023-2024(%)

US Onshore Drilling Fluid Market Size 2024-2028 

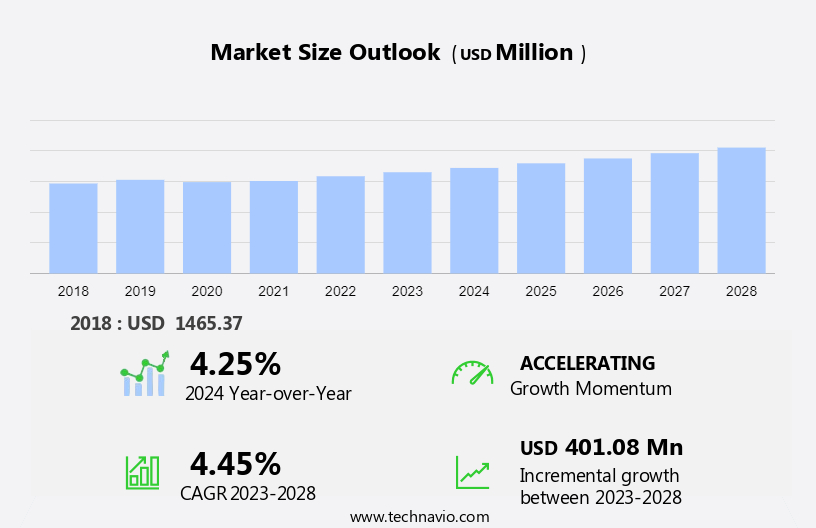
The US onshore drilling fluid market size is forecast to increase by USD 401.08 million at a CAGR of 4.45% between 2023 and 2028.

  • In the US onshore drilling fluid market, the demand for sustainable drilling fluids is on the rise due to growing concerns over environmental hazards posed by single-use plastics, such as plastic bottles, in the oil and gas industry. This trend is driven by increasing awareness and regulations, including those related to BPA-free materials and recycled materials. The market is also influenced by the popularity of reusable water bottles and kitchenware, which are becoming preferred choices for picnics and other outdoor activities.
  • Additionally, stringent regulatory frameworks continue to shape the market, with a focus on secure materials that minimize the risk of contamination and ensure the safety of workers and the environment. The onshore drilling fluid market in the US is expected to experience steady growth, driven by these trends and the need for sustainable and secure drilling solutions.

What will be the Size of the Market During the Forecast Period?

Onshore Drilling Fluid Market in US Size

 Request Free Sample

  • The onshore drilling fluid market in the US is a critical component of the oil and gas industry, supplying fluids that enable efficient and safe drilling operations. This market is influenced by various market dynamics and trends, which are shaping its growth and development. Firstly, the market is experiencing increasing price pressure due to the volatile nature of crude oil prices and the need to reduce operational costs. Drilling fluid suppliers are responding to this trend by offering cost-effective solutions without compromising on performance. This is leading to the adoption of innovative technologies and the use of recycled fluids to minimize costs and reduce the environmental impact of drilling operations.
  • Another significant trend in the onshore drilling fluid market is the growing demand for eco-friendly and sustainable solutions. The increasing environmental awareness and the push towards a circular economy are driving this trend. Suppliers are responding by offering fluids made from biodegradable materials and implementing green initiatives to minimize the environmental footprint of their operations. Moreover, the market is witnessing a shift towards tech-savvy customers who demand advanced features and customized solutions. Drilling fluid suppliers are responding to this trend by offering water-based fluids with superior drilling performance and advanced additives that enhance drilling efficiency and reduce downtime.
  • Furthermore, the onshore drilling fluid market in the US is being influenced by the sustainable development goals (SDGs) and the push towards responsible consumption and climate change mitigation. Suppliers are responding by offering fluids that reduce water consumption, minimize waste, and have a lower carbon footprint. In addition, there is a growing trend towards urban greening and community gardening, which is driving the demand for sustainable agriculture practices. This trend is leading to an increased focus on the use of onshore drilling fluids that are free from harmful chemicals and do not pose a risk to groundwater resources.
  • Lastly, the onshore drilling fluid market in the US is being shaped by the growing demand for renewable energy and green technology. Drilling fluid suppliers are responding to this trend by offering fluids that are compatible with renewable energy sources and have a lower environmental impact. Thus, the onshore drilling fluid market in the US is a dynamic and evolving market, influenced by various market trends and dynamics. Suppliers are responding to these trends by offering cost-effective, eco-friendly, and sustainable solutions that meet the evolving needs of their customers. The market is expected to continue growing, driven by the increasing demand for oil and gas and the push towards a more sustainable and responsible energy industry.

How is this market segmented and which is the largest segment?

The market research report provides comprehensive data (region-wise segment analysis), with forecasts and estimates in "USD million" for the period 2024-2028, as well as historical data from 2018-2022 for the following segments.
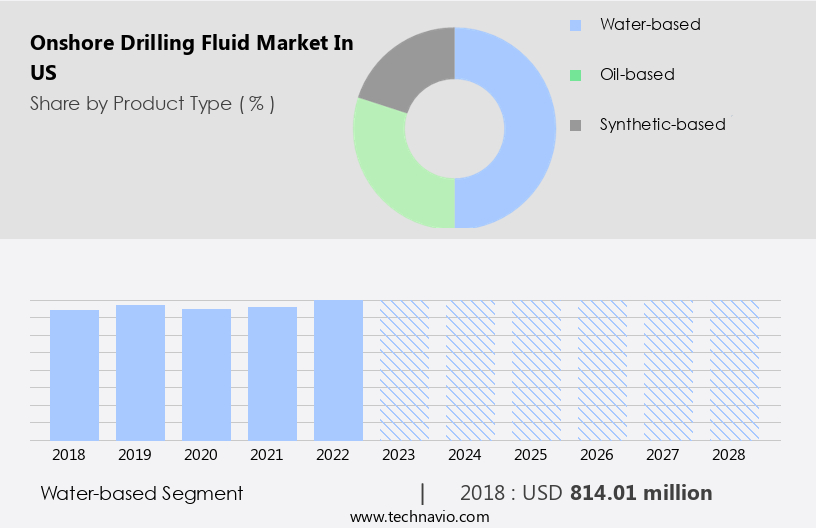
  • Product Type
    • Water-based
    • Oil-based
    • Synthetic-based
  • Method
    • HPHT
    • Conventional
  • Type
    • Permian
    • Eagle Ford
    • Niobrara
    • Others
  • Geography
    • US

By Product Type Insights

  • The water-based segment is estimated to witness significant growth during the forecast period.

In the US onshore drilling market, water-based drilling fluids have gained significant traction due to their eco-friendly properties. These fluids, primarily composed of water, offer several advantages over oil- or synthetic-based alternatives. One of the primary reasons for their popularity is their minimal carbon footprint. Unlike their oil-based counterparts, water-based drilling fluids are less toxic and simpler to dispose of, aligning with the oil and gas industry's growing commitment to sustainability. Moreover, water-based drilling fluids are compatible with sensitive formations, reducing the risk of damaging reservoir rock and enhancing overall drilling efficiency. This is crucial for preserving the environment, especially in areas with high ecological significance, such as public trails, drinking water fountains, and outdoor recreation sites.

Additionally, as the trend towards eco-friendly practices continues, single-use plastic bottles and other non-biodegradable materials are being phased out in favor of reusable drinkware made of metal, glass, and other sustainable materials. This single-use plastic ban is not only beneficial for the environment but also for the onshore drilling industry, as water-based drilling fluids contribute less to landfill waste. Thus, water-based onshore drilling fluids are a smart and sustainable choice for the US drilling market. They offer numerous benefits, including a reduced carbon footprint, compatibility with sensitive formations, and alignment with eco-friendly practices, making them a preferred option for operators seeking to minimize their environmental impact.

Onshore Drilling Fluid Market in US Size

Get a glance at the market share of various segments Request Free Sample

The water-based segment was valued at  USD 814.01 million in 2018 and showed a gradual increase during the forecast period.

Market Dynamics

Our researchers analyzed the data with 2023 as the base year, along with the key drivers, trends, and challenges. A holistic analysis of drivers will help companies refine their marketing strategies to gain a competitive advantage.

What are the key market drivers leading to the rise in adoption of US Onshore Drilling Fluid Market?

Growth in demand for oil and natural gas is the key driver of the market.

  • The Onshore Drilling Fluid Market in the US is experiencing significant growth due to the increasing demand for oil and gas, with the Energy Information Administration (EIA) predicting a rise in global liquid fuel consumption by 1.4 million b/d by the end of 2024 and 1.3 million b/d by 2025, primarily in non-OECD Asian countries. In response, there is a growing need to explore and develop new oil and gas reservoirs in the US. Onshore drilling fluid market participants face fierce competition, requiring high-quality, durable, and customized solutions to meet the demands of drilling operations. Technical developments, such as insulation technologies, temperature management, and pattern recognition, are essential to maintain profit margins and meet stringent regulatory frameworks.
  • Similarly, raw materials, such as recycled plastic, are increasingly being used to create eco-friendly, reusable bottles, aligning with consumers' growing preference for sustainability and hygienic practices. Built-in straws, self-cleaning bottles, and bluetooth connectivity are additional features that cater to the lifestyle changes and outdoor activities of the US population. The market is also influenced by factors such as the plastic problem, single-use plastic bans, and environmental-friendly manufacturing practices. Quality standards, customization, and functionality are crucial in differentiating offerings and meeting the diverse needs of customers. Investments in shale gas and shale oil, as well as hydrogen sulfide and wellbore gasses, require specialized drilling muds and lubricant filtration systems to ensure safe and efficient drilling operations.
  • Consequently, capillary pressure, pH levels, and synthetic-based fluids are critical considerations in the development of these systems. As the market evolves, it is essential to address environmental hazards, such as hydrogen sulfide and ultra-deep water drilling, while maintaining a focus on sustainability, hygienic practices, and functionality. The use of BPA-free, reusable water bottles and eco-friendly alternatives to single-use plastic is becoming increasingly important for both consumers and governments. In summary, the Onshore Drilling Fluid Market in the US is a dynamic and evolving industry, driven by the need to meet the growing demand for oil and gas while addressing environmental concerns and maintaining profitability. Participants must focus on technical developments, sustainability, and customization to remain competitive and meet the diverse needs of their customers.

What are the market trends shaping the US Onshore Drilling Fluid Market?

The rise in demand for sustainable onshore drilling fluids is the upcoming trend in the market.

  • The onshore drilling fluid market in the US is experiencing a significant shift towards sustainable drilling fluid solutions. This trend is driven by a combination of factors, including stringent regulatory requirements and corporate social responsibility initiatives within the oil and gas industry. To meet these demands, market participants are developing drilling fluid formulations that minimize environmental impact. These eco-friendly alternatives address concerns related to groundwater contamination, plastic waste, and carbon footprint. Historically, drilling operations relied on oil-based fluids, which have been linked to environmental hazards such as hydrogen sulfide and wellbore gasses. However, technological advancements have led to the emergence of synthetic-based and water-based fluids.
  • These new formulations offer improved lubrication, filtration, and temperature management capabilities, making them more effective and sustainable alternatives. Customization is another key trend in the onshore drilling fluid market, with customized alternatives catering to specific drilling conditions, such as pH levels, capillary pressure, and drilling mud properties. These customized solutions not only enhance functionality but also contribute to cost savings through improved efficiency and reduced waste. As consumers increasingly prioritize sustainability in their purchasing decisions, demand for reusable water bottles and other eco-friendly alternatives has grown. This trend extends to the onshore drilling fluid market, where the use of recycled materials, self-cleaning bottles, and built-in straws is becoming more common.
  • Additionally, durability and hygienic practices are essential considerations for both consumers and drilling operations, ensuring the long-term viability of these solutions. Competition in the onshore drilling fluid market is fierce, with key players investing in research and development to stay ahead. Technical developments, such as bluetooth connectivity and insulation technologies, are enhancing the functionality and performance of drilling fluids. Quality standards and sustainability are essential factors in the decision-making process for both buyers and regulators, ensuring that the market remains focused on delivering eco-friendly, high-performance solutions. In summary, the onshore drilling fluid market in the US is undergoing a transformation, driven by a growing focus on sustainability, stringent regulatory requirements, and evolving consumer preferences. This shift is leading to the development of innovative, eco-friendly drilling fluid solutions that offer improved performance, cost savings, and reduced environmental impact.

What challenges does US Onshore Drilling Fluid Market face during the growth?

Stringent government regulations is a key challenge affecting the market growth.

  • The Onshore Drilling Fluid Market in the US is influenced by various factors, including drilling activities, environmental regulations, and technological advancements. Drilling, well intervention, well completion, and production are integral parts of the oil and gas industry, with hydraulic fracturing and acidizing being notable completion methods. However, these processes can result in environmental concerns, such as the release of natural gases, chemicals, and groundwater contamination. To mitigate these issues, companies must adhere to stringent regulatory frameworks and invest in eco-friendly manufacturing practices. Reusable water bottles made from recycled plastic, for instance, have gained popularity due to their sustainability and hygienic benefits.
  • These bottles offer customization, durability, and built-in straws, making them suitable for outdoor activities and fitness applications. Technical developments in insulation technologies, temperature management, and patterned designs have further enhanced the functionality of reusable bottles. As lifestyle changes and urbanization continue, governments and organizations are promoting the use of non-disposable, environmentally-friendly alternatives to single-use plastic bottles. This shift is expected to impact various industries, including kitchenware, household products, and outdoor recreation. 
  • Moreover, the transition from oil-based fluids to synthetic-based drilling chemicals and lubricant filtration systems is improving drilling operations' efficiency and reducing environmental hazards. These advancements, coupled with the increasing focus on sustainability and hygienic practices, are shaping the future of the Onshore Drilling Fluid Market in the US.

Exclusive US Onshore Drilling Fluid Market Customer Landscape

The market forecasting report includes the adoption lifecycle of the market, market growth and forecasting, covering from the innovator's stage to the laggard's stage. It focuses on adoption rates in different regions based on penetration. Furthermore, the report also includes key purchase criteria and drivers of price sensitivity to help companies evaluate and develop their market growth analysis strategies.
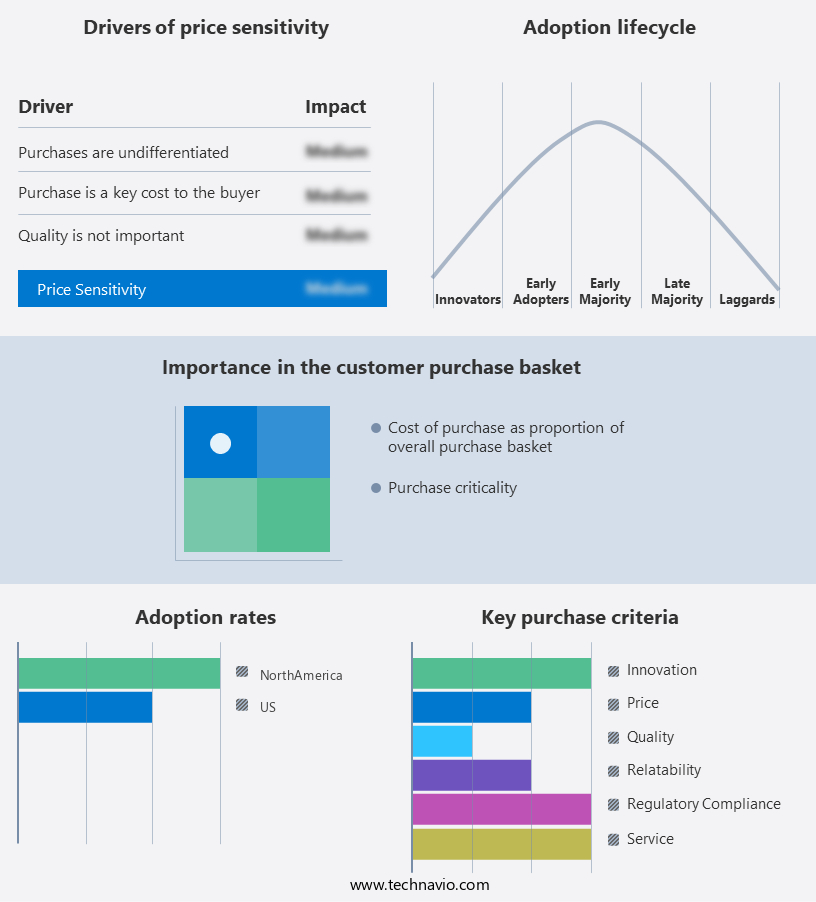
Onshore Drilling Fluid Market in US Share by Geography

 Customer Landscape

Key Companies & Market Insights

Companies are implementing various strategies, such as strategic alliances, market forecast partnerships, mergers and acquisitions, geographical expansion, and product/service launches, to enhance their presence in the market.

The market research and growth report includes detailed analyses of the competitive landscape of the market and information about key companies, including:

  • Active Minerals International LLC
  • Baker Hughes Co.
  • CES Energy Solutions Corp.
  • Chevron Phillips Chemical Co. LLC
  • Diversity Technologies Corp.
  • Economy Polymers and Chemicals
  • FDF Energy
  • Global Drilling Fluids and Chemicals Ltd.
  • Gumpro Drilling Fluids
  • Halliburton Co.
  • HMC Fluids and Engineering
  • Imdex Ltd.
  • Impact Fluid Solutions
  • MATRIX Construction Products LLC
  • Newpark Resources Inc.
  • NOV Inc.
  • Quaker Chemical Corp.
  • Schlumberger Ltd.
  • SUPREME DRILLING FLUID CHEMICALS
  • Weatherford International Plc
  • China Petroleum and Chemical Corp.

Qualitative and quantitative analysis of companies has been conducted to help clients understand the wider business environment as well as the strengths and weaknesses of key market players. Data is qualitatively analyzed to categorize companies as pure play, category-focused, industry-focused, and diversified; it is quantitatively analyzed to categorize companies as dominant, leading, strong, tentative, and weak.

Research Analyst Overview

The onshore drilling fluid market in the US has a historical footprint of providing essential fluids for drilling operations. These fluids play a crucial role in ensuring the efficiency and durability of drilling processes. The market is characterized by fierce player competitions, driven by profit margins and a sense of ownership among key players. Technical developments and sustainability are at the forefront of the industry. Customers seek reusable water bottles for outdoor activities and fitness applications, prioritizing functionality, insulation technologies, and temperature management. Customized alternatives, such as self-cleaning bottles with built-in straws, cater to personal preferences. Environmental concerns are increasingly important, with a focus on eco-friendly manufacturing, recycled plastic, and BPA-free materials.

Similarly, stringent regulatory frameworks aim to reduce the environmental impact of single-use plastic bottles and promote the use of sustainable materials. The onshore drilling fluid market adapts to these trends, offering non-disposable, environmental-friendly alternatives to oil-based fluids. These solutions contribute to reducing carbon footprint and minimizing environmental hazards, aligning with the growing demand for sustainability. Governments and local green spaces encourage the use of reusable water bottles, addressing the plastic problem and promoting lifestyle changes. The industry responds by providing a wide range of options, from metal and glass to insulated bottles, catering to various customer needs and preferences.

Market Scope

Report Coverage

Details

Page number

145

Base year

2023

Historic period

2018-2022

Forecast period

2024-2028

Growth momentum & CAGR

Accelerate at a CAGR of 4.45%

Market growth 2024-2028

USD 401.08 million

Market structure

Fragmented

YoY growth 2023-2024(%)

4.25

Competitive landscape

Leading Companies, Market Positioning of Companies, Competitive Strategies, and Industry Risks

Request Free Sample

What are the Key Data Covered in this Market Report?

  • CAGR of the market during the forecast period
  • Detailed information on factors that will drive the market growth and forecasting between 2024 and 2028
  • Precise estimation of the size of the market  and its contribution of the market in focus to the parent market
  • Accurate predictions about upcoming market growth and trends and changes in consumer behaviour
  • Growth of the market across US
  • Thorough analysis of the market's competitive landscape and detailed information about companies
  • Comprehensive analysis of factors that will challenge the growth of market companies

We can help! Our analysts can customize this market research report to meet your requirements Get in touch

1 Executive Summary

  • 1.1 Market overview
    • Exhibit 01: Executive Summary – Chart on Market Overview
    • Exhibit 02: Executive Summary – Data Table on Market Overview
    • Exhibit 03: Executive Summary – Chart on Country Market Characteristics
    • Exhibit 04: Executive Summary – Chart on Market Segmentation by Product Type
    • Exhibit 05: Executive Summary – Chart on Market Segmentation by Method
    • Exhibit 06: Executive Summary – Chart on Market Segmentation by Type
    • Exhibit 07: Executive Summary – Chart on Vendor Market Positioning

2 Market Landscape

  • 2.1 Market ecosystem
    • Exhibit 08: Parent market
    • Exhibit 09: Market Characteristics

3 Market Sizing

  • 3.1 Market definition
    • Exhibit 10: Offerings of vendors included in the market definition
  • 3.2 Market segment analysis
    • Exhibit 11: Market segments
  • 3.3 Market size 2023
    • 3.4 Market outlook: Forecast for 2023-2028
      • Exhibit 12: Chart on US - Market size and forecast 2023-2028 ($ million)
      • Exhibit 13: Data Table on US - Market size and forecast 2023-2028 ($ million)
      • Exhibit 14: Chart on US: Year-over-year growth 2023-2028 (%)
      • Exhibit 15: Data Table on US: Year-over-year growth 2023-2028 (%)

    4 Historic Market Size

    • 4.1 Onshore drilling fluid market in US 2018 - 2022
      • Exhibit 16: Historic Market Size – Data Table on onshore drilling fluid market in US 2018 - 2022 ($ million)
    • 4.2 Product Type Segment Analysis 2018 - 2022
      • Exhibit 17: Historic Market Size – Product Type Segment 2018 - 2022 ($ million)
    • 4.3 Method Segment Analysis 2018 - 2022
      • Exhibit 18: Historic Market Size – Method Segment 2018 - 2022 ($ million)
    • 4.4 Type Segment Analysis 2018 - 2022
      • Exhibit 19: Historic Market Size – Type Segment 2018 - 2022 ($ million)

    5 Five Forces Analysis

    • 5.1 Five forces summary
      • Exhibit 20: Five forces analysis - Comparison between 2023 and 2028
    • 5.2 Bargaining power of buyers
      • Exhibit 21: Chart on Bargaining power of buyers – Impact of key factors 2023 and 2028
    • 5.3 Bargaining power of suppliers
      • Exhibit 22: Bargaining power of suppliers – Impact of key factors in 2023 and 2028
    • 5.4 Threat of new entrants
      • Exhibit 23: Threat of new entrants – Impact of key factors in 2023 and 2028
    • 5.5 Threat of substitutes
      • Exhibit 24: Threat of substitutes – Impact of key factors in 2023 and 2028
    • 5.6 Threat of rivalry
      • Exhibit 25: Threat of rivalry – Impact of key factors in 2023 and 2028
    • 5.7 Market condition
      • Exhibit 26: Chart on Market condition - Five forces 2023 and 2028

    6 Market Segmentation by Product Type

    • 6.1 Market segments
      • Exhibit 27: Chart on Product Type - Market share 2023-2028 (%)
      • Exhibit 28: Data Table on Product Type - Market share 2023-2028 (%)
    • 6.2 Comparison by Product Type
      • Exhibit 29: Chart on Comparison by Product Type
      • Exhibit 30: Data Table on Comparison by Product Type
    • 6.3 Water-based - Market size and forecast 2023-2028
      • Exhibit 31: Chart on Water-based - Market size and forecast 2023-2028 ($ million)
      • Exhibit 32: Data Table on Water-based - Market size and forecast 2023-2028 ($ million)
      • Exhibit 33: Chart on Water-based - Year-over-year growth 2023-2028 (%)
      • Exhibit 34: Data Table on Water-based - Year-over-year growth 2023-2028 (%)
    • 6.4 Oil-based - Market size and forecast 2023-2028
      • Exhibit 35: Chart on Oil-based - Market size and forecast 2023-2028 ($ million)
      • Exhibit 36: Data Table on Oil-based - Market size and forecast 2023-2028 ($ million)
      • Exhibit 37: Chart on Oil-based - Year-over-year growth 2023-2028 (%)
      • Exhibit 38: Data Table on Oil-based - Year-over-year growth 2023-2028 (%)
    • 6.5 Synthetic-based - Market size and forecast 2023-2028
      • Exhibit 39: Chart on Synthetic-based - Market size and forecast 2023-2028 ($ million)
      • Exhibit 40: Data Table on Synthetic-based - Market size and forecast 2023-2028 ($ million)
      • Exhibit 41: Chart on Synthetic-based - Year-over-year growth 2023-2028 (%)
      • Exhibit 42: Data Table on Synthetic-based - Year-over-year growth 2023-2028 (%)
    • 6.6 Market opportunity by Product Type
      • Exhibit 43: Market opportunity by Product Type ($ million)
      • Exhibit 44: Data Table on Market opportunity by Product Type ($ million)

    7 Market Segmentation by Method

    • 7.1 Market segments
      • Exhibit 45: Chart on Method - Market share 2023-2028 (%)
      • Exhibit 46: Data Table on Method - Market share 2023-2028 (%)
    • 7.2 Comparison by Method
      • Exhibit 47: Chart on Comparison by Method
      • Exhibit 48: Data Table on Comparison by Method
    • 7.3 HPHT - Market size and forecast 2023-2028
      • Exhibit 49: Chart on HPHT - Market size and forecast 2023-2028 ($ million)
      • Exhibit 50: Data Table on HPHT - Market size and forecast 2023-2028 ($ million)
      • Exhibit 51: Chart on HPHT - Year-over-year growth 2023-2028 (%)
      • Exhibit 52: Data Table on HPHT - Year-over-year growth 2023-2028 (%)
    • 7.4 Conventional - Market size and forecast 2023-2028
      • Exhibit 53: Chart on Conventional - Market size and forecast 2023-2028 ($ million)
      • Exhibit 54: Data Table on Conventional - Market size and forecast 2023-2028 ($ million)
      • Exhibit 55: Chart on Conventional - Year-over-year growth 2023-2028 (%)
      • Exhibit 56: Data Table on Conventional - Year-over-year growth 2023-2028 (%)
    • 7.5 Market opportunity by Method
      • Exhibit 57: Market opportunity by Method ($ million)
      • Exhibit 58: Data Table on Market opportunity by Method ($ million)

    8 Market Segmentation by Type

    • 8.1 Market segments
      • Exhibit 59: Chart on Type - Market share 2023-2028 (%)
      • Exhibit 60: Data Table on Type - Market share 2023-2028 (%)
    • 8.2 Comparison by Type
      • Exhibit 61: Chart on Comparison by Type
      • Exhibit 62: Data Table on Comparison by Type
    • 8.3 Permian - Market size and forecast 2023-2028
      • Exhibit 63: Chart on Permian - Market size and forecast 2023-2028 ($ million)
      • Exhibit 64: Data Table on Permian - Market size and forecast 2023-2028 ($ million)
      • Exhibit 65: Chart on Permian - Year-over-year growth 2023-2028 (%)
      • Exhibit 66: Data Table on Permian - Year-over-year growth 2023-2028 (%)
    • 8.4 Eagle Ford - Market size and forecast 2023-2028
      • Exhibit 67: Chart on Eagle Ford - Market size and forecast 2023-2028 ($ million)
      • Exhibit 68: Data Table on Eagle Ford - Market size and forecast 2023-2028 ($ million)
      • Exhibit 69: Chart on Eagle Ford - Year-over-year growth 2023-2028 (%)
      • Exhibit 70: Data Table on Eagle Ford - Year-over-year growth 2023-2028 (%)
    • 8.5 Niobrara - Market size and forecast 2023-2028
      • Exhibit 71: Chart on Niobrara - Market size and forecast 2023-2028 ($ million)
      • Exhibit 72: Data Table on Niobrara - Market size and forecast 2023-2028 ($ million)
      • Exhibit 73: Chart on Niobrara - Year-over-year growth 2023-2028 (%)
      • Exhibit 74: Data Table on Niobrara - Year-over-year growth 2023-2028 (%)
    • 8.6 Others - Market size and forecast 2023-2028
      • Exhibit 75: Chart on Others - Market size and forecast 2023-2028 ($ million)
      • Exhibit 76: Data Table on Others - Market size and forecast 2023-2028 ($ million)
      • Exhibit 77: Chart on Others - Year-over-year growth 2023-2028 (%)
      • Exhibit 78: Data Table on Others - Year-over-year growth 2023-2028 (%)
    • 8.7 Market opportunity by Type
      • Exhibit 79: Market opportunity by Type ($ million)
      • Exhibit 80: Data Table on Market opportunity by Type ($ million)

    9 Customer Landscape

    • 9.1 Customer landscape overview
      • Exhibit 81: Analysis of price sensitivity, lifecycle, customer purchase basket, adoption rates, and purchase criteria

    10 Drivers, Challenges, and Trends

    • 10.1 Market drivers
      • 10.2 Market challenges
        • 10.3 Impact of drivers and challenges
          • Exhibit 82: Impact of drivers and challenges in 2023 and 2028
        • 10.4 Market trends

          11 Vendor Landscape

          • 11.1 Overview
            • 11.2 Vendor landscape
              • Exhibit 83: Overview on Criticality of inputs and Factors of differentiation
            • 11.3 Landscape disruption
              • Exhibit 84: Overview on factors of disruption
            • 11.4 Industry risks
              • Exhibit 85: Impact of key risks on business

            12 Vendor Analysis

            • 12.1 Vendors covered
              • Exhibit 86: Vendors covered
            • 12.2 Market positioning of vendors
              • Exhibit 87: Matrix on vendor position and classification
            • 12.3 Active Minerals International LLC
              • Exhibit 88: Active Minerals International LLC - Overview
              • Exhibit 89: Active Minerals International LLC - Product / Service
              • Exhibit 90: Active Minerals International LLC - Key offerings
            • 12.4 Baker Hughes Co.
              • Exhibit 91: Baker Hughes Co. - Overview
              • Exhibit 92: Baker Hughes Co. - Business segments
              • Exhibit 93: Baker Hughes Co. - Key news
              • Exhibit 94: Baker Hughes Co. - Key offerings
              • Exhibit 95: Baker Hughes Co. - Segment focus
            • 12.5 CES Energy Solutions Corp.
              • Exhibit 96: CES Energy Solutions Corp. - Overview
              • Exhibit 97: CES Energy Solutions Corp. - Product / Service
              • Exhibit 98: CES Energy Solutions Corp. - Key offerings
            • 12.6 Chevron Phillips Chemical Co. LLC
              • Exhibit 99: Chevron Phillips Chemical Co. LLC - Overview
              • Exhibit 100: Chevron Phillips Chemical Co. LLC - Product / Service
              • Exhibit 101: Chevron Phillips Chemical Co. LLC - Key news
              • Exhibit 102: Chevron Phillips Chemical Co. LLC - Key offerings
            • 12.7 China Petroleum and Chemical Corp.
              • Exhibit 103: China Petroleum and Chemical Corp. - Overview
              • Exhibit 104: China Petroleum and Chemical Corp. - Business segments
              • Exhibit 105: China Petroleum and Chemical Corp. - Key news
              • Exhibit 106: China Petroleum and Chemical Corp. - Key offerings
              • Exhibit 107: China Petroleum and Chemical Corp. - Segment focus
            • 12.8 FDF Energy
              • Exhibit 108: FDF Energy - Overview
              • Exhibit 109: FDF Energy - Product / Service
              • Exhibit 110: FDF Energy - Key offerings
            • 12.9 Global Drilling Fluids and Chemicals Ltd.
              • Exhibit 111: Global Drilling Fluids and Chemicals Ltd. - Overview
              • Exhibit 112: Global Drilling Fluids and Chemicals Ltd. - Product / Service
              • Exhibit 113: Global Drilling Fluids and Chemicals Ltd. - Key offerings
            • 12.10 Gumpro Drilling Fluids
              • Exhibit 114: Gumpro Drilling Fluids - Overview
              • Exhibit 115: Gumpro Drilling Fluids - Product / Service
              • Exhibit 116: Gumpro Drilling Fluids - Key offerings
            • 12.11 HMC Fluids and Engineering
              • Exhibit 117: HMC Fluids and Engineering - Overview
              • Exhibit 118: HMC Fluids and Engineering - Product / Service
              • Exhibit 119: HMC Fluids and Engineering - Key offerings
            • 12.12 Imdex Ltd.
              • Exhibit 120: Imdex Ltd. - Overview
              • Exhibit 121: Imdex Ltd. - Business segments
              • Exhibit 122: Imdex Ltd. - Key news
              • Exhibit 123: Imdex Ltd. - Key offerings
              • Exhibit 124: Imdex Ltd. - Segment focus
            • 12.13 Newpark Resources Inc.
              • Exhibit 125: Newpark Resources Inc. - Overview
              • Exhibit 126: Newpark Resources Inc. - Business segments
              • Exhibit 127: Newpark Resources Inc. - Key offerings
              • Exhibit 128: Newpark Resources Inc. - Segment focus
            • 12.14 NOV Inc.
              • Exhibit 129: NOV Inc. - Overview
              • Exhibit 130: NOV Inc. - Business segments
              • Exhibit 131: NOV Inc. - Key news
              • Exhibit 132: NOV Inc. - Key offerings
              • Exhibit 133: NOV Inc. - Segment focus
            • 12.15 Schlumberger Ltd.
              • Exhibit 134: Schlumberger Ltd. - Overview
              • Exhibit 135: Schlumberger Ltd. - Business segments
              • Exhibit 136: Schlumberger Ltd. - Key news
              • Exhibit 137: Schlumberger Ltd. - Key offerings
              • Exhibit 138: Schlumberger Ltd. - Segment focus
            • 12.16 SUPREME DRILLING FLUID CHEMICALS
              • Exhibit 139: SUPREME DRILLING FLUID CHEMICALS - Overview
              • Exhibit 140: SUPREME DRILLING FLUID CHEMICALS - Product / Service
              • Exhibit 141: SUPREME DRILLING FLUID CHEMICALS - Key offerings
            • 12.17 Weatherford International Plc
              • Exhibit 142: Weatherford International Plc - Overview
              • Exhibit 143: Weatherford International Plc - Business segments
              • Exhibit 144: Weatherford International Plc - Key news
              • Exhibit 145: Weatherford International Plc - Key offerings
              • Exhibit 146: Weatherford International Plc - Segment focus

            13 Appendix

            • 13.1 Scope of the report
              • 13.2 Inclusions and exclusions checklist
                • Exhibit 147: Inclusions checklist
                • Exhibit 148: Exclusions checklist
              • 13.3 Currency conversion rates for US$
                • Exhibit 149: Currency conversion rates for US$
              • 13.4 Research methodology
                • Exhibit 150: Research methodology
                • Exhibit 151: Validation techniques employed for market sizing
                • Exhibit 152: Information sources
              • 13.5 List of abbreviations
                • Exhibit 153: List of abbreviations

              Research Methodology

              Technavio presents a detailed picture of the market by way of study, synthesis, and summation of data from multiple sources. The analysts have presented the various facets of the market with a particular focus on identifying the key industry influencers. The data thus presented is comprehensive, reliable, and the result of extensive research, both primary and secondary.

              INFORMATION SOURCES

              Primary sources

              • Manufacturers and suppliers
              • Channel partners
              • Industry experts
              • Strategic decision makers

              Secondary sources

              • Industry journals and periodicals
              • Government data
              • Financial reports of key industry players
              • Historical data
              • Press releases

              DATA ANALYSIS

              Data Synthesis

              • Collation of data
              • Estimation of key figures
              • Analysis of derived insights

              Data Validation

              • Triangulation with data models
              • Reference against proprietary databases
              • Corroboration with industry experts

              REPORT WRITING

              Qualitative

              • Market drivers
              • Market challenges
              • Market trends
              • Five forces analysis

              Quantitative

              • Market size and forecast
              • Market segmentation
              • Geographical insights
              • Competitive landscape

              Interested in this report?

              Get your sample now to see our research methodology and insights!

              Download Now

              Frequently Asked Questions

              Onshore Drilling Fluidin US market growth will increase by $ 401.08 mn during 2024-2028 .

              The Onshore Drilling Fluidin US market is expected to grow at a CAGR of 4.45% during 2024-2028 .

              Onshore Drilling Fluidin US market is segmented by Product Type( Water-based, Oil-based, Synthetic-based) Method( HPHT, Conventional) Type( Permian, Eagle Ford, Niobrara, Others)

              Active Minerals International LLC, Baker Hughes Co., CES Energy Solutions Corp., Chevron Phillips Chemical Co. LLC, Diversity Technologies Corp., Economy Polymers and Chemicals, FDF Energy, Global Drilling Fluids and Chemicals Ltd., Gumpro Drilling Fluids, Halliburton Co., HMC Fluids and Engineering, Imdex Ltd., Impact Fluid Solutions, MATRIX Construction Products LLC, Newpark Resources Inc., NOV Inc., Quaker Chemical Corp., Schlumberger Ltd., SUPREME DRILLING FLUID CHEMICALS, Weatherford International Plc, China Petroleum and Chemical Corp. are a few of the key vendors in the Onshore Drilling Fluidin US market.

              North America will register the highest growth rate of 100% among the other regions. Therefore, the Onshore Drilling Fluidin US market in North America is expected to garner significant business opportunities for the vendors during the forecast period.

              US, NorthAmerica

              • Growth in demand for oil and natural gasThe US Energy Information Administration (EIA) predicts that global liquid fuel consumption will rise by 1.4 million b/d by the end of 2024 and 1.3 million b/d by 2025. The majority of the expected growth in liquid fuel demand is in non-OECD Asian countries is the driving factor this market.
              • led by China and India is the driving factor this market.
              • where consumption will increase by 0.6 million b/d at the end of 2024 and by 0.5 million b/d in 2025. In the OECD countries is the driving factor this market.
              • liquid fuel consumption is expected to remain relatively flat in 2024 and 2025. As the demand for oil and gas grows is the driving factor this market.
              • there is a need to explore and develop new oil and gas reservoirs in the US. The rising demand for oil and natural gas necessitates greater exploration and production efforts. Onshore drilling is an important part of these activities because it allows access to existing reserves and the exploration of new ones. The onshore drilling fluid market in US is directly proportional to the level of drilling activity. Growing demand for drilling fluids frequently drives technological advancements in the oil and gas industry. As exploration and production companies strive to extract hydrocarbons more efficiently is the driving factor this market.
              • the demand for advanced drilling fluids increases. Innovative drilling fluid formulations are being developed to address the challenges of drilling in various types of geological formations is the driving factor this market.
              • including those with HPHT conditions. Thus is the driving factor this market.
              • the rising demand for oil and gas will increase drilling activities in onshore locations is the driving factor this market.
              • driving the growth of the onshore drilling fluid market in US. The growth in demand for oil and natural gas fuels increased onshore drilling activity in the US. This is the driving factor this market.
              • in turn is the driving factor this market.
              • propels the demand for specialized onshore drilling fluids during the forecast period. is the driving factor this market.

              The Onshore Drilling Fluidin US market vendors should focus on grabbing business opportunities from the Water-based segment as it accounted for the largest market share in the base year.