Open-angle Glaucoma Therapeutics Market Analysis, Size, and Forecast 2026-2030: North America (US, Canada, and Mexico), Europe (Germany, UK, and France), APAC (China, Japan, and India), Middle East and Africa (UAE, South Africa, and Saudi Arabia), South America (Brazil), Asia, Rest of World (ROW)

Open-angle Glaucoma Therapeutics Market Analysis, Size, and Forecast 2026-2030:
North America (US, Canada, and Mexico), Europe (Germany, UK, and France), APAC (China, Japan, and India), Middle East and Africa (UAE, South Africa, and Saudi Arabia), South America (Brazil), Asia, Rest of World (ROW)

Published: Dec 2025 275 Pages SKU: IRTNTR74217

Market Overview at a Glance

$3.07 B
Market Opportunity
6.9%
CAGR 2025 - 2030
51.5%
North America Growth
$3.93 B
PGAs segment 2024

Open-angle Glaucoma Therapeutics Market Size 2026-2030

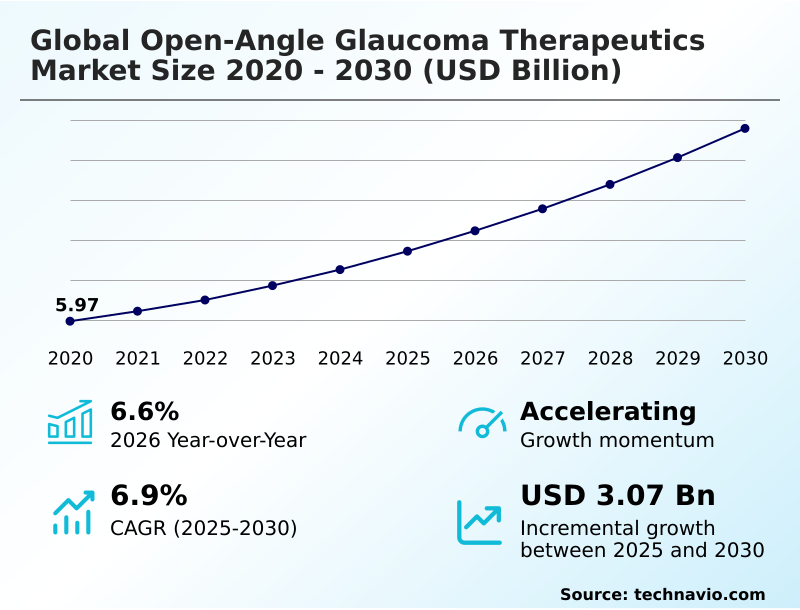
The open-angle glaucoma therapeutics market size is valued to increase by USD 3.07 billion, at a CAGR of 6.9% from 2025 to 2030. Promising pipeline and recent approvals for glaucoma therapeutics will drive the open-angle glaucoma therapeutics market.

Major Market Trends & Insights

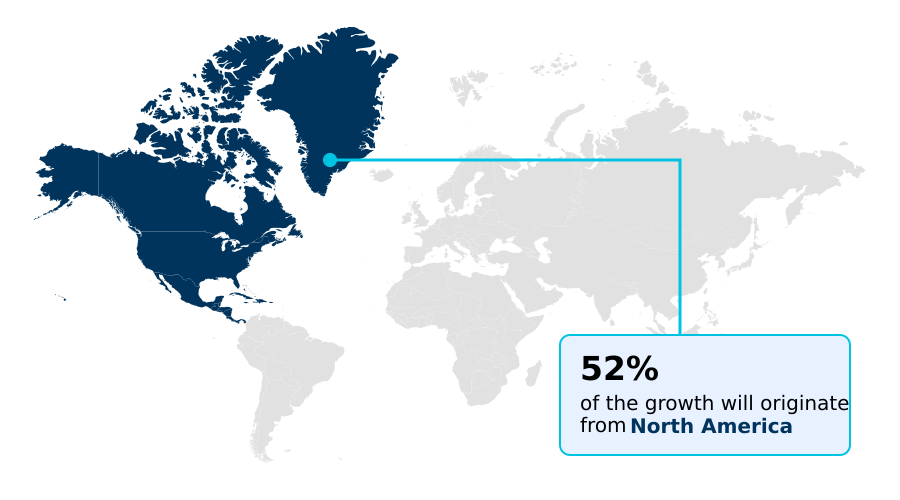
  • North America dominated the market and accounted for a 51.5% growth during the forecast period.
  • By Product - PGAs segment was valued at USD 3.93 billion in 2024
  • By Channel - Hospital pharmacy segment accounted for the largest market revenue share in 2024

Market Size & Forecast

  • Market Opportunities: USD 4.82 billion
  • Market Future Opportunities: USD 3.07 billion
  • CAGR from 2025 to 2030 : 6.9%

Market Summary

  • The open-angle glaucoma therapeutics market is defined by a persistent need to manage intraocular pressure and prevent irreversible optic nerve damage. Growth is underpinned by a rising geriatric population and increasing disease prevalence, which drives demand for more effective and convenient treatments.
  • Key trends include the development of fixed-dose combination drugs that simplify treatment regimens and the emergence of sustained-release drug delivery systems, which significantly improve patient treatment adherence. For instance, a key operational challenge is ensuring the cold-chain integrity for biologic therapies, requiring specialized logistics to maintain efficacy from manufacturing to administration.
  • Innovations in neuroprotective agents and gene therapy offer future potential, aiming to preserve retinal ganglion cells beyond simply lowering pressure. However, the high cost of these advanced treatments and complex regulatory approval processes remain significant hurdles.
  • The competitive environment encourages a focus on therapies with differentiated safety profiles and those that address unmet needs in refractory glaucoma cases, pushing the evolution of care standards.

What will be the Size of the Open-angle Glaucoma Therapeutics Market during the forecast period?

Get Key Insights on Market Forecast (PDF) Request Free Sample

How is the Open-angle Glaucoma Therapeutics Market Segmented?

The open-angle glaucoma therapeutics industry research report provides comprehensive data (region-wise segment analysis), with forecasts and estimates in "USD million" for the period 2026-2030, as well as historical data from 2020-2024 for the following segments.

  • Product
    • PGAs
    • Non PGAs
  • Channel
    • Hospital pharmacy
    • Retail pharmacy
    • Online pharmacy
  • Route of administration
    • Topical
    • Oral
    • Injectable
  • Geography
    • North America
      • US
      • Canada
      • Mexico
    • Europe
      • Germany
      • UK
      • France
    • Asia
    • Rest of World (ROW)

By Product Insights

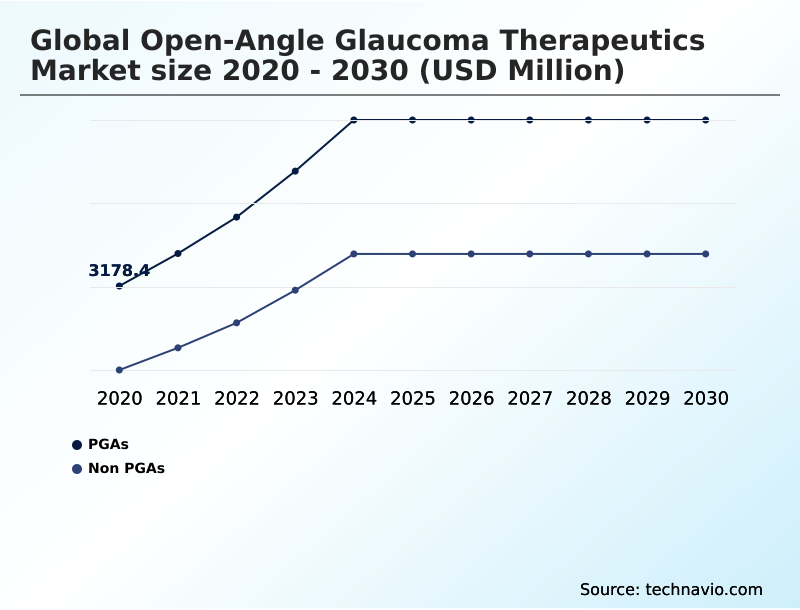
The pgas segment is estimated to witness significant growth during the forecast period.

The market for open-angle glaucoma therapeutics is segmented by product, with prostaglandin analogs (PGAs) and non-PGAs representing the primary categories. PGAs are a cornerstone of pharmacologic therapy, primarily functioning to enhance aqueous humor outflow and support intraocular pressure management.

Innovations within this segment are geared toward improving patient treatment adherence through formulations that minimize ocular surface disease.

For instance, the development of preservative-free eye drops addresses common side effects, with some new formulations demonstrating a 20% reduction in patient-reported irritation.

As the field advances, there is a focus on multi-target drug regimens and sustained-release drug delivery to simplify complex treatment protocols, reinforcing the segment's role in long-term visual field preservation and retinal ganglion cell protection.

Request Free Sample

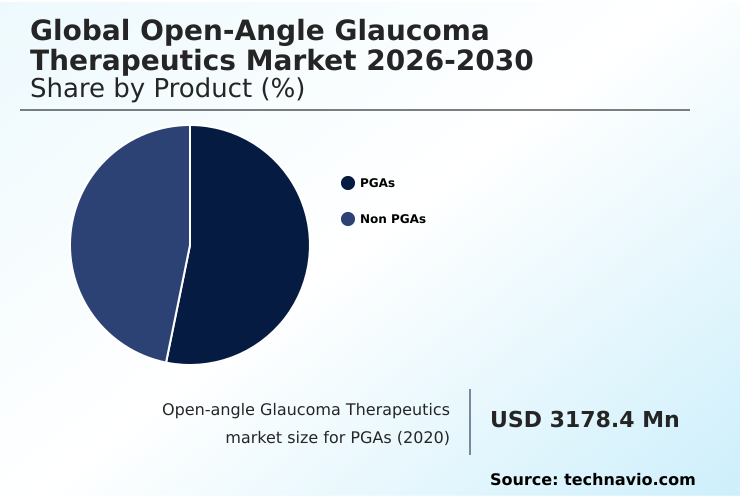
The PGAs segment was valued at USD 3.93 billion in 2024 and showed a gradual increase during the forecast period.

Request Free Sample

Regional Analysis

North America is estimated to contribute 51.5% to the growth of the global market during the forecast period.Technavio’s analysts have elaborately explained the regional trends and drivers that shape the market during the forecast period.

See How Open-angle Glaucoma Therapeutics Market Demand is Rising in North America Request Free Sample

The geographic landscape of the open-angle glaucoma therapeutics market is characterized by strong performance in developed regions and high growth potential in emerging markets.

North America currently dominates, contributing approximately 51.5% of the market's incremental growth, driven by advanced ophthalmic care infrastructure, high disease awareness, and favorable reimbursement for therapies focused on IOP fluctuation control.

Europe follows, with a steady expansion supported by its aging population. The Asia region is projected to exhibit the highest growth rate at 7.8%, fueled by improving healthcare access, rising incomes, and a growing focus on early disease detection.

This regional expansion requires robust patient support programs and pharmacoeconomic analysis to ensure new treatments like biologic therapies for glaucoma and those targeting steroid-induced glaucoma are accessible.

The Rest of the World, including South America and MEA, shows moderate growth as ophthalmic pharmaceutical manufacturing capabilities expand.

Market Dynamics

Our researchers analyzed the data with 2025 as the base year, along with the key drivers, trends, and challenges. A holistic analysis of drivers will help companies refine their marketing strategies to gain a competitive advantage.

  • Advancements in the open-angle glaucoma therapeutics market are increasingly focused on sophisticated, long-term management strategies. The impact of patient adherence on glaucoma outcomes remains a central concern, driving innovation beyond traditional eye drops. Sustained-release implants for glaucoma treatment are a prime example, offering a significant advantage over daily topical ophthalmic solutions by ensuring consistent drug delivery.
  • A comparison of preservative-free prostaglandin analogs shows a clear trend toward formulations that mitigate ocular surface disease, a common complaint with chronic therapy. The future of drug delivery in ophthalmology also includes exploration into gene therapy approaches for IOP reduction and the development of biologic therapies targeting optic nerve protection.
  • For patients with advanced conditions, treatment options for refractory glaucoma are expanding, incorporating novel mechanisms like rho kinase inhibitors, despite their distinct side effect profile. An essential part of modern care involves the cost-benefit analysis of glaucoma surgery versus lifelong pharmacotherapy.
  • Furthermore, the role of remote monitoring in glaucoma care is growing, with AI diagnostics for early glaucoma detection improving proactive management. These strategies collectively aim to enhance the pharmacology of fixed-dose combination eye drops and improve medication compliance rates, which can be over 50% higher with simplified regimens compared to multi-drug schedules.

What are the key market drivers leading to the rise in the adoption of Open-angle Glaucoma Therapeutics Industry?

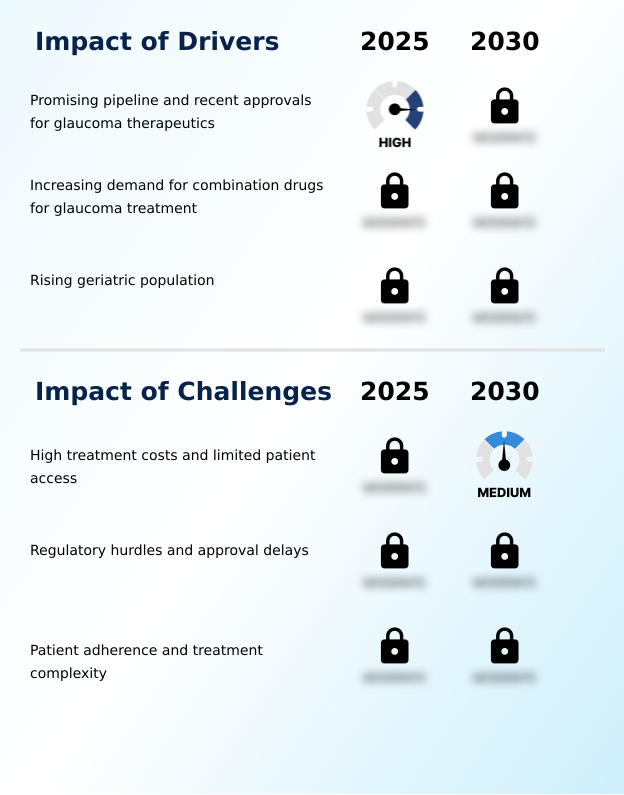
  • A promising pipeline and recent regulatory approvals for novel glaucoma therapeutics are key drivers fueling market growth.

  • The growth of the open-angle glaucoma therapeutics market is propelled by significant clinical and demographic drivers. A robust pipeline of pharmacologic therapy, including novel rho kinase inhibitors and multi-target drug regimens, is expanding treatment options.
  • The increasing demand for fixed-dose combination drugs is a major factor, as these therapies can improve patient treatment adherence by over 30% compared to administering multiple monotherapies. This directly addresses a critical challenge in long-term disease management.
  • Concurrently, the rising global geriatric population creates a sustained need for effective solutions that ensure visual field preservation. Innovations in topical ophthalmic formulations, such as preservative-free eye drops, are designed to enhance comfort and compliance.
  • This focus on improving the patient experience is a key element supporting market expansion and achieving better IOP fluctuation control.

What are the market trends shaping the Open-angle Glaucoma Therapeutics Industry?

  • The development of biologics for glaucoma treatment is an emerging trend. These therapies are poised to reshape disease management by targeting specific pathways to slow or prevent optic nerve damage.

  • Key trends are reshaping the open-angle glaucoma therapeutics market, focusing on advanced treatment modalities and patient-centric care. The development of biologic therapies for glaucoma is a primary focus, with research showing these agents can offer targeted neuroprotection strategies in ophthalmology, a significant advancement over traditional methods.
  • Innovations in ophthalmic drug delivery are also prominent, with a move toward solutions that support treatment regimen simplification. Strategic collaborations are accelerating progress, with partnerships between pharmaceutical firms and tech companies shortening development timelines for digital health solutions by an average of 15%. This integration of technology enhances therapeutic precision and supports chronic eye disease care.
  • Additionally, the focus on patient quality of life is driving demand for treatments with differentiated safety profiles and better management of ocular side effects.

What challenges does the Open-angle Glaucoma Therapeutics Industry face during its growth?

  • High treatment costs and limited patient access present key challenges, affecting industry growth by hindering the adoption of innovative therapies.

  • Significant challenges constrain the open-angle glaucoma therapeutics market, primarily centered on access, adherence, and regulatory complexities. The high cost of advanced treatments, such as biologic therapies and sustained-release implants, limits patient access, particularly in regions without comprehensive reimbursement.
  • This financial barrier is compounded by issues with patient treatment adherence; studies indicate that non-compliance rates can be as high as 50% for complex daily regimens, undermining therapeutic efficacy. Furthermore, navigating the regulatory approval process introduces considerable delays, with timelines for new drug approvals varying by up to 18 months across different international agencies.
  • This unpredictability affects commercialization strategies for products like scleral drug delivery systems and complicates clinical workflow integration for new technologies aimed at improving pharmacoeconomic analysis and early disease detection.

Exclusive Technavio Analysis on Customer Landscape

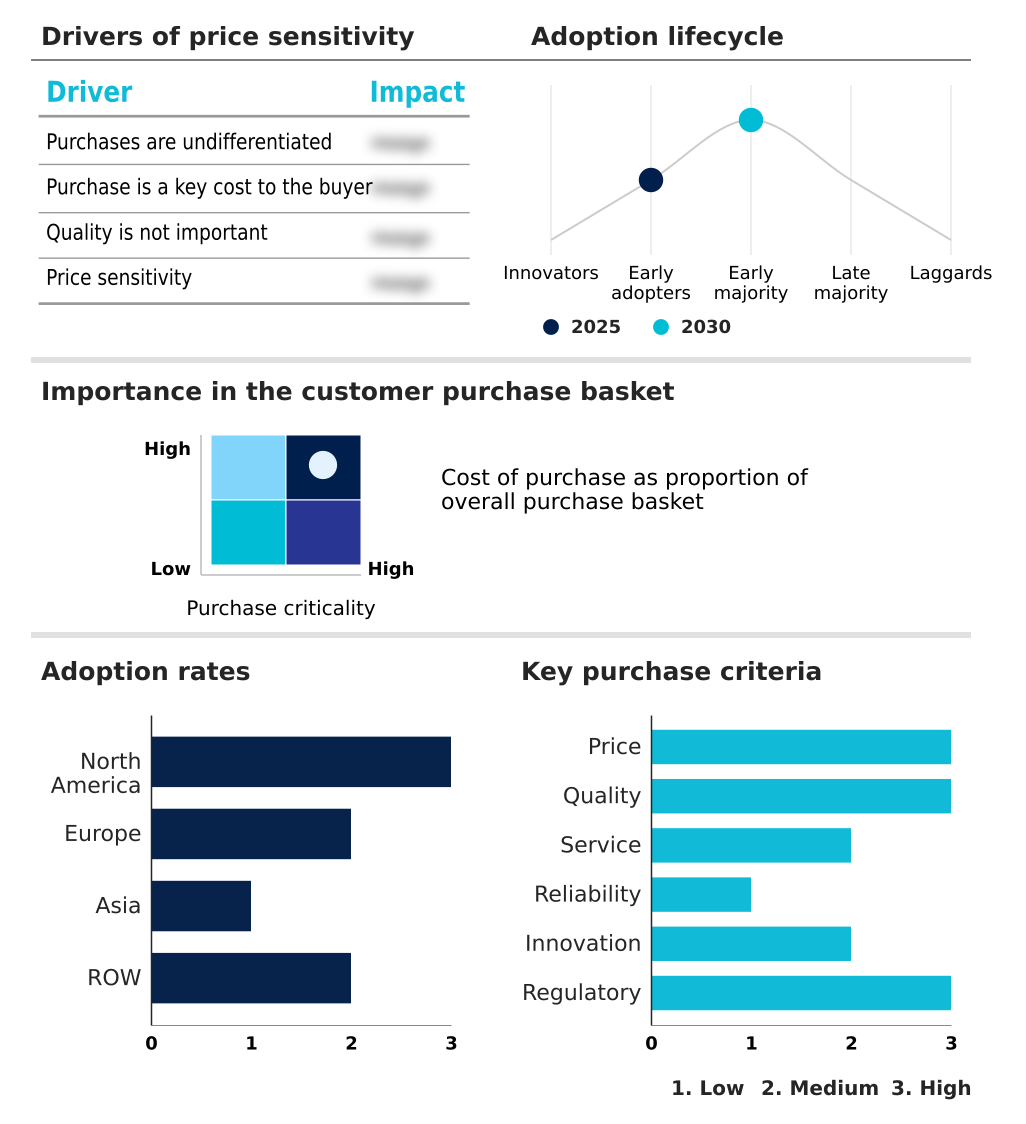
The open-angle glaucoma therapeutics market forecasting report includes the adoption lifecycle of the market, covering from the innovator’s stage to the laggard’s stage. It focuses on adoption rates in different regions based on penetration. Furthermore, the open-angle glaucoma therapeutics market report also includes key purchase criteria and drivers of price sensitivity to help companies evaluate and develop their market growth analysis strategies.

Customer Landscape of Open-angle Glaucoma Therapeutics Industry

Competitive Landscape

Companies are implementing various strategies, such as strategic alliances, open-angle glaucoma therapeutics market forecast, partnerships, mergers and acquisitions, geographical expansion, and product/service launches, to enhance their presence in the industry.

AbbVie Inc. - The vendor landscape features specialized companies providing a range of open-angle glaucoma therapeutics, including topical ophthalmic solutions and advanced biologic therapies designed for long-term disease management.

The industry research and growth report includes detailed analyses of the competitive landscape of the market and information about key companies, including:

  • AbbVie Inc.
  • Alcon Inc.
  • Bausch Health Companies Inc.
  • Hikma Pharmaceuticals Plc
  • Merck and Co. Inc.
  • Nicox S.A.
  • Novartis AG
  • Otsuka Pharmaceutical Co Ltd.
  • Pfizer Inc.
  • Santen Pharmaceutical Co. Ltd.
  • Sun Pharmaceutical Industries Ltd.
  • Teva Pharmaceutical Ltd.

Qualitative and quantitative analysis of companies has been conducted to help clients understand the wider business environment as well as the strengths and weaknesses of key industry players. Data is qualitatively analyzed to categorize companies as pure play, category-focused, industry-focused, and diversified; it is quantitatively analyzed to categorize companies as dominant, leading, strong, tentative, and weak.

Recent Development and News in Open-angle glaucoma therapeutics market

  • In August 2025, Alcon Inc. launched a novel sustained-release implant designed to lower intraocular pressure for up to six months, offering a more convenient and effective therapy while reducing the need for daily eye drops.
  • In September 2025, Bausch Health Companies Inc. introduced a fixed-dose combination eye drop that combines a prostaglandin analog and a beta-blocker, specifically designed to improve patient adherence and reduce side effects.
  • In March 2025, AbbVie Inc. (Allergan) launched a new preservative-free prostaglandin formulation designed to improve comfort for patients with chronic ocular surface sensitivity, helping maintain consistent long-term dosing.
  • In July 2025, Alcon Inc. launched an easy-to-administer preservative-free eye drop targeting older patients with sensitive eyes, ensuring better tolerability and compliance for the geriatric population.

Dive into Technavio’s robust research methodology, blending expert interviews, extensive data synthesis, and validated models for unparalleled Open-angle Glaucoma Therapeutics Market insights. See full methodology.

Market Scope
Page number 275
Base year 2025
Historic period 2020-2024
Forecast period 2026-2030
Growth momentum & CAGR Accelerate at a CAGR of 6.9%
Market growth 2026-2030 USD 3071.8 million
Market structure Concentrated
YoY growth 2025-2026(%) 6.6%
Key countries US, Canada, Mexico, Germany, UK, France, Italy, The Netherlands, Spain, Russia, China, Japan, India, South Korea, Indonesia, Thailand, Singapore, Australia, UAE, Brazil, South Africa, Saudi Arabia and Turkey
Competitive landscape Leading Companies, Market Positioning of Companies, Competitive Strategies, and Industry Risks

Request Free Sample

Research Analyst Overview

  • The open-angle glaucoma therapeutics market is undergoing a significant transformation driven by innovations in drug delivery and biologic interventions. The emphasis is shifting from daily topical ophthalmic formulations to more durable solutions like sustained-release drug delivery systems, which include biodegradable implants and medication-eluting contact lenses.
  • This pivot toward long-acting therapies has a direct impact on boardroom-level decisions, compelling companies to reallocate R&D budgets toward advanced manufacturing and novel clinical trial endpoints for these complex products. The development of biologic therapies for glaucoma and neuroprotective agents is introducing new mechanisms for retinal ganglion cell protection and optic nerve damage mitigation.
  • These advanced glaucoma treatments, including rho kinase inhibitors and multi-target drug regimens, are designed for personalized medicine in glaucoma. Adherence is a critical factor, and smart dosing reminders integrated with remote patient monitoring have been shown to improve compliance by up to 40%.
  • The evolution toward therapeutic precision is further enhanced by AI-powered diagnostic tools and disease progression analytics, which are essential for managing IOP fluctuation control and achieving visual field preservation in a market shaped by a stringent regulatory approval process.

What are the Key Data Covered in this Open-angle Glaucoma Therapeutics Market Research and Growth Report?

  • What is the expected growth of the Open-angle Glaucoma Therapeutics Market between 2026 and 2030?

    • USD 3.07 billion, at a CAGR of 6.9%

  • What segmentation does the market report cover?

    • The report is segmented by Product (PGAs, and Non PGAs), Channel (Hospital pharmacy, Retail pharmacy, and Online pharmacy), Route of Administration (Topical, Oral, and Injectable) and Geography (North America, Europe, Asia, Rest of World (ROW))

  • Which regions are analyzed in the report?

    • North America, Europe, Asia and Rest of World (ROW)

  • What are the key growth drivers and market challenges?

    • Promising pipeline and recent approvals for glaucoma therapeutics, High treatment costs and limited patient access

  • Who are the major players in the Open-angle Glaucoma Therapeutics Market?

    • AbbVie Inc., Alcon Inc., Bausch Health Companies Inc., Hikma Pharmaceuticals Plc, Merck and Co. Inc., Nicox S.A., Novartis AG, Otsuka Pharmaceutical Co Ltd., Pfizer Inc., Santen Pharmaceutical Co. Ltd., Sun Pharmaceutical Industries Ltd. and Teva Pharmaceutical Ltd.

Market Research Insights

  • The market dynamics for open-angle glaucoma therapeutics are shaped by the drive for improved clinical outcomes and patient convenience. Innovations in ophthalmic drug delivery, such as sustained-release implants, have demonstrated the ability to improve treatment regimen simplification, with some systems reducing dosing frequency by over 95% compared to daily eye drops.
  • This directly addresses poor glaucoma treatment compliance, a factor linked to disease progression. Furthermore, the adoption of digital health solutions for ophthalmology supports remote monitoring, which can improve clinical workflow integration by 30%. The emphasis on long-term visual health is also steering development toward therapies with differentiated safety profiles, as managing ocular side effects is critical for sustaining lifelong treatment.
  • These advancements reflect a move toward therapeutic precision and patient-centric drug design.

We can help! Our analysts can customize this open-angle glaucoma therapeutics market research report to meet your requirements.

Get in touch

1. Executive Summary

1.1 Market overview

Executive Summary - Chart on Market Overview
Executive Summary - Data Table on Market Overview
Executive Summary - Chart on Global Market Characteristics
Executive Summary - Chart on Market by Geography
Executive Summary - Chart on Market Segmentation by Product
Executive Summary - Chart on Market Segmentation by Channel
Executive Summary - Chart on Market Segmentation by Route of Administration
Executive Summary - Chart on Incremental Growth
Executive Summary - Data Table on Incremental Growth
Executive Summary - Chart on Company Market Positioning

2. Technavio Analysis

2.1 Analysis of price sensitivity, lifecycle, customer purchase basket, adoption rates, and purchase criteria

2.2 Criticality of inputs and Factors of differentiation

Chart on Overview on criticality of inputs and factors of differentiation

2.3 Factors of disruption

Chart on Overview on factors of disruption

2.4 Impact of drivers and challenges

Chart on Impact of drivers and challenges in 2025 and 2030

3. Market Landscape

3.1 Market ecosystem

Chart on Parent Market
Data Table on - Parent Market

3.2 Market characteristics

Chart on Market characteristics analysis

3.3 Value chain analysis

Chart on Value chain analysis

4. Market Sizing

4.1 Market definition

Data Table on Offerings of companies included in the market definition

4.2 Market segment analysis

Market segments

4.3 Market size 2025

4.4 Market outlook: Forecast for 2025-2030

Chart on Global - Market size and forecast 2025-2030 ($ million)
Data Table on Global - Market size and forecast 2025-2030 ($ million)
Chart on Global Market: Year-over-year growth 2025-2030 (%)
Data Table on Global Market: Year-over-year growth 2025-2030 (%)

5. Historic Market Size

5.1 Global Open-Angle Glaucoma Therapeutics Market 2020 - 2024

Historic Market Size - Data Table on Global Open-Angle Glaucoma Therapeutics Market 2020 - 2024 ($ million)

5.2 Product segment analysis 2020 - 2024

Historic Market Size - Product Segment 2020 - 2024 ($ million)

5.3 Channel segment analysis 2020 - 2024

Historic Market Size - Channel Segment 2020 - 2024 ($ million)

5.4 Route of Administration segment analysis 2020 - 2024

Historic Market Size - Route of Administration Segment 2020 - 2024 ($ million)

5.5 Geography segment analysis 2020 - 2024

Historic Market Size - Geography Segment 2020 - 2024 ($ million)

5.6 Country segment analysis 2020 - 2024

Historic Market Size - Country Segment 2020 - 2024 ($ million)

6. Qualitative Analysis

6.1 AI Impact on Global Open-Angle Glaucoma Therapeutics Market

7. Five Forces Analysis

7.1 Five forces summary

Five forces analysis - Comparison between 2025 and 2030

7.2 Bargaining power of buyers

Bargaining power of buyers - Impact of key factors 2025 and 2030

7.3 Bargaining power of suppliers

Bargaining power of suppliers - Impact of key factors in 2025 and 2030

7.4 Threat of new entrants

Threat of new entrants - Impact of key factors in 2025 and 2030

7.5 Threat of substitutes

Threat of substitutes - Impact of key factors in 2025 and 2030

7.6 Threat of rivalry

Threat of rivalry - Impact of key factors in 2025 and 2030

7.7 Market condition

Chart on Market condition - Five forces 2025 and 2030

8. Market Segmentation by Product

8.1 Market segments

Chart on Product - Market share 2025-2030 (%)
Data Table on Product - Market share 2025-2030 (%)

8.2 Comparison by Product

Chart on Comparison by Product
Data Table on Comparison by Product

8.3 PGAs - Market size and forecast 2025-2030

Chart on PGAs - Market size and forecast 2025-2030 ($ million)
Data Table on PGAs - Market size and forecast 2025-2030 ($ million)
Chart on PGAs - Year-over-year growth 2025-2030 (%)
Data Table on PGAs - Year-over-year growth 2025-2030 (%)

8.4 Non PGAs - Market size and forecast 2025-2030

Chart on Non PGAs - Market size and forecast 2025-2030 ($ million)
Data Table on Non PGAs - Market size and forecast 2025-2030 ($ million)
Chart on Non PGAs - Year-over-year growth 2025-2030 (%)
Data Table on Non PGAs - Year-over-year growth 2025-2030 (%)

8.5 Market opportunity by Product

Market opportunity by Product ($ million)
Data Table on Market opportunity by Product ($ million)

9. Market Segmentation by Channel

9.1 Market segments

Chart on Channel - Market share 2025-2030 (%)
Data Table on Channel - Market share 2025-2030 (%)

9.2 Comparison by Channel

Chart on Comparison by Channel
Data Table on Comparison by Channel

9.3 Hospital pharmacy - Market size and forecast 2025-2030

Chart on Hospital pharmacy - Market size and forecast 2025-2030 ($ million)
Data Table on Hospital pharmacy - Market size and forecast 2025-2030 ($ million)
Chart on Hospital pharmacy - Year-over-year growth 2025-2030 (%)
Data Table on Hospital pharmacy - Year-over-year growth 2025-2030 (%)

9.4 Retail pharmacy - Market size and forecast 2025-2030

Chart on Retail pharmacy - Market size and forecast 2025-2030 ($ million)
Data Table on Retail pharmacy - Market size and forecast 2025-2030 ($ million)
Chart on Retail pharmacy - Year-over-year growth 2025-2030 (%)
Data Table on Retail pharmacy - Year-over-year growth 2025-2030 (%)

9.5 Online pharmacy - Market size and forecast 2025-2030

Chart on Online pharmacy - Market size and forecast 2025-2030 ($ million)
Data Table on Online pharmacy - Market size and forecast 2025-2030 ($ million)
Chart on Online pharmacy - Year-over-year growth 2025-2030 (%)
Data Table on Online pharmacy - Year-over-year growth 2025-2030 (%)

9.6 Market opportunity by Channel

Market opportunity by Channel ($ million)
Data Table on Market opportunity by Channel ($ million)

10. Market Segmentation by Route of Administration

10.1 Market segments

Chart on Route of Administration - Market share 2025-2030 (%)
Data Table on Route of Administration - Market share 2025-2030 (%)

10.2 Comparison by Route of Administration

Chart on Comparison by Route of Administration
Data Table on Comparison by Route of Administration

10.3 Topical - Market size and forecast 2025-2030

Chart on Topical - Market size and forecast 2025-2030 ($ million)
Data Table on Topical - Market size and forecast 2025-2030 ($ million)
Chart on Topical - Year-over-year growth 2025-2030 (%)
Data Table on Topical - Year-over-year growth 2025-2030 (%)

10.4 Oral - Market size and forecast 2025-2030

Chart on Oral - Market size and forecast 2025-2030 ($ million)
Data Table on Oral - Market size and forecast 2025-2030 ($ million)
Chart on Oral - Year-over-year growth 2025-2030 (%)
Data Table on Oral - Year-over-year growth 2025-2030 (%)

10.5 Injectable - Market size and forecast 2025-2030

Chart on Injectable - Market size and forecast 2025-2030 ($ million)
Data Table on Injectable - Market size and forecast 2025-2030 ($ million)
Chart on Injectable - Year-over-year growth 2025-2030 (%)
Data Table on Injectable - Year-over-year growth 2025-2030 (%)

10.6 Market opportunity by Route of Administration

Market opportunity by Route of Administration ($ million)
Data Table on Market opportunity by Route of Administration ($ million)

11. Customer Landscape

11.1 Customer landscape overview

Analysis of price sensitivity, lifecycle, customer purchase basket, adoption rates, and purchase criteria

12. Geographic Landscape

12.1 Geographic segmentation

Chart on Market share by geography 2025-2030 (%)
Data Table on Market share by geography 2025-2030 (%)

12.2 Geographic comparison

Chart on Geographic comparison
Data Table on Geographic comparison

12.3 North America - Market size and forecast 2025-2030

Chart on North America - Market size and forecast 2025-2030 ($ million)
Data Table on North America - Market size and forecast 2025-2030 ($ million)
Chart on North America - Year-over-year growth 2025-2030 (%)
Data Table on North America - Year-over-year growth 2025-2030 (%)
Chart on Regional Comparison - North America
Data Table on Regional Comparison - North America

12.3.1 US - Market size and forecast 2025-2030

Chart on US - Market size and forecast 2025-2030 ($ million)
Data Table on US - Market size and forecast 2025-2030 ($ million)
Chart on US - Year-over-year growth 2025-2030 (%)
Data Table on US - Year-over-year growth 2025-2030 (%)

12.3.2 Canada - Market size and forecast 2025-2030

Chart on Canada - Market size and forecast 2025-2030 ($ million)
Data Table on Canada - Market size and forecast 2025-2030 ($ million)
Chart on Canada - Year-over-year growth 2025-2030 (%)
Data Table on Canada - Year-over-year growth 2025-2030 (%)

12.3.3 Mexico - Market size and forecast 2025-2030

Chart on Mexico - Market size and forecast 2025-2030 ($ million)
Data Table on Mexico - Market size and forecast 2025-2030 ($ million)
Chart on Mexico - Year-over-year growth 2025-2030 (%)
Data Table on Mexico - Year-over-year growth 2025-2030 (%)

12.4 Europe - Market size and forecast 2025-2030

Chart on Europe - Market size and forecast 2025-2030 ($ million)
Data Table on Europe - Market size and forecast 2025-2030 ($ million)
Chart on Europe - Year-over-year growth 2025-2030 (%)
Data Table on Europe - Year-over-year growth 2025-2030 (%)
Chart on Regional Comparison - Europe
Data Table on Regional Comparison - Europe

12.4.1 Germany - Market size and forecast 2025-2030

Chart on Germany - Market size and forecast 2025-2030 ($ million)
Data Table on Germany - Market size and forecast 2025-2030 ($ million)
Chart on Germany - Year-over-year growth 2025-2030 (%)
Data Table on Germany - Year-over-year growth 2025-2030 (%)

12.4.2 UK - Market size and forecast 2025-2030

Chart on UK - Market size and forecast 2025-2030 ($ million)
Data Table on UK - Market size and forecast 2025-2030 ($ million)
Chart on UK - Year-over-year growth 2025-2030 (%)
Data Table on UK - Year-over-year growth 2025-2030 (%)

12.4.3 France - Market size and forecast 2025-2030

Chart on France - Market size and forecast 2025-2030 ($ million)
Data Table on France - Market size and forecast 2025-2030 ($ million)
Chart on France - Year-over-year growth 2025-2030 (%)
Data Table on France - Year-over-year growth 2025-2030 (%)

12.4.4 Italy - Market size and forecast 2025-2030

Chart on Italy - Market size and forecast 2025-2030 ($ million)
Data Table on Italy - Market size and forecast 2025-2030 ($ million)
Chart on Italy - Year-over-year growth 2025-2030 (%)
Data Table on Italy - Year-over-year growth 2025-2030 (%)

12.4.5 The Netherlands - Market size and forecast 2025-2030

Chart on The Netherlands - Market size and forecast 2025-2030 ($ million)
Data Table on The Netherlands - Market size and forecast 2025-2030 ($ million)
Chart on The Netherlands - Year-over-year growth 2025-2030 (%)
Data Table on The Netherlands - Year-over-year growth 2025-2030 (%)

12.4.6 Spain - Market size and forecast 2025-2030

Chart on Spain - Market size and forecast 2025-2030 ($ million)
Data Table on Spain - Market size and forecast 2025-2030 ($ million)
Chart on Spain - Year-over-year growth 2025-2030 (%)
Data Table on Spain - Year-over-year growth 2025-2030 (%)

12.4.7 Russia - Market size and forecast 2025-2030

Chart on Russia - Market size and forecast 2025-2030 ($ million)
Data Table on Russia - Market size and forecast 2025-2030 ($ million)
Chart on Russia - Year-over-year growth 2025-2030 (%)
Data Table on Russia - Year-over-year growth 2025-2030 (%)

12.5 Asia - Market size and forecast 2025-2030

Chart on Asia - Market size and forecast 2025-2030 ($ million)
Data Table on Asia - Market size and forecast 2025-2030 ($ million)
Chart on Asia - Year-over-year growth 2025-2030 (%)
Data Table on Asia - Year-over-year growth 2025-2030 (%)
Chart on Regional Comparison - Asia
Data Table on Regional Comparison - Asia

12.5.1 China - Market size and forecast 2025-2030

Chart on China - Market size and forecast 2025-2030 ($ million)
Data Table on China - Market size and forecast 2025-2030 ($ million)
Chart on China - Year-over-year growth 2025-2030 (%)
Data Table on China - Year-over-year growth 2025-2030 (%)

12.5.2 Japan - Market size and forecast 2025-2030

Chart on Japan - Market size and forecast 2025-2030 ($ million)
Data Table on Japan - Market size and forecast 2025-2030 ($ million)
Chart on Japan - Year-over-year growth 2025-2030 (%)
Data Table on Japan - Year-over-year growth 2025-2030 (%)

12.5.3 India - Market size and forecast 2025-2030

Chart on India - Market size and forecast 2025-2030 ($ million)
Data Table on India - Market size and forecast 2025-2030 ($ million)
Chart on India - Year-over-year growth 2025-2030 (%)
Data Table on India - Year-over-year growth 2025-2030 (%)

12.5.4 South Korea - Market size and forecast 2025-2030

Chart on South Korea - Market size and forecast 2025-2030 ($ million)
Data Table on South Korea - Market size and forecast 2025-2030 ($ million)
Chart on South Korea - Year-over-year growth 2025-2030 (%)
Data Table on South Korea - Year-over-year growth 2025-2030 (%)

12.5.5 Indonesia - Market size and forecast 2025-2030

Chart on Indonesia - Market size and forecast 2025-2030 ($ million)
Data Table on Indonesia - Market size and forecast 2025-2030 ($ million)
Chart on Indonesia - Year-over-year growth 2025-2030 (%)
Data Table on Indonesia - Year-over-year growth 2025-2030 (%)

12.5.6 Thailand - Market size and forecast 2025-2030

Chart on Thailand - Market size and forecast 2025-2030 ($ million)
Data Table on Thailand - Market size and forecast 2025-2030 ($ million)
Chart on Thailand - Year-over-year growth 2025-2030 (%)
Data Table on Thailand - Year-over-year growth 2025-2030 (%)

12.5.7 Singapore - Market size and forecast 2025-2030

Chart on Singapore - Market size and forecast 2025-2030 ($ million)
Data Table on Singapore - Market size and forecast 2025-2030 ($ million)
Chart on Singapore - Year-over-year growth 2025-2030 (%)
Data Table on Singapore - Year-over-year growth 2025-2030 (%)

12.6 Rest of World (ROW) - Market size and forecast 2025-2030

Chart on Rest of World (ROW) - Market size and forecast 2025-2030 ($ million)
Data Table on Rest of World (ROW) - Market size and forecast 2025-2030 ($ million)
Chart on Rest of World (ROW) - Year-over-year growth 2025-2030 (%)
Data Table on Rest of World (ROW) - Year-over-year growth 2025-2030 (%)
Chart on Regional Comparison - Rest of World (ROW)
Data Table on Regional Comparison - Rest of World (ROW)

12.6.1 Australia - Market size and forecast 2025-2030

Chart on Australia - Market size and forecast 2025-2030 ($ million)
Data Table on Australia - Market size and forecast 2025-2030 ($ million)
Chart on Australia - Year-over-year growth 2025-2030 (%)
Data Table on Australia - Year-over-year growth 2025-2030 (%)

12.6.2 UAE - Market size and forecast 2025-2030

Chart on UAE - Market size and forecast 2025-2030 ($ million)
Data Table on UAE - Market size and forecast 2025-2030 ($ million)
Chart on UAE - Year-over-year growth 2025-2030 (%)
Data Table on UAE - Year-over-year growth 2025-2030 (%)

12.6.3 Brazil - Market size and forecast 2025-2030

Chart on Brazil - Market size and forecast 2025-2030 ($ million)
Data Table on Brazil - Market size and forecast 2025-2030 ($ million)
Chart on Brazil - Year-over-year growth 2025-2030 (%)
Data Table on Brazil - Year-over-year growth 2025-2030 (%)

12.6.4 South Africa - Market size and forecast 2025-2030

Chart on South Africa - Market size and forecast 2025-2030 ($ million)
Data Table on South Africa - Market size and forecast 2025-2030 ($ million)
Chart on South Africa - Year-over-year growth 2025-2030 (%)
Data Table on South Africa - Year-over-year growth 2025-2030 (%)

12.6.5 Saudi Arabia - Market size and forecast 2025-2030

Chart on Saudi Arabia - Market size and forecast 2025-2030 ($ million)
Data Table on Saudi Arabia - Market size and forecast 2025-2030 ($ million)
Chart on Saudi Arabia - Year-over-year growth 2025-2030 (%)
Data Table on Saudi Arabia - Year-over-year growth 2025-2030 (%)

12.6.6 Turkey - Market size and forecast 2025-2030

Chart on Turkey - Market size and forecast 2025-2030 ($ million)
Data Table on Turkey - Market size and forecast 2025-2030 ($ million)
Chart on Turkey - Year-over-year growth 2025-2030 (%)
Data Table on Turkey - Year-over-year growth 2025-2030 (%)

12.7 Market opportunity by geography

Market opportunity by geography ($ million)
Data Tables on Market opportunity by geography ($ million)

13. Drivers, Challenges, and Opportunity

13.1 Market drivers

Promising pipeline and recent approvals for glaucoma therapeutics
Increasing demand for combination drugs for glaucoma treatment
Rising geriatric population

13.2 Market challenges

High treatment costs and limited patient access
Regulatory hurdles and approval delays
Patient adherence and treatment complexity

13.3 Impact of drivers and challenges

Impact of drivers and challenges in 2025 and 2030

13.4 Market opportunities

Development of biologics for glaucoma treatment
Growing collaboration and alliance among companies
Growing awareness about glaucoma

14. Competitive Landscape

14.1 Overview

14.2

Overview on criticality of inputs and factors of differentiation

14.3 Landscape disruption

Overview on factors of disruption

14.4 Industry risks

Impact of key risks on business

15. Competitive Analysis

15.1 Companies profiled

Companies covered

15.2 Company ranking index

15.3 Market positioning of companies

Matrix on companies position and classification

15.4 AbbVie Inc.

AbbVie Inc. - Overview
AbbVie Inc. - Product / Service
AbbVie Inc. - Key news
AbbVie Inc. - Key offerings
SWOT

15.5 Alcon Inc.

Alcon Inc. - Overview
Alcon Inc. - Business segments
Alcon Inc. - Key news
Alcon Inc. - Key offerings
Alcon Inc. - Segment focus
SWOT

15.6 Bausch Health Companies Inc.

Bausch Health Companies Inc. - Overview
Bausch Health Companies Inc. - Business segments
Bausch Health Companies Inc. - Key news
Bausch Health Companies Inc. - Key offerings
Bausch Health Companies Inc. - Segment focus
SWOT

15.7 Hikma Pharmaceuticals Plc

Hikma Pharmaceuticals Plc - Overview
Hikma Pharmaceuticals Plc - Business segments
Hikma Pharmaceuticals Plc - Key news
Hikma Pharmaceuticals Plc - Key offerings
Hikma Pharmaceuticals Plc - Segment focus
SWOT

15.8 Merck and Co. Inc.

Merck and Co. Inc. - Overview
Merck and Co. Inc. - Business segments
Merck and Co. Inc. - Key news
Merck and Co. Inc. - Key offerings
Merck and Co. Inc. - Segment focus
SWOT

15.9 Nicox S.A.

Nicox S.A. - Overview
Nicox S.A. - Product / Service
Nicox S.A. - Key offerings
SWOT

15.10 Novartis AG

Novartis AG - Overview
Novartis AG - Business segments
Novartis AG - Key news
Novartis AG - Key offerings
Novartis AG - Segment focus
SWOT

15.11 Otsuka Pharmaceutical Co Ltd.

Otsuka Pharmaceutical Co Ltd. - Overview
Otsuka Pharmaceutical Co Ltd. - Product / Service
Otsuka Pharmaceutical Co Ltd. - Key offerings
SWOT

15.12 Pfizer Inc.

Pfizer Inc. - Overview
Pfizer Inc. - Product / Service
Pfizer Inc. - Key news
Pfizer Inc. - Key offerings
SWOT

15.13 Santen Pharmaceutical Co. Ltd.

Santen Pharmaceutical Co. Ltd. - Overview
Santen Pharmaceutical Co. Ltd. - Product / Service
Santen Pharmaceutical Co. Ltd. - Key offerings
SWOT

15.14 Sun Pharmaceutical Industries Ltd.

Sun Pharmaceutical Industries Ltd. - Overview
Sun Pharmaceutical Industries Ltd. - Product / Service
Sun Pharmaceutical Industries Ltd. - Key news
Sun Pharmaceutical Industries Ltd. - Key offerings
SWOT

15.15 Teva Pharmaceutical Ltd.

Teva Pharmaceutical Ltd. - Overview
Teva Pharmaceutical Ltd. - Business segments
Teva Pharmaceutical Ltd. - Key news
Teva Pharmaceutical Ltd. - Key offerings
Teva Pharmaceutical Ltd. - Segment focus
SWOT

16. Appendix

16.1 Scope of the report

Market definition
Objectives
Notes and caveats

16.2 Inclusions and exclusions checklist

Inclusions checklist
Exclusions checklist

16.3 Currency conversion rates for US$

16.4 Research methodology

16.5 Data procurement

Information sources

16.6 Data validation

16.7 Validation techniques employed for market sizing

16.8 Data synthesis

16.9 360 degree market analysis

16.10 List of abbreviations

Research Methodology

Technavio presents a detailed picture of the market by way of study, synthesis, and summation of data from multiple sources. The analysts have presented the various facets of the market with a particular focus on identifying the key industry influencers. The data thus presented is comprehensive, reliable, and the result of extensive research, both primary and secondary.

INFORMATION SOURCES

Primary sources

  • Manufacturers and suppliers
  • Channel partners
  • Industry experts
  • Strategic decision makers

Secondary sources

  • Industry journals and periodicals
  • Government data
  • Financial reports of key industry players
  • Historical data
  • Press releases

DATA ANALYSIS

Data Synthesis

  • Collation of data
  • Estimation of key figures
  • Analysis of derived insights

Data Validation

  • Triangulation with data models
  • Reference against proprietary databases
  • Corroboration with industry experts

REPORT WRITING

Qualitative

  • Market drivers
  • Market challenges
  • Market trends
  • Five forces analysis

Quantitative

  • Market size and forecast
  • Market segmentation
  • Geographical insights
  • Competitive landscape

Interested in this report?

Get your sample now to see our research methodology and insights!

Download Now

Frequently Asked Questions

Open-angle Glaucoma Therapeutics market growth will increase by USD 3071.8 million during 2026-2030.

The Open-angle Glaucoma Therapeutics market is expected to grow at a CAGR of 6.9% during 2026-2030.

Open-angle Glaucoma Therapeutics market is segmented by Product (PGAs, Non PGAs) Channel (Hospital pharmacy, Retail pharmacy, Online pharmacy) Route of administration (Topical, Oral, Injectable)

AbbVie Inc., Alcon Inc., Bausch Health Companies Inc., Hikma Pharmaceuticals Plc, Merck and Co. Inc., Nicox S.A., Novartis AG, Otsuka Pharmaceutical Co Ltd., Pfizer Inc., Santen Pharmaceutical Co. Ltd., Sun Pharmaceutical Industries Ltd., Teva Pharmaceutical Ltd. are a few of the key vendors in the Open-angle Glaucoma Therapeutics market.

North America will register the highest growth rate of 51.5% among the other regions. Therefore, the Open-angle Glaucoma Therapeutics market in North America is expected to garner significant business opportunities for the vendors during the forecast period.

US, Canada, Mexico, Germany, UK, France, Italy, The Netherlands, Spain, Russia, China, Japan, India, South Korea, Indonesia, Thailand, Singapore, Australia, UAE, Brazil, South Africa, Saudi Arabia, Turkey

  • Promising pipeline and recent approvals for glaucoma therapeutics is the driving factor this market.

The Open-angle Glaucoma Therapeutics market vendors should focus on grabbing business opportunities from the Product segment as it accounted for the largest market share in the base year.