Organic Packaged Food Market Size 2024-2028
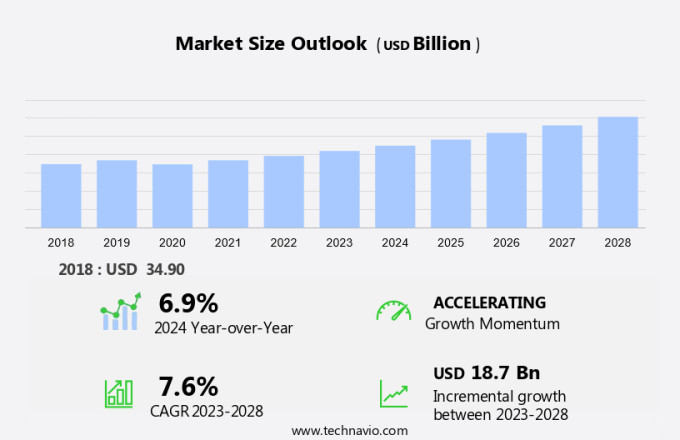
The organic packaged food market size is forecast to increase by USD 18.7 billion at a CAGR of 7.6% between 2023 and 2028.
- The market is experiencing significant growth due to the increasing consumer preference for sustainably produced food items. Organic farming practices, which exclude the use of chemicals and growth hormones, align with health-conscious consumers' demands for nutritious and safe food options. However, the higher cost of organic food packaging remains a challenge for some consumers. The health risks associated with conventional food products, including potential exposure to harmful chemicals, further fuel the market's growth. The COVID-19 pandemic has also accelerated the trend towards organic fresh food, as consumers prioritize their health and wellness. Winning strategies for companies in this market include innovative product development, effective marketing, and transparent labeling to build trust with consumers.
What will be the Size of the Market During the Forecast Period?
- The market is witnessing significant growth due to the increasing awareness and adoption of conscious consumerism. This shift towards healthier and more sustainable food options is driven by various factors, including a focus on holistic health, food security, and food sovereignty. The market for organic packaged food is fragmented, with numerous players offering a wide range of products. These include organic produce, natural food, and organic grocery items, as well as organic bakery products, organic confectionery, and organic beverages. The demand for organic food is fueled by consumers' desire for nutritious and high-quality food, as well as their commitment to ethical food consumption and healthy eating habits. Sustainable farming practices, such as agroecology and regenerative agriculture, are gaining popularity in the organic food industry. These practices prioritize the health of the soil, the welfare of animals, and the well-being of farmers and workers. Organic food certification ensures that these practices are adhered to, providing consumers with peace of mind and assurance of the authenticity and integrity of the food they consume. The organic food market is also influenced by regulations that prioritize food safety and quality. These regulations ensure that organic food is free from synthetic pesticides, genetically modified organisms (GMOs), and other harmful additives. Organic food pricing may be higher than conventionally produced food, but many consumers view the additional cost as a worthwhile investment in their health and the environment.
How is this market segmented and which is the largest segment?
The market research report provides comprehensive data (region-wise segment analysis), with forecasts and estimates in "USD billion" for the period 2024-2028, as well as historical data from 2018-2022 for the following segments.
- Product
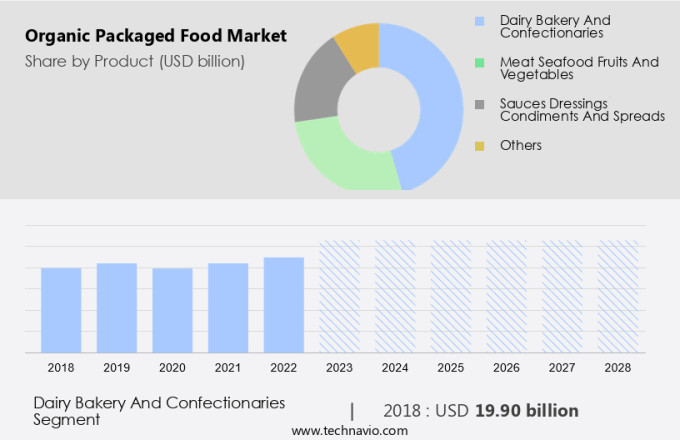
- Dairy bakery and confectionaries
- Meat seafood fruits and vegetables
- Sauces dressings condiments and spreads
- Others
- Geography
- North America
- Canada
- US
- Europe
- Germany
- APAC
- China
- South America
- Middle East and Africa
- North America
By Product Insights
- The dairy bakery and confectionaries segment is estimated to witness significant growth during the forecast period.
The market in the United States is witnessing significant growth due to the increasing preference for sustainably produced organic food items. Consumers are increasingly seeking out organic food products as they believe these items offer superior nutritional value and pose fewer health risks compared to conventionally produced food. Organic farming practices, which exclude the use of chemicals, growth hormones, and other synthetic additives, are gaining favor among health-conscious consumers.
Further, new product launches and innovations in the organic food sector are further fueling market growth. For instance, the organic dairy segment, which includes organic milk, yogurt, and other dairy products, is experiencing a wave in demand due to the higher nutrient content of these items. Organic milk, for example, contains a greater proportion of antioxidants, omega-3 fatty acids, and vitamins compared to regular milk. Hence, such factors are fuelling the growth of this segment during the forecast period.
Get a glance at the market report of share of various segments Request Free Sample
The dairy bakery and confectionaries segment was valued at USD 19.90 billion in 2018 and showed a gradual increase during the forecast period.
Regional Analysis
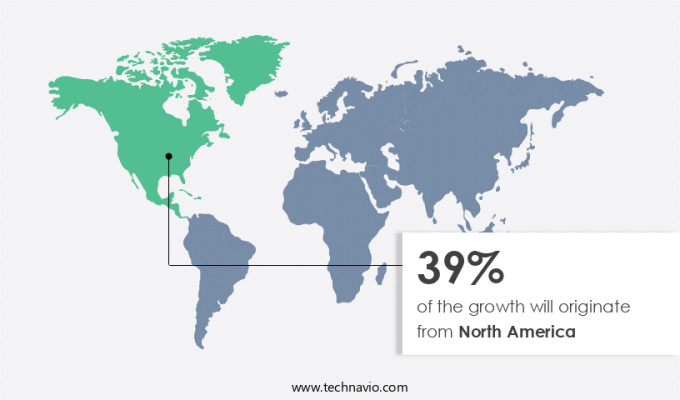
- North America is estimated to contribute 39% to the growth of the global market during the forecast period.
Technavio's analysts have elaborately explained the regional trends and drivers that shape the market during the forecast period.
For more insights on the market share of various regions Request Free Sample
The market in North America is leading the global trend, accounting for a significant market share in 2023. Consumers' increasing focus on healthier options and sustainability drives this market's growth. The demand for organic packaged foods is particularly high among health-conscious individuals who value convenience and diverse tastes. The US market is thriving, fueled by a growing population prioritizing organic foods for their perceived health benefits and reduced environmental impact. Organic packaged foods offer an attractive alternative to conventional options, providing consumers with peace of mind and enhanced nutrition. This market's future looks promising as more people recognize the long-term health benefits of making informed food choices.
Market Dynamics
Our researchers analyzed the data with 2023 as the base year, along with the key drivers, trends, and challenges. A holistic analysis of drivers will help companies refine their marketing strategies to gain a competitive advantage.
What are the key market drivers leading to the rise in adoption of Organic Packaged Food Market ?
The rising number of new product launches is the key driver of the market.
- The market in the United States is witnessing significant growth due to the increasing diet-health connection among consumers. companies are responding to this trend by introducing new, health-conscious products. For instance, in April 2023, So Delicious Dairy Free, a subsidiary of Danone North America, debuted its organic oat milk in the market. This product, made from organic oats, is available in Original and Extra Creamy variants, catering to the rising demand for natural dairy alternatives. Similarly, in May 2021, Maple Hill Creamery, a leading organic dairy brand in the US, launched Zero Sugar Organic Ultra-Filtered Milk. This product offers consumers a dairy option that adheres to their health-conscious lifestyle while maintaining the organic certification.
- Sustainability is another factor driving the growth of the market. companies are focusing on production scalability and product diversity to meet the increasing demand. They are also exploring natural alternatives to synthetic fertilizers to ensure the organic certification. For instance, Maple Hill Creamery uses regenerative farming practices to maintain the health of their cows and the land. In conclusion, the market in the US is experiencing growth due to the increasing health-conscious consumer base and the focus on sustainability. companies are responding to this trend by introducing new products and adopting sustainable farming practices to maintain their organic certification.
What are the market trends shaping the Organic Packaged Food Market?
Consumer awareness about health benefits of organic packaged foods is the upcoming trend in the market.
- The market in the United States has witnessed steady growth due to shifting consumer preferences towards healthier food options. This trend is driven by increasing awareness regarding the potential health benefits of organic farming practices, such as the absence of pesticides and synthetic additives. Furthermore, the support for locally sourced produce and biodiversity among consumers is fueling the demand for organic packaged foods.
- The uptake of organic food products is anticipated to continue, as more farmers adopt organic farming methods and the availability of these products increases. Consumers are becoming more conscious of the long-term health implications of consuming conventionally produced food and are turning to organic packaged foods as a healthier alternative. The continued growth of the market is expected to be a positive development for both farmers and consumers alike.
What challenges does Organic Packaged Food Market face during the growth?
The high cost of organic packaged food products is a key challenge affecting the market growth.
- Organic packaged food products, produced using natural techniques, command a higher retail price compared to their conventionally processed counterparts. The reasons for this price disparity include the use of inconsistent farming methods, labor-intensive production processes, and the absence of synthetic additives like pesticides, fertilizers, and growth hormones. These factors contribute to the time-consuming nature of organic food production.
- Middle-class consumers, who prioritize affordability, often opt for conventional packaged food items. Economic uncertainties and recessions further impact consumer purchasing power, potentially hindering sales of organic packaged food. However, advancements in technology and the emergence of private-label brands offer potential solutions to mitigate the cost issue. Consumers seeking wholesome, nutritious alternatives, driven by ecological awareness, continue to fuel the demand for organic nutrition bars and other packaged food products.
Exclusive Customer Landscape
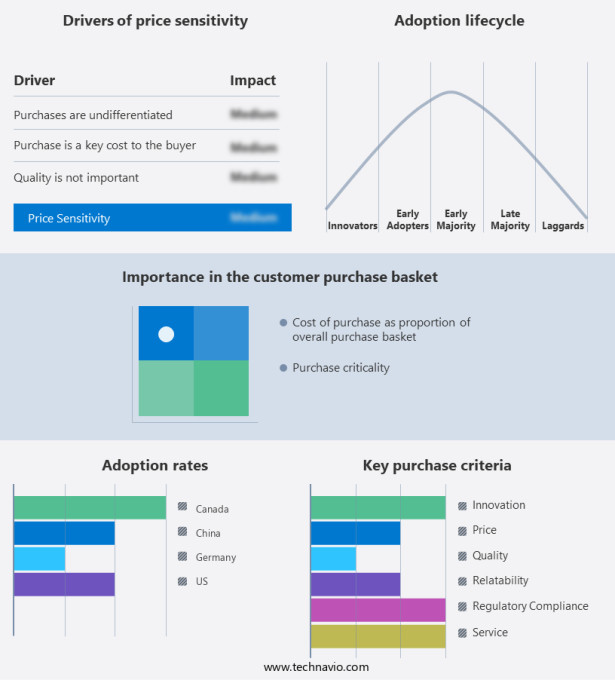
The market forecasting report includes the adoption lifecycle of the market, covering from the innovator's stage to the laggard's stage. It focuses on adoption rates in different regions based on penetration. Furthermore, the market report also includes key purchase criteria and drivers of price sensitivity to help companies evaluate and develop their market growth analysis strategies.
Customer Landscape
Key Companies & Market Insights
Companies are implementing various strategies, such as strategic alliances, market forecast , partnerships, mergers and acquisitions, geographical expansion, and product/service launches, to enhance their presence in the market. The market research and growth report includes detailed analyses of the competitive landscape of the market and information about key companies, including:
- Amys Kitchen Inc.
- Arla Foods amba
- Aurora Organic Dairy
- Barilla G. e R. Fratelli Spa
- Bolthouse Farms Inc.
- China Mengniu Dairy Co. Ltd.
- Corporativo Bimbo SA de CV
- Danone SA
- Happy Milk
- iD Fresh Food India Pvt. Ltd.
- Lidl US LLC
- LT Foods Ltd.
- Marico Ltd.
- Mother Dairy Fruit and Vegetable Pvt. Ltd.
- Nestle SA
- Organic Valley
- Perdue Farms Inc.
- The Hain Celestial Group Inc.
- The Hershey Co.
- Tyson Foods Inc.
Qualitative and quantitative analysis of companies has been conducted to help clients understand the wider business environment as well as the strengths and weaknesses of key market players. Data is qualitatively analyzed to categorize companies as pure play, category-focused, industry-focused, and diversified; it is quantitatively analyzed to categorize companies as dominant, leading, strong, tentative, and weak.
Research Analyst Overview
The market is witnessing significant growth due to the increasing demand for sustainably produced food items. Consumers are increasingly seeking out organic food products, as they offer health benefits and reduce the risk of exposure to harmful chemicals, such as pesticides and synthetic additives, used in conventional food production. Organic farming practices, which include the use of natural fertilizers and natural techniques, contribute to the biodiversity of crops and support the health of farmers and the environment. The uptake of organic packaged food is driven by consumer concerns over health risks associated with the use of growth hormones, antibiotics, and genetically modified organisms (GMOs) in food production. Moreover, the COVID-19 pandemic has further fueled this trend, as consumers prioritize their immune system and overall health. The organic food market is structured around various product categories, including bakery and confectionery, nutrition bars, and beverages. The market is competitive, with a diverse range of organic products catering to health-conscious and diet-health connection-focused consumers.
Moreover, sustainability and ecological awareness are key winning strategies for players in the market. Production scalability and product diversity are crucial factors for market success, as consumers seek convenient and nutritious organic packaged food options with diverse tastes. Organic certification ensures the authenticity and quality of these products, while natural alternatives to conventional farming practices, such as carbon footprint reduction and the use of natural fertilizers, contribute to the sustainability of the market. The organic packaged food market is witnessing a fragmented growth due to increasing organic food demand and diverse consumer preferences. With a focus on healthy lifestyle and nutritious food, the market is witnessing a revolution, driven by the environmental impact of organic farming and the desire for sustainable agriculture. The organic food supply chain is evolving, with innovations in organic food production, distribution, and retail. Consumers are increasingly seeking locally sourced, eco-conscious food, and organic food labels are becoming a priority.
Further, the market for organic food is expanding beyond fresh produce, with a growing demand for organic snacks, bakery items, and even organic supplements for seniors, athletes, and pets. Regulations play a crucial role in the organic food market, ensuring food quality and consumer safety. The market is also witnessing a shift towards online channels for organic food delivery and convenience. Natural sweeteners and ecofriendly food are gaining popularity, as consumers seek to reduce their carbon footprint and maintain a healthy weight. The organic food industry is not just about health and nutrition, but also about sustainability and reducing the environmental impact of farming. Organic food consumption patterns are changing, with a focus on organic food for weight loss, organic food recipes, and organic food for kids. The market for organic food is expected to continue growing, driven by consumer perception and a commitment to nongmo food and sustainable agriculture.
|
Market Scope |
|
|
Report Coverage |
Details |
|
Page number |
182 |
|
Base year |
2023 |
|
Historic period |
2018-2022 |
|
Forecast period |
2024-2028 |
|
Growth momentum & CAGR |
Accelerate at a CAGR of 7.6% |
|
Market growth 2024-2028 |
USD 18.7 billion |
|
Market structure |
Fragmented |
|
YoY growth 2023-2024(%) |
6.9 |
|
Key countries |
US, Germany, China, and Canada |
|
Competitive landscape |
Leading Companies, Market Positioning of Companies, Competitive Strategies, and Industry Risks |
What are the Key Data Covered in this Market Research and Growth Report?
- CAGR of the market during the forecast period
- Detailed information on factors that will drive the market growth and forecasting between 2024 and 2028
- Precise estimation of the size of the market and its contribution of the market in focus to the parent market
- Accurate predictions about upcoming market growth and trends and changes in consumer behaviour
- Growth of the market across North America, Europe, APAC, South America, and Middle East and Africa
- Thorough analysis of the market's competitive landscape and detailed information about companies
- Comprehensive analysis of factors that will challenge the growth of market companies
We can help! Our analysts can customize this market research report to meet your requirements. Get in touch


