Organic Soy Protein Market Analysis, Size, and Forecast 2025-2029: North America (US, Canada, and Mexico), Europe (Germany, UK, and France), APAC (China, India, and Japan), South America (Brazil and Argentina), Middle East and Africa (South Africa, Saudi Arabia, and UAE), and Rest of World (ROW)

Organic Soy Protein Market Analysis, Size, and Forecast 2025-2029:
North America (US, Canada, and Mexico), Europe (Germany, UK, and France), APAC (China, India, and Japan), South America (Brazil and Argentina), Middle East and Africa (South Africa, Saudi Arabia, and UAE), and Rest of World (ROW)

Published: Dec 2025 293 Pages SKU: IRTNTR73993

Market Overview at a Glance

$392.5 Mn
Market Opportunity
14.9%
CAGR 2024 - 2029
37.9%
North America Growth
$189.9 Mn
Concentrates segment 2023

Organic Soy Protein Market Size 2025-2029

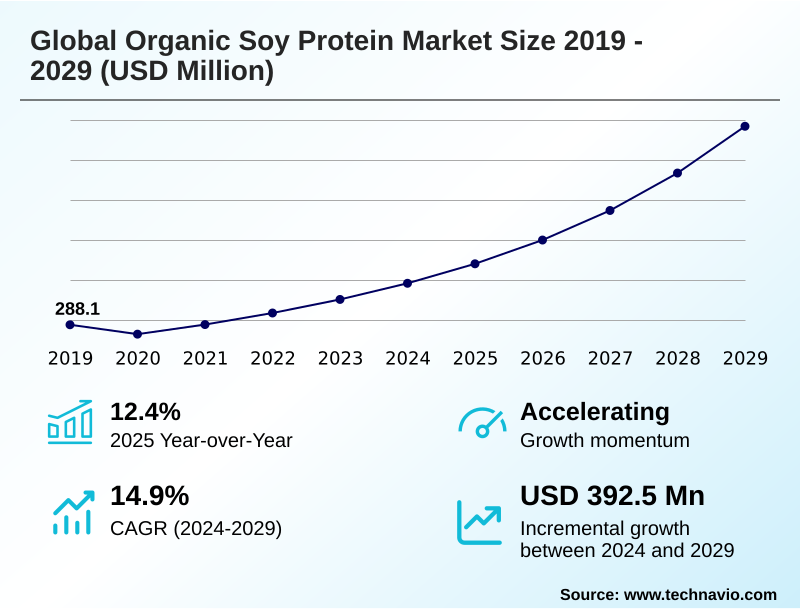
The organic soy protein market size is valued to increase by USD 392.5 million, at a CAGR of 14.9% from 2024 to 2029. Convergence of health, sustainability, and clean-label consumerism will drive the organic soy protein market.

Major Market Trends & Insights

  • North America dominated the market and accounted for a 37.9% growth during the forecast period.
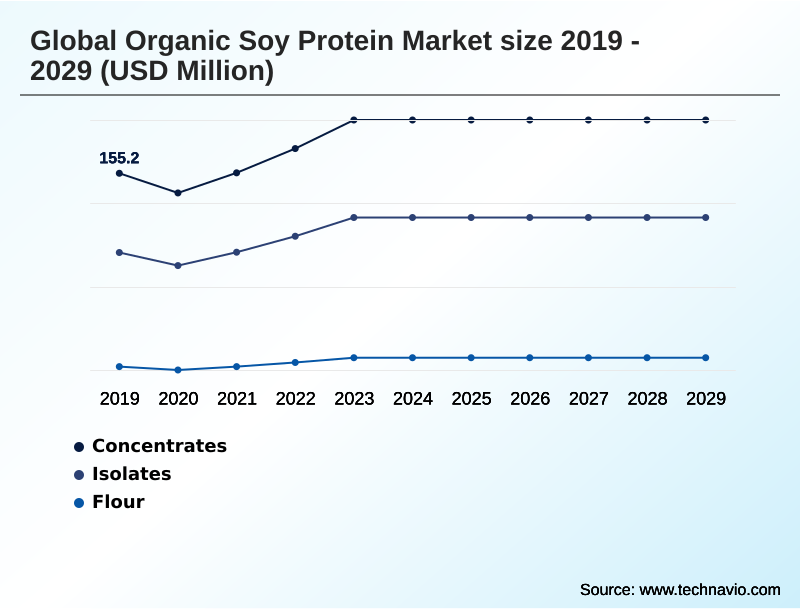
  • By Type - Concentrates segment was valued at USD 189.9 million in 2023
  • By Application - Functional foods segment accounted for the largest market revenue share in 2023

Market Size & Forecast

  • Market Opportunities: USD 496.2 million
  • Market Future Opportunities: USD 392.5 million
  • CAGR from 2024 to 2029 : 14.9%

Market Summary

  • The organic soy protein market is defined by its role as a premier plant-based protein source for health-conscious consumers. Growth is fundamentally tied to the increasing demand for clean-label soy ingredients that are non-gmo and produced via certified organic farming practices.
  • This shift fuels the adoption of soy protein isolates and concentrates across diverse applications, from meat analogue ingredient formulations to bakery product fortification. A significant trend involves technological advancements in the aqueous extraction process and membrane filtration technology, aimed at improving soy protein functionality, such as water binding capacity and emulsification properties, while minimizing off-flavors.
  • However, the market grapples with supply chain complexities, including maintaining identity preservation systems and ensuring sustainable soy sourcing. For instance, a food manufacturer relying on textured soy protein for a new product line must navigate potential price volatility and supply inconsistencies, making robust supplier verification and multi-sourcing strategies critical for maintaining production continuity and cost control.
  • This underscores the need for advanced traceability in the soy supply chain to meet both regulatory and consumer expectations.

What will be the Size of the Organic Soy Protein Market during the forecast period?

Get Key Insights on Market Forecast (PDF) Request Free Sample

How is the Organic Soy Protein Market Segmented?

The organic soy protein industry research report provides comprehensive data (region-wise segment analysis), with forecasts and estimates in "USD million" for the period 2025-2029, as well as historical data from 2019-2023 for the following segments.

  • Type
    • Concentrates
    • Isolates
    • Flour
  • Application
    • Functional foods
    • Meat alternatives
    • Bakery and confectionery
    • Infant formula
    • Others
  • Product type
    • Dry
    • Liquid
  • Geography
    • North America
      • US
      • Canada
      • Mexico
    • Europe
      • Germany
      • UK
      • France
    • APAC
      • China
      • India
      • Japan
    • South America
      • Brazil
      • Argentina
    • Middle East and Africa
      • South Africa
      • Saudi Arabia
      • UAE
    • Rest of World (ROW)

By Type Insights

The concentrates segment is estimated to witness significant growth during the forecast period.

The market is segmented by type, including isolates, flour, and concentrates. Soy protein concentrates are a pivotal segment, produced from defatted soy flour via soy protein extraction technology like aqueous extraction.

This plant-based protein source has a protein content typically ranging from 65% to 70% and retains beneficial fiber, unlike more refined isolates.

Its favorable protein digestibility corrected amino acid score (pdcaas) and controlled soy isoflavone content meet rising food and beverage industry demand. The functional properties, including water binding capacity and emulsification, make it a key meat analogue ingredient.

While addressing anti-nutritional factors in soy remains a focus, concentrates offer a cost-effective choice for functional food formulation and bakery product fortification.

Request Free Sample

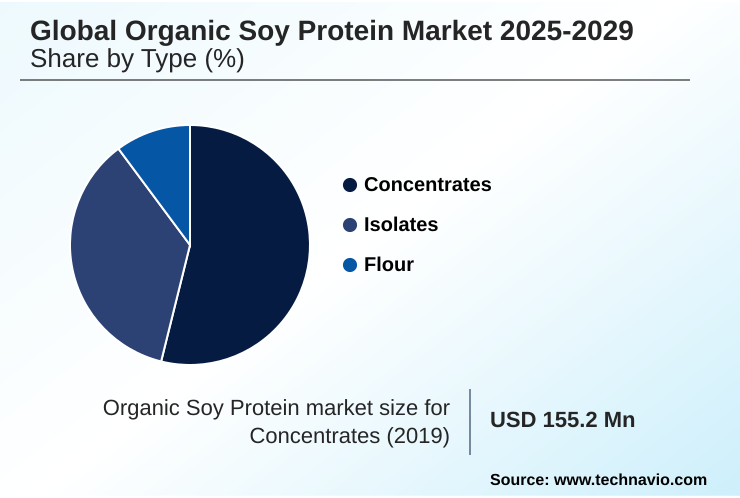
The Concentrates segment was valued at USD 189.9 million in 2023 and showed a gradual increase during the forecast period.

Request Free Sample

Regional Analysis

North America is estimated to contribute 37.9% to the growth of the global market during the forecast period.Technavio’s analysts have elaborately explained the regional trends and drivers that shape the market during the forecast period.

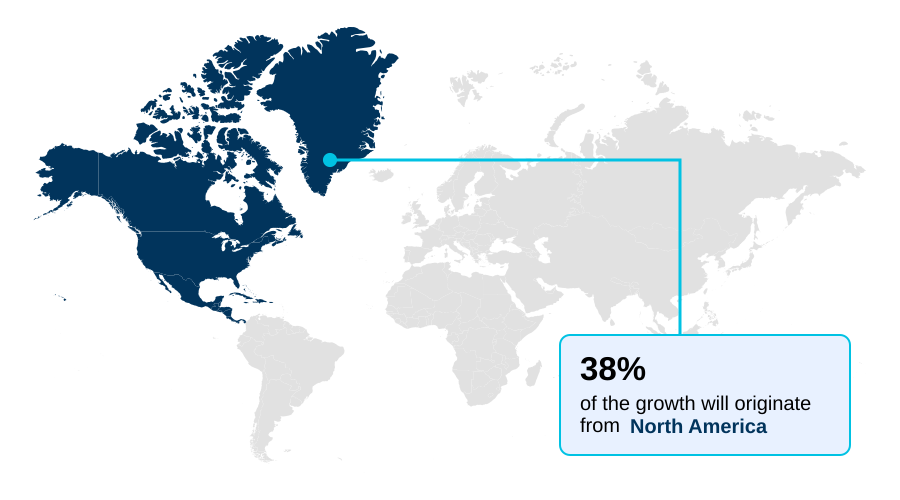
See How Organic Soy Protein Market Demand is Rising in North America Request Free Sample

The geographic landscape is led by North America, accounting for approximately 38% of the market opportunity, driven by demand for products highlighting soy protein fortification benefits.

Europe follows at 25%, with a mature industry focused on sustainable soy sourcing for dairy alternative protein. APAC contributes over 23%, showing rapid growth in infant formula soy protein.

Across regions, the focus is on maximizing soy protein nutritional value in functional food formulation. Processors are adopting advanced membrane filtration technology, which increases protein purity by up to 5%, to produce neutral-flavored soy protein ideal for sports nutrition.

This focus on quality and operational efficiency, including bakery product fortification, is essential for meeting diverse regional demands.
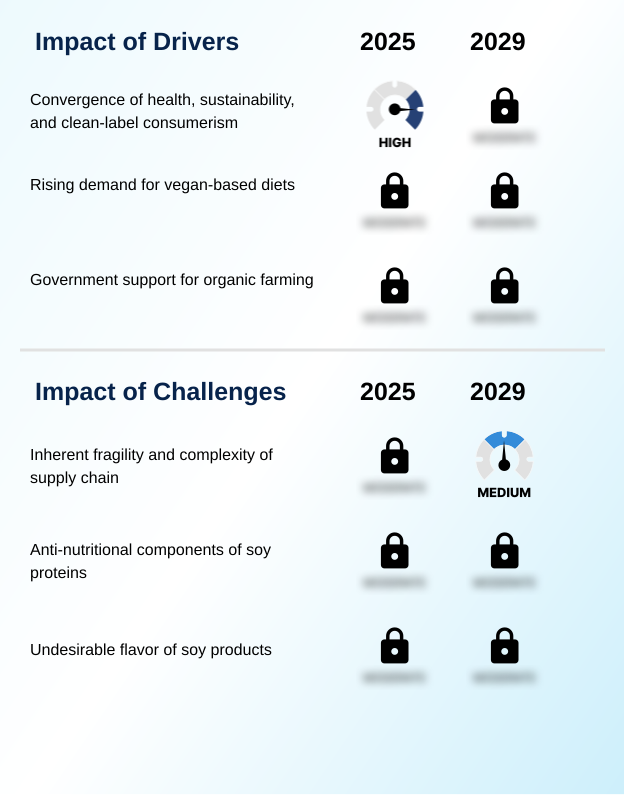
Market Dynamics

Our researchers analyzed the data with 2024 as the base year, along with the key drivers, trends, and challenges. A holistic analysis of drivers will help companies refine their marketing strategies to gain a competitive advantage.

  • Strategic decisions in the food industry increasingly revolve around ingredient selection, with a focus on plant-based options. The application of organic soy protein in functional foods is expanding, driven by growing awareness of soy protein's role in heart health. For manufacturers, improving texture with textured soy protein is key for success in the competitive market for meat alternatives.
  • Similarly, the use of organic soy flour in bakery products offers a way to enhance nutritional profiles. A critical consideration is the specific protein type; organic soy isolates for infant nutrition must meet the highest purity standards, whereas the benefits of soy protein concentrate, such as its excellent water binding capacity of concentrates, make it ideal for other applications.
  • Companies are conducting detailed cost analysis of soy protein types to optimize formulations. For brands targeting consumers on high-protein diets, using non-gmo soy protein for beverages requires advanced flavor masking techniques for soy protein to ensure palatability. Supply chain management is crucial, involving clean-label organic soy protein sourcing and a commitment to the sustainable farming of organic soybeans.
  • Furthermore, the debate of organic soy protein versus pea protein continues, pushing formulators to master the best practices for soy protein formulation. A key operational focus is managing allergens in soy ingredients, with stringent protocols reducing cross-contamination incidents by over 95% compared to standard procedures.
  • This diligence is vital as soy protein in dairy-free products and organic soy protein for clinical nutrition become more mainstream.

What are the key market drivers leading to the rise in the adoption of Organic Soy Protein Industry?

  • The primary market driver is the convergence of consumer demand for health, sustainability, and clean-label products.

  • The primary driver is the growing consumer alignment with health, wellness, and sustainability, which elevates demand for sustainable plant protein ingredients.
  • The market for organic soy for infant nutrition and other sensitive applications is expanding, pushing for the development of hypoallergenic soy protein.
  • The complete amino acid profile of soy protein concentrates, derived from defatted soy flour, makes it a favored ingredient. Innovations in the aqueous extraction process and membrane filtration technology have improved protein yields by up to 8%, reducing waste.
  • This aligns with the demand for clean-label plant protein options, particularly in applications like organic soy protein for beverages.
  • The superior water binding capacity of these proteins is essential for texture in soy protein in meat alternatives, directly contributing to consumer acceptance.

What are the market trends shaping the Organic Soy Protein Industry?

  • A key market trend is the focus on technological innovations designed to enhance ingredient functionality, purity, and sustainability. This creates a new generation of high-performance organic soy proteins.

  • A defining market trend is the intense focus on technological innovation to enhance soy protein functionality. As the demand for organic soy protein for vegan diets grows, advancements in the soy protein manufacturing process are critical. Processors are refining methods to create superior soy protein isolates and textured soy protein from certified organic soybeans.
  • This results in clean-label soy ingredients with improved emulsification properties, enabling formulators to create better plant-based products. For example, new techniques have improved protein solubility by 15%, expanding applications. The debate over organic soy protein isolates vs concentrates informs product development, as manufacturers seek the optimal balance of purity and cost.
  • These innovations in the functional properties of soy protein have directly led to a 20% reduction in the use of synthetic binders in certain food systems.

What challenges does the Organic Soy Protein Industry face during its growth?

  • The inherent fragility and complexity of the organic soybean supply chain presents a key challenge to market growth and stability.

  • A significant market challenge is the complexity of soy protein supply chain management, particularly concerning sustainable soy sourcing. Maintaining a robust identity preservation system is paramount for ensuring traceability in the soy supply chain, a non-negotiable for organic certification. This complexity contributes to organic soy protein price trends, which can be volatile.
  • For manufacturers, ensuring proper allergen labeling for soy products is a critical compliance hurdle, driving investment in producing allergen-free soy protein where feasible. On the product development side, improving soy protein taste and optimizing gelation characteristics remain key R&D goals, especially for soy protein in bakery applications.
  • Advanced processes like enzymatic hydrolysis of soy can improve digestibility but add costs, with an estimated 10% increase in processing expenses for certain applications.

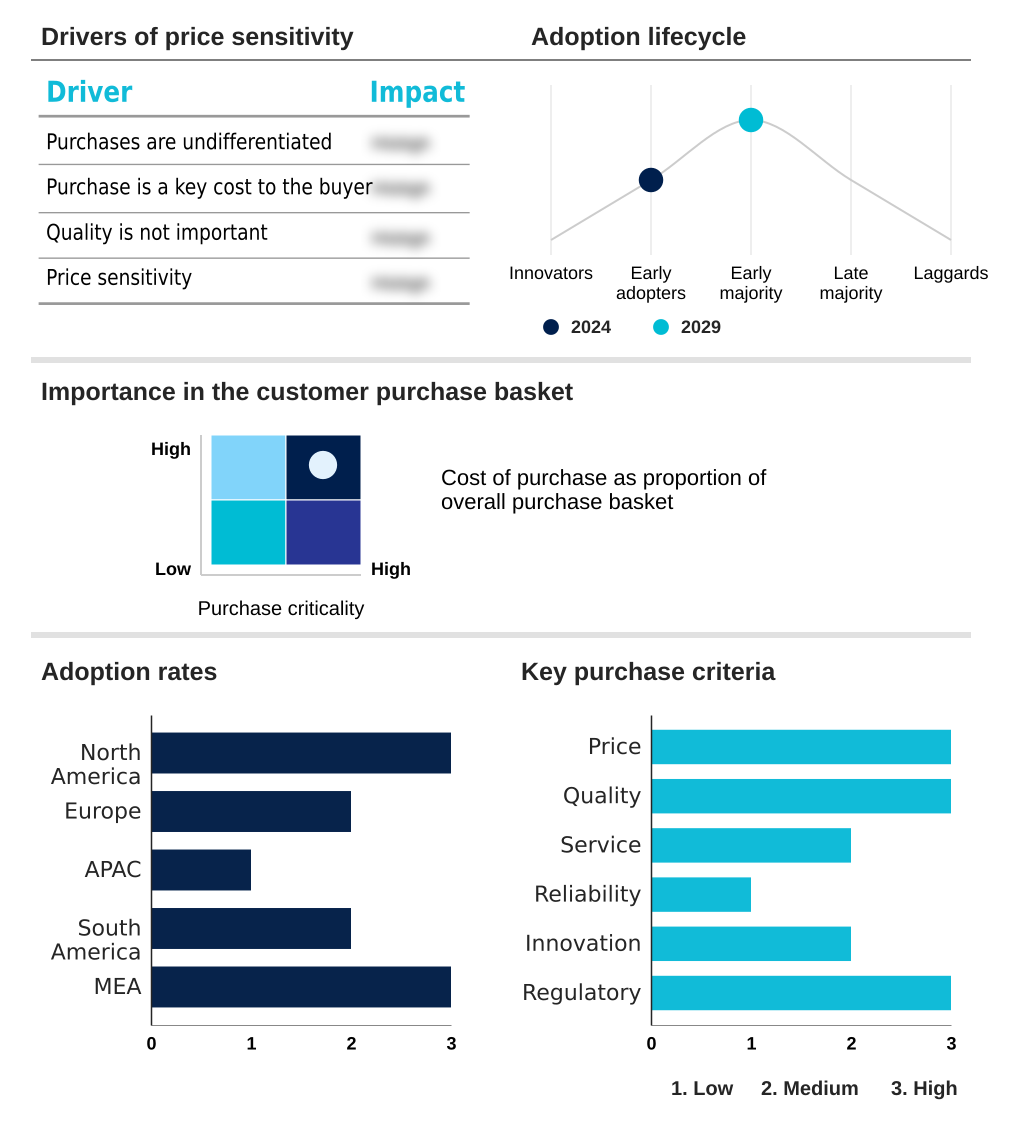
Exclusive Technavio Analysis on Customer Landscape

The organic soy protein market forecasting report includes the adoption lifecycle of the market, covering from the innovator’s stage to the laggard’s stage. It focuses on adoption rates in different regions based on penetration. Furthermore, the organic soy protein market report also includes key purchase criteria and drivers of price sensitivity to help companies evaluate and develop their market growth analysis strategies.

Customer Landscape of Organic Soy Protein Industry

Competitive Landscape

Companies are implementing various strategies, such as strategic alliances, organic soy protein market forecast, partnerships, mergers and acquisitions, geographical expansion, and product/service launches, to enhance their presence in the industry.

Archer Daniels Midland Co. - Key offerings include organic soy protein isolates and concentrates engineered for human and animal nutrition, emphasizing functional performance and clean-label appeal in food systems.

The industry research and growth report includes detailed analyses of the competitive landscape of the market and information about key companies, including:

  • Archer Daniels Midland Co.
  • Cargill Inc.
  • CHS Inc.
  • Eurosoy GmbH
  • Farbest Brands
  • Foodchem International Corp.
  • Grain Millers Inc.
  • Guanxian Xinrui Industrial
  • Guzen Development
  • Louis Dreyfus Co. BV
  • Puris
  • Shandong Yuxin Biotechnology
  • Shiv Health Foods LLP
  • Sonic Biochem Extraction
  • SunOpta Inc.
  • Taj Agro International
  • The Scoular Co.
  • Van Wankum Ingredients BV
  • Wilmar International Ltd.

Qualitative and quantitative analysis of companies has been conducted to help clients understand the wider business environment as well as the strengths and weaknesses of key industry players. Data is qualitatively analyzed to categorize companies as pure play, category-focused, industry-focused, and diversified; it is quantitatively analyzed to categorize companies as dominant, leading, strong, tentative, and weak.

Recent Development and News in Organic soy protein market

  • In September, 2024, Archer Daniels Midland Co. announced the expansion of its soy protein production facility in Decatur, Illinois, to increase its capacity for organic soy protein concentrates and isolates by 30%, citing rising demand from the meat alternatives and nutritional beverage sectors (Source: ADM Press Release).
  • In November, 2024, Puris launched its new line of clean-taste organic soy protein isolates, Puris IP-90, developed using a proprietary membrane filtration technology to minimize off-flavors and improve solubility for beverage applications (Source: Puris Website News).
  • In January, 2025, Cargill Inc. completed the acquisition of a European-based organic soybean processing plant to strengthen its supply chain for organic soy ingredients in the region and better serve its food manufacturing clients (Source: Bloomberg).
  • In April, 2025, SunOpta Inc. entered a strategic partnership with a leading plant-based food brand to become the exclusive supplier of organic soy protein for their next generation of dairy-free yogurt and cheese products (Source: Reuters).

Dive into Technavio’s robust research methodology, blending expert interviews, extensive data synthesis, and validated models for unparalleled Organic Soy Protein Market insights. See full methodology.

Market Scope
Page number 293
Base year 2024
Historic period 2019-2023
Forecast period 2025-2029
Growth momentum & CAGR Accelerate at a CAGR of 14.9%
Market growth 2025-2029 USD 392.5 million
Market structure Fragmented
YoY growth 2024-2025(%) 12.4%
Key countries US, Canada, Mexico, Germany, UK, France, Italy, Spain, Russia, China, India, Japan, South Korea, Australia, Indonesia, Brazil, Argentina, Chile, South Africa, Saudi Arabia, UAE, Egypt and Israel
Competitive landscape Leading Companies, Market Positioning of Companies, Competitive Strategies, and Industry Risks

Request Free Sample

Research Analyst Overview

  • The market's evolution is centered on enhancing soy protein functionality for a range of applications, from infant formula soy protein to bakery product fortification. Advances in the aqueous extraction process and membrane filtration technology are yielding higher purity soy protein isolates and soy protein concentrates.
  • This push for technological superiority directly impacts boardroom strategy, as investment in R&D for hypoallergenic soy protein or enzymatic hydrolysis of soy becomes a key differentiator. For instance, companies that perfected soy protein texturization for meat analogue ingredient applications have seen a 20% faster adoption rate by major food brands.
  • The entire value chain, from sustainable soy sourcing and organic farming practices to the final spray drying process for soy protein, is under scrutiny. Board-level decisions now hinge on managing the identity preservation system and ensuring complete traceability in the soy supply chain to validate non-gmo soy protein claims and manage soy isoflavone content.
  • This focus extends to addressing anti-nutritional factors in soy and investing in soy protein flavor masking, which is critical for formulating palatable dairy alternative protein products and options for soy protein for sports nutrition.
  • The ultimate goal is to deliver a clean-label soy ingredient with a complete amino acid profile and a high protein digestibility corrected amino acid score (pdcaas), balancing soy protein nutritional value with superior water binding capacity, emulsification properties, and gelation characteristics in functional food formulation.

What are the Key Data Covered in this Organic Soy Protein Market Research and Growth Report?

  • What is the expected growth of the Organic Soy Protein Market between 2025 and 2029?

    • USD 392.5 million, at a CAGR of 14.9%

  • What segmentation does the market report cover?

    • The report is segmented by Type (Concentrates, Isolates, and Flour), Application (Functional foods, Meat alternatives, Bakery and confectionery, Infant formula, and Others), Product Type (Dry, and Liquid) and Geography (North America, Europe, APAC, South America, Middle East and Africa)

  • Which regions are analyzed in the report?

    • North America, Europe, APAC, South America and Middle East and Africa

  • What are the key growth drivers and market challenges?

    • Convergence of health, sustainability, and clean-label consumerism, Inherent fragility and complexity of supply chain

  • Who are the major players in the Organic Soy Protein Market?

    • Archer Daniels Midland Co., Cargill Inc., CHS Inc., Eurosoy GmbH, Farbest Brands, Foodchem International Corp., Grain Millers Inc., Guanxian Xinrui Industrial, Guzen Development, Louis Dreyfus Co. BV, Puris, Shandong Yuxin Biotechnology, Shiv Health Foods LLP, Sonic Biochem Extraction, SunOpta Inc., Taj Agro International, The Scoular Co., Van Wankum Ingredients BV and Wilmar International Ltd.

Market Research Insights

  • The market's dynamism is driven by evolving food and beverage industry demand for high-quality, sustainable plant protein ingredients. As consumer preferences shift, the focus on the health benefits of organic soy intensifies, particularly its role in cholesterol reduction.
  • Innovations in the soy protein manufacturing process have led to significant functional improvements; for example, advancements in extraction technology have enhanced soy protein isolates' solubility by up to 25%, making them ideal for beverages. Furthermore, new flavor-masking techniques for improving soy protein taste have reduced the need for secondary additives in formulations by 15%, aligning with clean-label plant protein options.
  • This progress is crucial as organic soy protein for functional foods and meat alternatives requires superior sensory profiles. Managing the soy protein supply chain remains a key operational focus, with robust protocols cutting spoilage rates by over 10% and ensuring consistent quality.

We can help! Our analysts can customize this organic soy protein market research report to meet your requirements.

Get in touch

1. Executive Summary

1.1 Market overview

Executive Summary - Chart on Market Overview
Executive Summary - Data Table on Market Overview
Executive Summary - Chart on Global Market Characteristics
Executive Summary - Chart on Market by Geography
Executive Summary - Chart on Market Segmentation by Type
Executive Summary - Chart on Market Segmentation by Application
Executive Summary - Chart on Market Segmentation by Product Type
Executive Summary - Chart on Incremental Growth
Executive Summary - Data Table on Incremental Growth
Executive Summary - Chart on Company Market Positioning

2. Technavio Analysis

2.1 Analysis of price sensitivity, lifecycle, customer purchase basket, adoption rates, and purchase criteria

2.2 Criticality of inputs and Factors of differentiation

Chart on Overview on criticality of inputs and factors of differentiation

2.3 Factors of disruption

Chart on Overview on factors of disruption

2.4 Impact of drivers and challenges

Chart on Impact of drivers and challenges in 2024 and 2029

3. Market Landscape

3.1 Market ecosystem

Chart on Parent Market
Data Table on - Parent Market

3.2 Market characteristics

Chart on Market characteristics analysis

3.3 Value chain analysis

Chart on Value chain analysis

4. Market Sizing

4.1 Market definition

Data Table on Offerings of companies included in the market definition

4.2 Market segment analysis

Market segments

4.3 Market size 2024

4.4 Market outlook: Forecast for 2024-2029

Chart on Global - Market size and forecast 2024-2029 ($ million)
Data Table on Global - Market size and forecast 2024-2029 ($ million)
Chart on Global Market: Year-over-year growth 2024-2029 (%)
Data Table on Global Market: Year-over-year growth 2024-2029 (%)

5. Historic Market Size

5.1 Global Organic Soy Protein Market 2019 - 2023

Historic Market Size - Data Table on Global Organic Soy Protein Market 2019 - 2023 ($ million)

5.2 Type segment analysis 2019 - 2023

Historic Market Size - Type Segment 2019 - 2023 ($ million)

5.3 Application segment analysis 2019 - 2023

Historic Market Size - Application Segment 2019 - 2023 ($ million)

5.4 Product Type segment analysis 2019 - 2023

Historic Market Size - Product Type Segment 2019 - 2023 ($ million)

5.5 Geography segment analysis 2019 - 2023

Historic Market Size - Geography Segment 2019 - 2023 ($ million)

5.6 Country segment analysis 2019 - 2023

Historic Market Size - Country Segment 2019 - 2023 ($ million)

6. Qualitative Analysis

6.1 The AI impact on the Global Organic Soy Protein Market

7. Five Forces Analysis

7.1 Five forces summary

Five forces analysis - Comparison between 2024 and 2029

7.2 Bargaining power of buyers

Bargaining power of buyers - Impact of key factors 2024 and 2029

7.3 Bargaining power of suppliers

Bargaining power of suppliers - Impact of key factors in 2024 and 2029

7.4 Threat of new entrants

Threat of new entrants - Impact of key factors in 2024 and 2029

7.5 Threat of substitutes

Threat of substitutes - Impact of key factors in 2024 and 2029

7.6 Threat of rivalry

Threat of rivalry - Impact of key factors in 2024 and 2029

7.7 Market condition

Chart on Market condition - Five forces 2024 and 2029

8. Market Segmentation by Type

8.1 Market segments

Chart on Type - Market share 2024-2029 (%)
Data Table on Type - Market share 2024-2029 (%)

8.2 Comparison by Type

Chart on Comparison by Type
Data Table on Comparison by Type

8.3 Concentrates - Market size and forecast 2024-2029

Chart on Concentrates - Market size and forecast 2024-2029 ($ million)
Data Table on Concentrates - Market size and forecast 2024-2029 ($ million)
Chart on Concentrates - Year-over-year growth 2024-2029 (%)
Data Table on Concentrates - Year-over-year growth 2024-2029 (%)

8.4 Isolates - Market size and forecast 2024-2029

Chart on Isolates - Market size and forecast 2024-2029 ($ million)
Data Table on Isolates - Market size and forecast 2024-2029 ($ million)
Chart on Isolates - Year-over-year growth 2024-2029 (%)
Data Table on Isolates - Year-over-year growth 2024-2029 (%)

8.5 Flour - Market size and forecast 2024-2029

Chart on Flour - Market size and forecast 2024-2029 ($ million)
Data Table on Flour - Market size and forecast 2024-2029 ($ million)
Chart on Flour - Year-over-year growth 2024-2029 (%)
Data Table on Flour - Year-over-year growth 2024-2029 (%)

8.6 Market opportunity by Type

Market opportunity by Type ($ million)
Data Table on Market opportunity by Type ($ million)

9. Market Segmentation by Application

9.1 Market segments

Chart on Application - Market share 2024-2029 (%)
Data Table on Application - Market share 2024-2029 (%)

9.2 Comparison by Application

Chart on Comparison by Application
Data Table on Comparison by Application

9.3 Functional foods - Market size and forecast 2024-2029

Chart on Functional foods - Market size and forecast 2024-2029 ($ million)
Data Table on Functional foods - Market size and forecast 2024-2029 ($ million)
Chart on Functional foods - Year-over-year growth 2024-2029 (%)
Data Table on Functional foods - Year-over-year growth 2024-2029 (%)

9.4 Meat alternatives - Market size and forecast 2024-2029

Chart on Meat alternatives - Market size and forecast 2024-2029 ($ million)
Data Table on Meat alternatives - Market size and forecast 2024-2029 ($ million)
Chart on Meat alternatives - Year-over-year growth 2024-2029 (%)
Data Table on Meat alternatives - Year-over-year growth 2024-2029 (%)

9.5 Bakery and confectionery - Market size and forecast 2024-2029

Chart on Bakery and confectionery - Market size and forecast 2024-2029 ($ million)
Data Table on Bakery and confectionery - Market size and forecast 2024-2029 ($ million)
Chart on Bakery and confectionery - Year-over-year growth 2024-2029 (%)
Data Table on Bakery and confectionery - Year-over-year growth 2024-2029 (%)

9.6 Infant formula - Market size and forecast 2024-2029

Chart on Infant formula - Market size and forecast 2024-2029 ($ million)
Data Table on Infant formula - Market size and forecast 2024-2029 ($ million)
Chart on Infant formula - Year-over-year growth 2024-2029 (%)
Data Table on Infant formula - Year-over-year growth 2024-2029 (%)

9.7 Others - Market size and forecast 2024-2029

Chart on Others - Market size and forecast 2024-2029 ($ million)
Data Table on Others - Market size and forecast 2024-2029 ($ million)
Chart on Others - Year-over-year growth 2024-2029 (%)
Data Table on Others - Year-over-year growth 2024-2029 (%)

9.8 Market opportunity by Application

Market opportunity by Application ($ million)
Data Table on Market opportunity by Application ($ million)

10. Market Segmentation by Product Type

10.1 Market segments

Chart on Product Type - Market share 2024-2029 (%)
Data Table on Product Type - Market share 2024-2029 (%)

10.2 Comparison by Product Type

Chart on Comparison by Product Type
Data Table on Comparison by Product Type

10.3 Dry - Market size and forecast 2024-2029

Chart on Dry - Market size and forecast 2024-2029 ($ million)
Data Table on Dry - Market size and forecast 2024-2029 ($ million)
Chart on Dry - Year-over-year growth 2024-2029 (%)
Data Table on Dry - Year-over-year growth 2024-2029 (%)

10.4 Liquid - Market size and forecast 2024-2029

Chart on Liquid - Market size and forecast 2024-2029 ($ million)
Data Table on Liquid - Market size and forecast 2024-2029 ($ million)
Chart on Liquid - Year-over-year growth 2024-2029 (%)
Data Table on Liquid - Year-over-year growth 2024-2029 (%)

10.5 Market opportunity by Product Type

Market opportunity by Product Type ($ million)
Data Table on Market opportunity by Product Type ($ million)

11. Customer Landscape

11.1 Customer landscape overview

Analysis of price sensitivity, lifecycle, customer purchase basket, adoption rates, and purchase criteria

12. Geographic Landscape

12.1 Geographic segmentation

Chart on Market share by geography 2024-2029 (%)
Data Table on Market share by geography 2024-2029 (%)

12.2 Geographic comparison

Chart on Geographic comparison
Data Table on Geographic comparison

12.3 North America - Market size and forecast 2024-2029

Chart on North America - Market size and forecast 2024-2029 ($ million)
Data Table on North America - Market size and forecast 2024-2029 ($ million)
Chart on North America - Year-over-year growth 2024-2029 (%)
Data Table on North America - Year-over-year growth 2024-2029 (%)
Chart on Regional Comparison - North America
Data Table on Regional Comparison - North America

12.3.1 US - Market size and forecast 2024-2029

Chart on US - Market size and forecast 2024-2029 ($ million)
Data Table on US - Market size and forecast 2024-2029 ($ million)
Chart on US - Year-over-year growth 2024-2029 (%)
Data Table on US - Year-over-year growth 2024-2029 (%)

12.3.2 Canada - Market size and forecast 2024-2029

Chart on Canada - Market size and forecast 2024-2029 ($ million)
Data Table on Canada - Market size and forecast 2024-2029 ($ million)
Chart on Canada - Year-over-year growth 2024-2029 (%)
Data Table on Canada - Year-over-year growth 2024-2029 (%)

12.3.3 Mexico - Market size and forecast 2024-2029

Chart on Mexico - Market size and forecast 2024-2029 ($ million)
Data Table on Mexico - Market size and forecast 2024-2029 ($ million)
Chart on Mexico - Year-over-year growth 2024-2029 (%)
Data Table on Mexico - Year-over-year growth 2024-2029 (%)

12.4 Europe - Market size and forecast 2024-2029

Chart on Europe - Market size and forecast 2024-2029 ($ million)
Data Table on Europe - Market size and forecast 2024-2029 ($ million)
Chart on Europe - Year-over-year growth 2024-2029 (%)
Data Table on Europe - Year-over-year growth 2024-2029 (%)
Chart on Regional Comparison - Europe
Data Table on Regional Comparison - Europe

12.4.1 Germany - Market size and forecast 2024-2029

Chart on Germany - Market size and forecast 2024-2029 ($ million)
Data Table on Germany - Market size and forecast 2024-2029 ($ million)
Chart on Germany - Year-over-year growth 2024-2029 (%)
Data Table on Germany - Year-over-year growth 2024-2029 (%)

12.4.2 UK - Market size and forecast 2024-2029

Chart on UK - Market size and forecast 2024-2029 ($ million)
Data Table on UK - Market size and forecast 2024-2029 ($ million)
Chart on UK - Year-over-year growth 2024-2029 (%)
Data Table on UK - Year-over-year growth 2024-2029 (%)

12.4.3 France - Market size and forecast 2024-2029

Chart on France - Market size and forecast 2024-2029 ($ million)
Data Table on France - Market size and forecast 2024-2029 ($ million)
Chart on France - Year-over-year growth 2024-2029 (%)
Data Table on France - Year-over-year growth 2024-2029 (%)

12.4.4 Italy - Market size and forecast 2024-2029

Chart on Italy - Market size and forecast 2024-2029 ($ million)
Data Table on Italy - Market size and forecast 2024-2029 ($ million)
Chart on Italy - Year-over-year growth 2024-2029 (%)
Data Table on Italy - Year-over-year growth 2024-2029 (%)

12.4.5 Spain - Market size and forecast 2024-2029

Chart on Spain - Market size and forecast 2024-2029 ($ million)
Data Table on Spain - Market size and forecast 2024-2029 ($ million)
Chart on Spain - Year-over-year growth 2024-2029 (%)
Data Table on Spain - Year-over-year growth 2024-2029 (%)

12.4.6 Russia - Market size and forecast 2024-2029

Chart on Russia - Market size and forecast 2024-2029 ($ million)
Data Table on Russia - Market size and forecast 2024-2029 ($ million)
Chart on Russia - Year-over-year growth 2024-2029 (%)
Data Table on Russia - Year-over-year growth 2024-2029 (%)

12.5 APAC - Market size and forecast 2024-2029

Chart on APAC - Market size and forecast 2024-2029 ($ million)
Data Table on APAC - Market size and forecast 2024-2029 ($ million)
Chart on APAC - Year-over-year growth 2024-2029 (%)
Data Table on APAC - Year-over-year growth 2024-2029 (%)
Chart on Regional Comparison - APAC
Data Table on Regional Comparison - APAC

12.5.1 China - Market size and forecast 2024-2029

Chart on China - Market size and forecast 2024-2029 ($ million)
Data Table on China - Market size and forecast 2024-2029 ($ million)
Chart on China - Year-over-year growth 2024-2029 (%)
Data Table on China - Year-over-year growth 2024-2029 (%)

12.5.2 India - Market size and forecast 2024-2029

Chart on India - Market size and forecast 2024-2029 ($ million)
Data Table on India - Market size and forecast 2024-2029 ($ million)
Chart on India - Year-over-year growth 2024-2029 (%)
Data Table on India - Year-over-year growth 2024-2029 (%)

12.5.3 Japan - Market size and forecast 2024-2029

Chart on Japan - Market size and forecast 2024-2029 ($ million)
Data Table on Japan - Market size and forecast 2024-2029 ($ million)
Chart on Japan - Year-over-year growth 2024-2029 (%)
Data Table on Japan - Year-over-year growth 2024-2029 (%)

12.5.4 South Korea - Market size and forecast 2024-2029

Chart on South Korea - Market size and forecast 2024-2029 ($ million)
Data Table on South Korea - Market size and forecast 2024-2029 ($ million)
Chart on South Korea - Year-over-year growth 2024-2029 (%)
Data Table on South Korea - Year-over-year growth 2024-2029 (%)

12.5.5 Australia - Market size and forecast 2024-2029

Chart on Australia - Market size and forecast 2024-2029 ($ million)
Data Table on Australia - Market size and forecast 2024-2029 ($ million)
Chart on Australia - Year-over-year growth 2024-2029 (%)
Data Table on Australia - Year-over-year growth 2024-2029 (%)

12.5.6 Indonesia - Market size and forecast 2024-2029

Chart on Indonesia - Market size and forecast 2024-2029 ($ million)
Data Table on Indonesia - Market size and forecast 2024-2029 ($ million)
Chart on Indonesia - Year-over-year growth 2024-2029 (%)
Data Table on Indonesia - Year-over-year growth 2024-2029 (%)

12.6 South America - Market size and forecast 2024-2029

Chart on South America - Market size and forecast 2024-2029 ($ million)
Data Table on South America - Market size and forecast 2024-2029 ($ million)
Chart on South America - Year-over-year growth 2024-2029 (%)
Data Table on South America - Year-over-year growth 2024-2029 (%)
Chart on Regional Comparison - South America
Data Table on Regional Comparison - South America

12.6.1 Brazil - Market size and forecast 2024-2029

Chart on Brazil - Market size and forecast 2024-2029 ($ million)
Data Table on Brazil - Market size and forecast 2024-2029 ($ million)
Chart on Brazil - Year-over-year growth 2024-2029 (%)
Data Table on Brazil - Year-over-year growth 2024-2029 (%)

12.6.2 Argentina - Market size and forecast 2024-2029

Chart on Argentina - Market size and forecast 2024-2029 ($ million)
Data Table on Argentina - Market size and forecast 2024-2029 ($ million)
Chart on Argentina - Year-over-year growth 2024-2029 (%)
Data Table on Argentina - Year-over-year growth 2024-2029 (%)

12.6.3 Chile - Market size and forecast 2024-2029

Chart on Chile - Market size and forecast 2024-2029 ($ million)
Data Table on Chile - Market size and forecast 2024-2029 ($ million)
Chart on Chile - Year-over-year growth 2024-2029 (%)
Data Table on Chile - Year-over-year growth 2024-2029 (%)

12.7 Middle East and Africa - Market size and forecast 2024-2029

Chart on Middle East and Africa - Market size and forecast 2024-2029 ($ million)
Data Table on Middle East and Africa - Market size and forecast 2024-2029 ($ million)
Chart on Middle East and Africa - Year-over-year growth 2024-2029 (%)
Data Table on Middle East and Africa - Year-over-year growth 2024-2029 (%)
Chart on Regional Comparison - Middle East and Africa
Data Table on Regional Comparison - Middle East and Africa

12.7.1 South Africa - Market size and forecast 2024-2029

Chart on South Africa - Market size and forecast 2024-2029 ($ million)
Data Table on South Africa - Market size and forecast 2024-2029 ($ million)
Chart on South Africa - Year-over-year growth 2024-2029 (%)
Data Table on South Africa - Year-over-year growth 2024-2029 (%)

12.7.2 Saudi Arabia - Market size and forecast 2024-2029

Chart on Saudi Arabia - Market size and forecast 2024-2029 ($ million)
Data Table on Saudi Arabia - Market size and forecast 2024-2029 ($ million)
Chart on Saudi Arabia - Year-over-year growth 2024-2029 (%)
Data Table on Saudi Arabia - Year-over-year growth 2024-2029 (%)

12.7.3 UAE - Market size and forecast 2024-2029

Chart on UAE - Market size and forecast 2024-2029 ($ million)
Data Table on UAE - Market size and forecast 2024-2029 ($ million)
Chart on UAE - Year-over-year growth 2024-2029 (%)
Data Table on UAE - Year-over-year growth 2024-2029 (%)

12.7.4 Egypt - Market size and forecast 2024-2029

Chart on Egypt - Market size and forecast 2024-2029 ($ million)
Data Table on Egypt - Market size and forecast 2024-2029 ($ million)
Chart on Egypt - Year-over-year growth 2024-2029 (%)
Data Table on Egypt - Year-over-year growth 2024-2029 (%)

12.7.5 Israel - Market size and forecast 2024-2029

Chart on Israel - Market size and forecast 2024-2029 ($ million)
Data Table on Israel - Market size and forecast 2024-2029 ($ million)
Chart on Israel - Year-over-year growth 2024-2029 (%)
Data Table on Israel - Year-over-year growth 2024-2029 (%)

12.8 Market opportunity by geography

Market opportunity by geography ($ million)
Data Tables on Market opportunity by geography ($ million)

13. Drivers, Challenges, and Opportunity

13.1 Market drivers

Convergence of health, sustainability, and clean-label consumerism
Rising demand for vegan-based diets
Government support for organic farming

13.2 Market challenges

Inherent fragility and complexity of supply chain
Anti-nutritional components of soy proteins
Undesirable flavor of soy products

13.3 Impact of drivers and challenges

Impact of drivers and challenges in 2024 and 2029

13.4 Market opportunities

Technological innovations such as ingredient functionality, purity, and sustainability
Growth in online retail
Growing demand from food and beverage industry

14. Competitive Landscape

14.1 Overview

14.2

Overview on criticality of inputs and factors of differentiation

14.3 Landscape disruption

Overview on factors of disruption

14.4 Industry risks

Impact of key risks on business

15. Competitive Analysis

15.1 Companies profiled

Companies covered

15.2 Company ranking index

15.3 Market positioning of companies

Matrix on companies position and classification

15.4 Archer Daniels Midland Co.

Archer Daniels Midland Co. - Overview
Archer Daniels Midland Co. - Business segments
Archer Daniels Midland Co. - Key news
Archer Daniels Midland Co. - Key offerings
Archer Daniels Midland Co. - Segment focus
SWOT

15.5 Cargill Inc.

Cargill Inc. - Overview
Cargill Inc. - Product / Service
Cargill Inc. - Key offerings
SWOT

15.6 CHS Inc.

CHS Inc. - Overview
CHS Inc. - Business segments
CHS Inc. - Key offerings
CHS Inc. - Segment focus
SWOT

15.7 Eurosoy GmbH

Eurosoy GmbH - Overview
Eurosoy GmbH - Product / Service
Eurosoy GmbH - Key offerings
SWOT

15.8 Farbest Brands

Farbest Brands - Overview
Farbest Brands - Product / Service
Farbest Brands - Key offerings
SWOT

15.9 Foodchem International Corp.

Foodchem International Corp. - Overview
Foodchem International Corp. - Product / Service
Foodchem International Corp. - Key offerings
SWOT

15.10 Grain Millers Inc.

Grain Millers Inc. - Overview
Grain Millers Inc. - Product / Service
Grain Millers Inc. - Key offerings
SWOT

15.11 Louis Dreyfus Co. BV

Louis Dreyfus Co. BV - Overview
Louis Dreyfus Co. BV - Product / Service
Louis Dreyfus Co. BV - Key offerings
SWOT

15.12 Puris

Puris - Overview
Puris - Product / Service
Puris - Key offerings
SWOT

15.13 Sonic Biochem Extraction

Sonic Biochem Extraction - Overview
Sonic Biochem Extraction - Product / Service
Sonic Biochem Extraction - Key offerings
SWOT

15.14 SunOpta Inc.

SunOpta Inc. - Overview
SunOpta Inc. - Business segments
SunOpta Inc. - Key news
SunOpta Inc. - Key offerings
SunOpta Inc. - Segment focus
SWOT

15.15 Taj Agro International

Taj Agro International - Overview
Taj Agro International - Product / Service
Taj Agro International - Key offerings
SWOT

15.16 The Scoular Co.

The Scoular Co. - Overview
The Scoular Co. - Product / Service
The Scoular Co. - Key offerings
SWOT

15.17 Van Wankum Ingredients BV

Van Wankum Ingredients BV - Overview
Van Wankum Ingredients BV - Product / Service
Van Wankum Ingredients BV - Key offerings
SWOT

15.18 Wilmar International Ltd.

Wilmar International Ltd. - Overview
Wilmar International Ltd. - Business segments
Wilmar International Ltd. - Key offerings
Wilmar International Ltd. - Segment focus
SWOT

16. Appendix

16.1 Scope of the report

Market definition
Objectives
Notes and caveats

16.2 Inclusions and exclusions checklist

Inclusions checklist
Exclusions checklist

16.3 Currency conversion rates for US$

16.4 Research methodology

16.5 Data procurement

Information sources

16.6 Data validation

16.7 Validation techniques employed for market sizing

16.8 Data synthesis

16.9 360 degree market analysis

16.10 List of abbreviations

Research Methodology

Technavio presents a detailed picture of the market by way of study, synthesis, and summation of data from multiple sources. The analysts have presented the various facets of the market with a particular focus on identifying the key industry influencers. The data thus presented is comprehensive, reliable, and the result of extensive research, both primary and secondary.

INFORMATION SOURCES

Primary sources

  • Manufacturers and suppliers
  • Channel partners
  • Industry experts
  • Strategic decision makers

Secondary sources

  • Industry journals and periodicals
  • Government data
  • Financial reports of key industry players
  • Historical data
  • Press releases

DATA ANALYSIS

Data Synthesis

  • Collation of data
  • Estimation of key figures
  • Analysis of derived insights

Data Validation

  • Triangulation with data models
  • Reference against proprietary databases
  • Corroboration with industry experts

REPORT WRITING

Qualitative

  • Market drivers
  • Market challenges
  • Market trends
  • Five forces analysis

Quantitative

  • Market size and forecast
  • Market segmentation
  • Geographical insights
  • Competitive landscape

Interested in this report?

Get your sample now to see our research methodology and insights!

Download Now

Frequently Asked Questions

Organic Soy Protein market growth will increase by USD 392.5 million during 2025-2029.

The Organic Soy Protein market is expected to grow at a CAGR of 14.9% during 2025-2029.

Organic Soy Protein market is segmented by Type (Concentrates, Isolates, Flour) Application (Functional foods, Meat alternatives, Bakery and confectionery, Infant formula, Others) Product type (Dry, Liquid)

Archer Daniels Midland Co., Cargill Inc., CHS Inc., Eurosoy GmbH, Farbest Brands, Foodchem International Corp., Grain Millers Inc., Guanxian Xinrui Industrial, Guzen Development, Louis Dreyfus Co. BV, Puris, Shandong Yuxin Biotechnology, Shiv Health Foods LLP, Sonic Biochem Extraction, SunOpta Inc., Taj Agro International, The Scoular Co., Van Wankum Ingredients BV, Wilmar International Ltd. are a few of the key vendors in the Organic Soy Protein market.

North America will register the highest growth rate of 37.9% among the other regions. Therefore, the Organic Soy Protein market in North America is expected to garner significant business opportunities for the vendors during the forecast period.

US, Canada, Mexico, Germany, UK, France, Italy, Spain, Russia, China, India, Japan, South Korea, Australia, Indonesia, Brazil, Argentina, Chile, South Africa, Saudi Arabia, UAE, Egypt, Israel

  • Convergence of health, sustainability, and clean-label consumerism is the driving factor this market.

The Organic Soy Protein market vendors should focus on grabbing business opportunities from the Type segment as it accounted for the largest market share in the base year.