Ornamental Fish Feed Market Size 2024-2028
The ornamental fish feed market size is forecast to increase by USD 1.01 billion at a CAGR of 7.3% between 2023 and 2028.
- The market is experiencing significant growth due to increasing interest in keeping ornamental fish as pets. This trend is driven by the rising awareness of the health benefits associated with fishkeeping and the growing popularity of aquascaping. Additionally, advancements in feed formulations have led to the production of high-quality, nutrient-rich feeds that cater to the specific dietary needs of various species. The pet adoption trend, driven by the mental health benefits of owning a pet, is fueling the growth of the ornamental fish market. However, competition from live feed remains a challenge for market players. Producers must continually innovate to offer feeds that provide optimal nutrition while also being cost-effective and convenient for consumers. By addressing these challenges, the market is poised for continued expansion.
What will be the Size of the Ornamental Fish Feed Market During the Forecast Period?
- The market is experiencing strong growth due to the increasing popularity of aquariums as home decor and the rising trend of aquascaping in planted tanks. The market caters to various types of ornamental fish, including colorful tropical fishes, goldfish, exotic species, and invertebrates such as mollusks. The demand for processed feed, which offers convenience and consistent nutrition, is on the rise. However, a significant portion of the market continues to prefer live feed for its perceived natural benefits
- The market serves both store-based and non-store-based retail channels. Processed feed typically contains plant material, vegetable proteins, fishmeal, and wheat, while live food comprises worms, brine shrimp, and other aquatic organisms. The market's future looks promising, with ongoing research and development efforts focused on producing high-quality, nutritious feed for a diverse range of ornamental fish species.
How is this Ornamental Fish Feed Industry segmented and which is the largest segment?
The ornamental fish feed industry research report provides comprehensive data (region-wise segment analysis), with forecasts and estimates in "USD billion" for the period 2024-2028, as well as historical data from 2018-2022 for the following segments.
- End-user
- Household
- Commercial
- Aquaculture farms
- Distribution Channel
- Pet stores
- Online
- Aquarium stores
- Wholesale distributors
- Geography
- Europe
- Germany
- UK
- France
- Italy
- APAC
- China
- Japan
- Singapore
- North America
- US
- South America
- Middle East and Africa
- Europe
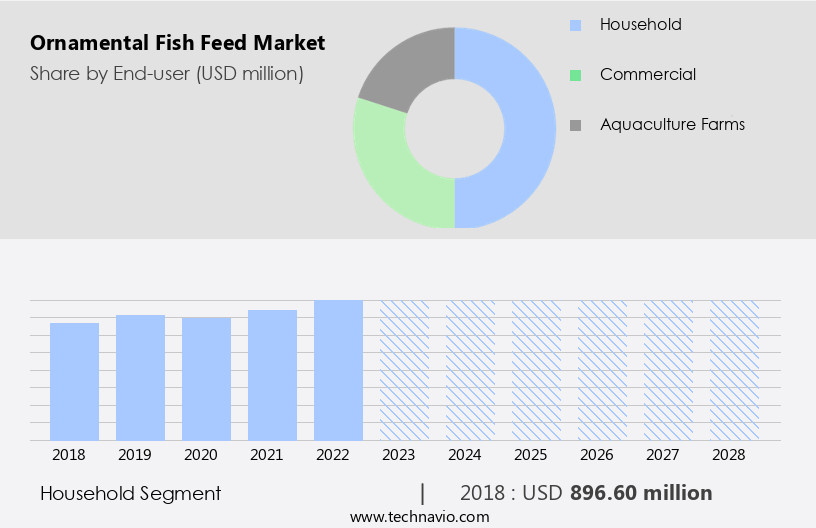
By End-user Insights
- The household segment is estimated to witness significant growth during the forecast period.
The household segment plays a significant role in driving demand within the market. Homeowners prioritize high-quality nutrition for their ornamental aquatic pets, ensuring their health, vibrancy, and longevity. This segment caters to the unique nutritional requirements of various fish species commonly kept in households. In response, manufacturers offer specialized feed formulations, including flake food, pellets, granules, frozen foods, and live feed options. Each product is tailored to address the specific dietary needs of different ornamental fish species. These offerings cater to the growing preference for high-performance, species-specific feeds among household consumers.
Get a glance at the Ornamental Fish Feed Industry report of share of various segments Request Free Sample
The household segment was valued at USD 896.60 million in 2018 and showed a gradual increase during the forecast period.
Regional Analysis
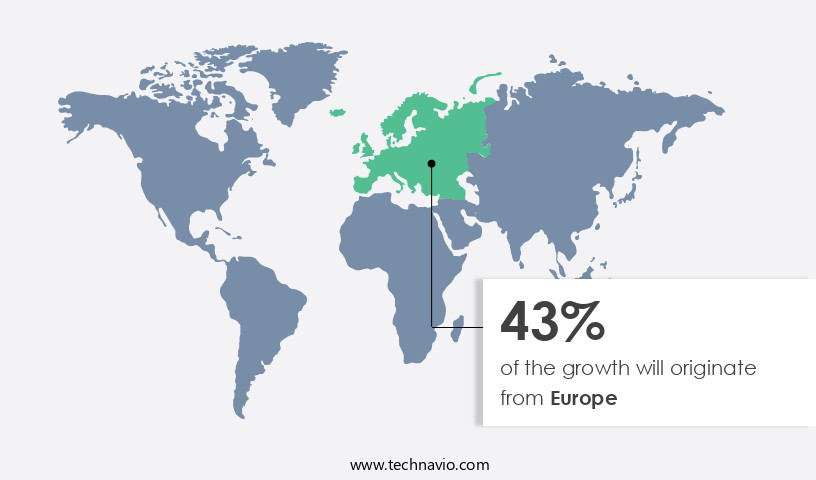
- Europe is estimated to contribute 43% to the growth of the global market during the forecast period.
Technavio's analysts have elaborately explained the regional trends and drivers that shape the market during the forecast period.
For more insights on the market share of various regions, Request Free Sample
The European market is driven by a large number of households maintaining indoor tanks and outdoor ponds, totaling approximately 13 million units in 2023. This segment remains a significant contributor to the demand for ornamental fish feed products, as consumers prioritize high-quality nutrition to ensure the health, vibrancy, and longevity of their aquatic pets. Various feed formulations, including flake food, pellets, granules, frozen foods, and live feed options, cater to the unique dietary requirements of diverse species. The presence of public aquariums in countries like France and Italy further boosts market growth. Household consumers seek out these products to support their colorful fish, contributing to the market's continued expansion.
Market Dynamics
Our ornamental fish feed market researchers analyzed the data with 2023 as the base year, along with the key drivers, trends, and challenges. A holistic analysis of drivers will help companies refine their marketing strategies to gain a competitive advantage.
What are the key market drivers leading to the rise In the adoption of the Ornamental Fish Feed Industry?
Increasing interest in keeping ornamental fish is the key driver of the market.
- The market is witnessing significant growth due to the increasing popularity of aquariums and planted tanks as hobbies. According to recent statistics, over 87 million homes In the US own pets, with a notable percentage expressing interest in keeping colorful tropical fish. In 2022, there were approximately 15 million indoor tanks and 7 million outdoor ponds, indicating a growing consumer base for ornamental fish. This trend is fueled by the mental health benefits associated with pet adoption and aquascaping. Ornamental fish feed comes in various forms, including processed feed, live feed, and a combination of both. Processed feed includes flakes, granules, and pellets made from fishmeal, vegetable proteins, wheat, and other plant materials.
- Live food, such as invertebrates and mollusks, provides essential nutrients that processed feed may not offer. The market caters to both store-based and non-store-based sales, with pet stores and online stores being the primary channels. Ornamental fisheries and animal husbandry also contribute significantly to the production of ornamental fish food. Overall, the market is expected to continue growing as more consumers discover the joys of keeping and caring for these beautiful aquatic creatures.
What are the market trends shaping the Ornamental Fish Feed Industry?
Advancements in feed formulations is the upcoming market trend.
- The market is witnessing significant progress In the development of specialized feed formulations to cater to the distinct dietary requirements of various ornamental fish species. These fish, including tropical fishes, exotic species, and invertebrates such as mollusks, necessitate unique diets that support their coloration, reproductive biology, and overall health. Traditional ingredients like fishmeal and fish oil remain essential components of ornamental fish feeds.
- However, there is a growing preference for novel ingredients and alternative protein sources. This trend aligns with the broader aquaculture feed industry's shift towards sustainable practices and reduced reliance on forage fish. Ornamental fish feeds are available through both store-based and non-store-based retail channels, including pet stores, online stores, and ornamental fisheries. The health benefits of ornamental fish keeping extend beyond pet care, as they have been linked to mental health improvements for their owners. Ingredients used in ornamental fish feeds include plant material, vegetable proteins, meat ingredients, and live food or processed food In the form of flakes, granules, pellets, and frozen dried food. The aquarium fish trade continues to grow, fueled by increasing pet adoption and the popularity of aquascaping and planted tanks.
What challenges does the Ornamental Fish Feed Industry face during its growth?
Competition from live feed is a key challenge affecting the industry growth.
- The market is driven by the increasing popularity of aquariums and the adoption of colorful fish as pets. With the rise of aquascaping and planted tanks, there is a growing demand for high-quality feed to ensure the health and well-being of these animals. Ornamental fish, including tropical fishes, goldfish, exotic species, invertebrates, and mollusks, require specific nutritional needs that can be met through various types of feed. Processed feed, such as flakes, granules, and pellets, offer convenience and consistency, while live feed, including copepods, provides essential nutrients that cannot be replicated in processed food. The aquarium fish trade relies heavily on both store-based and non-store-based sales channels, with pet stores and online stores being the primary sources of supply.
- The health benefits of owning ornamental fish extend beyond mental health and pet care. The ornamental fisheries industry, a critical component of animal husbandry, contributes significantly to the economy and provides employment opportunities. Real-time monitoring of aquarium conditions and feed consumption is essential to maintain optimal fish health and growth. The market dynamics of ornamental fish feed are influenced by various factors, including ingredient type, meat ingredient, plant ingredient, live food, and processed food. Fishmeal, wheat, and vegetable proteins are common ingredients in processed fish feed, while copepods and other live foods offer unique nutritional benefits. The competition posed by live feed, particularly copepods, is a significant challenge to the market. Their nutritional profile and compatibility with various fish species make them an attractive alternative to other live feeds, highlighting the importance of continued advancements in live feed production to support industry expansion.
Exclusive Customer Landscape
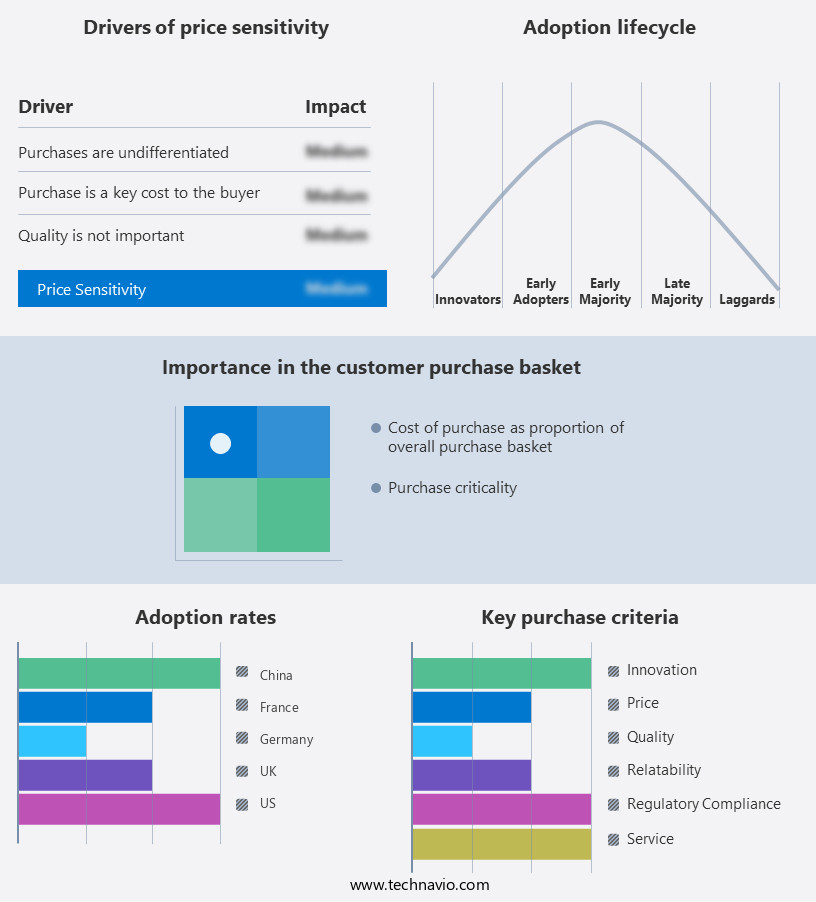
The ornamental fish feed market forecasting report includes the adoption lifecycle of the market, covering from the innovator's stage to the laggard's stage. It focuses on adoption rates in different regions based on penetration. Furthermore, the ornamental fish feed market report also includes key purchase criteria and drivers of price sensitivity to help companies evaluate and develop their market growth analysis strategies.
Customer Landscape
Key Companies & Market Insights
Companies are implementing various strategies, such as strategic alliances, ornamental fish feed market forecast, partnerships, mergers and acquisitions, geographical expansion, and product/service launches, to enhance their presence In the industry.
The industry research and growth report includes detailed analyses of the competitive landscape of the market and information about key companies, including:
- AlgaSpring
- Alltech Inc.
- API Fish Care
- Growel Feeds Pvt. Ltd.
- HAI FENG FEEDS CO., Ltd
- Kaytee products Inc
- KYORIN CO., LTD
- Northfin Fish Food
- Ocean Nutrition
- Ocean Star International, Inc
- Pisces Pros
- Porpoise Aquarium Co.,Ltd
- Raanan Fish Feed
- Ridley Corp. Ltd.
- San Francisco Bay Brand, Inc
- sera GmbH
- Sona Gold AgroChem Pvt Ltd
- Spectrum Brands Holdings Inc.
- Taiyo Group
- Zoo Med Laboratories Inc.
Qualitative and quantitative analysis of companies has been conducted to help clients understand the wider business environment as well as the strengths and weaknesses of key industry players. Data is qualitatively analyzed to categorize companies as pure play, category-focused, industry-focused, and diversified; it is quantitatively analyzed to categorize companies as dominant, leading, strong, tentative, and weak.
Research Analyst Overview
Ornamental fish have become increasingly popular as pets, providing hobbyists with a visually stimulating and relaxing pastime. The market for ornamental fish feed caters to the unique nutritional needs of these aquatic creatures, ensuring they thrive In their environments. Ornamental fish feed comes in various forms, including processed and live options. Processed feed is manufactured using plant material, vegetable proteins, fishmeal, wheat, and other ingredients. These feeds are designed to provide a balanced diet for different species of ornamental fish, including tropical fishes, goldfish, invertebrates, and mollusks. Processed feed is convenient for pet owners as it is readily available at pet stores and online stores.
On the other hand, live feed offers a more natural feeding experience for ornamental fish. Live feed includes options such as brine shrimp, bloodworms, and tubifex worms. These feeds provide essential nutrients that processed feed may not offer In the same quantities. Live feed is often preferred by hobbyists keeping exotic species or those seeking to replicate natural feeding behaviors. The market is driven by several factors. The growing popularity of aquariums and aquascaping, as well as the increasing recognition of the mental health benefits associated with pet adoption and fish keeping, have led to a rise in demand for ornamental fish and their corresponding feed.
Furthermore, real-time monitoring technologies have also made it easier for hobbyists to maintain optimal water conditions and ensure their fish are receiving proper nutrition. The market for ornamental fish feed is diverse, catering to both store-based and non-store-based sales. Pet stores offer a wide range of processed and live feed options, while online stores provide convenience and accessibility for consumers. Ornamental fisheries also contribute to the market by producing fish for the aquarium trade, requiring large quantities of feed to maintaIn their stocks. Animal husbandry practices play a significant role In the production of ornamental fish feed. Ingredient types, such as meat and plant ingredients, are carefully selected to ensure they meet the nutritional requirements of various ornamental fish species.
|
Ornamental Fish Feed Market Scope |
|
|
Report Coverage |
Details |
|
Page number |
204 |
|
Base year |
2023 |
|
Historic period |
2018-2022 |
|
Forecast period |
2024-2028 |
|
Growth momentum & CAGR |
Accelerate at a CAGR of 7.3% |
|
Market Growth 2024-2028 |
USD 1.01 billion |
|
Market structure |
Fragmented |
|
YoY growth 2023-2024(%) |
7.0 |
|
Key countries |
US, China, Germany, UK, France, Japan, Singapore, Italy, The Netherlands, and Belgium |
|
Competitive landscape |
Leading Companies, Market Positioning of Companies, Competitive Strategies, and Industry Risks |
What are the Key Data Covered in this Ornamental Fish Feed Market Research and Growth Report?
- CAGR of the Ornamental Fish Feed industry during the forecast period
- Detailed information on factors that will drive the Ornamental Fish Feed growth and forecasting between 2024 and 2028
- Precise estimation of the size of the market and its contribution of the industry in focus to the parent market
- Accurate predictions about upcoming growth and trends and changes in consumer behaviour
- Growth of the market across Europe, APAC, North America, South America, and Middle East and Africa
- Thorough analysis of the market's competitive landscape and detailed information about companies
- Comprehensive analysis of factors that will challenge the ornamental fish feed market growth of industry companies
We can help! Our analysts can customize this ornamental fish feed market research report to meet your requirements.


