P-Phenylenediamine Market Size 2024-2028
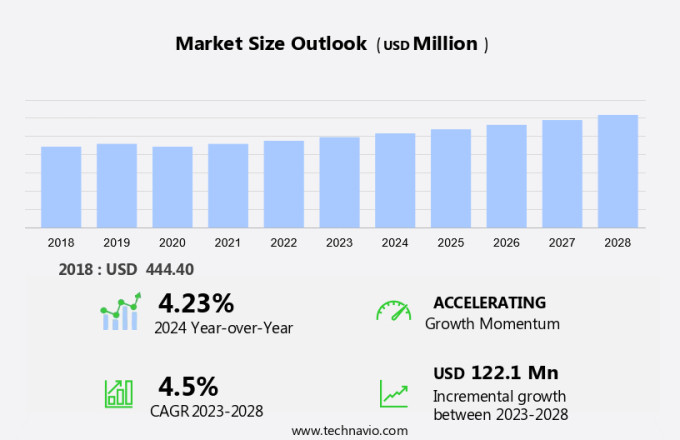
The P-Phenylenediamine market size is forecast to increase by USD 122.1 million, at a CAGR of 4.5% between 2023 and 2028. A primary driver is the growing use of dyes and pigments across various industries. These colorants are essential in applications ranging from textiles and automotive coatings to packaging and consumer goods, boosting demand for innovative and high-performance products. Additionally, the expanding construction industry is contributing to market growth. As construction projects increase, there is a higher need for specialized pigments and dyes used in paints, coatings, and building materials to meet aesthetic and functional requirements. Furthermore, the rising use of para-phenylenediamine (PPD) in the aramid fiber industry is a key factor. PPD is crucial in the production of aramid fibers, which are used in high-performance materials such as bulletproof vests and industrial products. Together, the increasing use of dyes and pigments, the growth of the construction sector, and the demand for PPD in aramid fibers drive substantial market expansion.
What will be the Size of the Market During the Forecast Period?
For More Highlights About this Report, Request Free Sample
Market Dynamic and Customer Landscape
P-Phenylenediamine (PPD) is a crucial aromatic amine used extensively in various industries, primarily as a synthetic rubber additive and in the production of dyes and pigments. The global market for PPD is driven by its wide application in diverse sectors, including the manufacturing of synthetic rubber, hair colors, and composites. The supply chain for PPD involves several manufacturing plants worldwide, with major producers located in Asia Pacific. However, health issues and skin allergies associated with PPD have raised concerns, particularly in the hair dye industry. PPD is known to cause skin-sensitizing properties, leading to eczema and other health problems in some individuals. Diagnostic patch testing is essential for identifying individuals susceptible to PPD allergies. In response to these concerns, alternative ingredients have been explored, and research is ongoing to develop safer alternatives. The use of PPD in photography and aramid fibers is also significant but represents a smaller market share. Despite the health concerns, the demand for PPD remains strong due to its versatility and cost-effectiveness. The market is expected to grow moderately, driven by its applications in the rubber and dye industries. However, stringent regulations and the availability of alternatives may pose challenges to market growth.
Key Market Driver
Growing use of dyes and pigments in different industries is notably driving market growth. Aromatic amines, including P-Phenylenediamine, are significant components in the production of various dyes and chemicals used across industries such as textiles, rubber, and plastics. These compounds exhibit skin sensitizing properties and can cause health problems, particularly eczema, in susceptible individuals. Diagnostic patch testing is employed to identify sensitization to these substances. In textile manufacturing, P-Phenylenediamine is used in the production of textile dyes, particularly permanent hair dyes and tattoos. It is also used in the production of aramid fibers. In rubber chemicals, it acts as a curing agent.
However, the use of P-Phenylenediamine and other aromatic amines poses potential hazards. Exposure can occur through contact with water, alcohol, ether, chloroform, or oxygen during production processes. To mitigate these risks, researchers are exploring alternatives, such as covalent organic frameworks, to replace traditional aromatic amines in various applications. Thus, such factors are driving the growth of the market during the forecast period.
Key Market Trends
Growing use of PPD in photographic developers is the key trend in the market. P-Phenylenediamine (PPD) is a significant aromatic amine that plays a crucial role in various industries, including photography, textiles, and rubber manufacturing. Known for its skin sensitizing properties, PPD can cause health problems such as eczema in susceptible individuals. In the field of diagnostics, PPD is used in patch testing to identify allergic reactions. Beyond photography, PPD is employed in the production of aramid fibers, rubber chemicals, and textile dyes. In the realm of permanent hair dyes, PPD is a common ingredient, contributing to the formation of insoluble azo dyes. The use of PPD extends to the tattoo industry, where it acts as a colorant.
Moreover, PPD's applications are not limited to water-based systems. It can also be found in solutions containing alcohol, ether, chloroform, and even oxygen. Recently, there has been growing interest in using PPD in covalent organic frameworks (COFs) for gas storage and separation applications. In summary, PPD is a versatile aromatic amine with a wide range of applications, from photographic developing agents to textile dyes, rubber chemicals, and even in the production of COFs. Despite its benefits, it is essential to be aware of its potential health risks, particularly for eczema patients. Thus, such trends will shape the growth of the market during the forecast period.
Major Market Challenge
Health issues associated with high exposure to PPD is the major challenge that affects the growth of the market. Paraphenylenediamine (PPD), an aromatic amine, is a significant ingredient in various industries, including textile dyes, permanent hair dyes, rubber chemicals, and tattoos. However, its use comes with potential health risks, particularly for eczema patients. Contact with PPD can cause severe skin irritation and burns, leading to eye damage. Inhalation of PPD can irritate the nose, throat, and lungs, resulting in coughing, wheezing, and shortness of breath. High exposure to this compound can result in more serious health issues, such as abdominal pain, nausea, high blood pressure, dizziness, seizures, and even coma. PPD's skin sensitizing properties can exacerbate eczema and trigger allergic reactions. It is essential to handle and dispose of PPD properly to minimize exposure.
Further, in diagnostic patch testing, PPD is used to identify allergic contact dermatitis, but it must be applied under medical supervision due to its potential health hazards. PPD is soluble in water, alcohol, ether, chloroform, and oxygen, and recent research has explored its potential use in covalent organic frameworks for environmental applications. Despite its risks, PPD remains in demand due to its versatile applications. It is crucial to follow safety guidelines and regulations to mitigate potential health issues associated with its use. Hence, the above factors will impede the growth of the market during the forecast period
Exclusive Customer Landscape
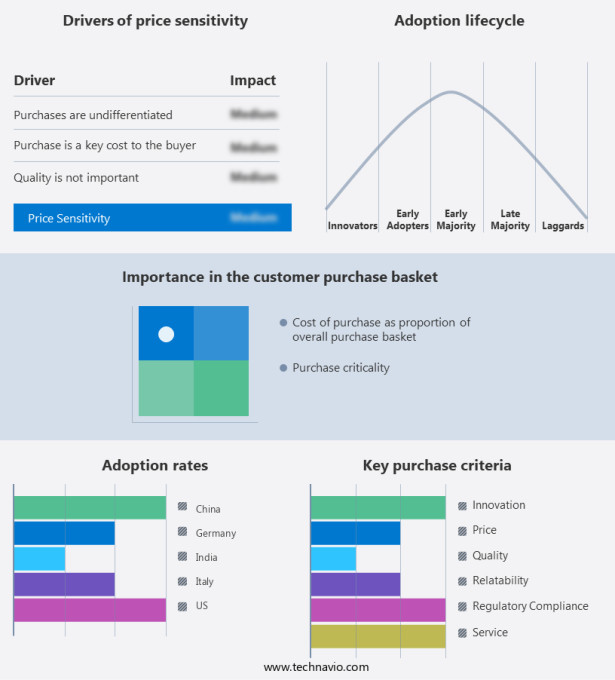
The market forecasting report includes the adoption lifecycle of the market, covering from the innovator's stage to the laggard's stage. It focuses on adoption rates in different regions based on penetration. Furthermore, the report also includes key purchase criteria and drivers of price sensitivity to help companies evaluate and develop their market growth analysis strategies.
Customer Landscape
Key Companies & Market Insights
Companies are implementing various strategies, such as strategic alliances, partnerships, mergers and acquisitions, geographical expansion, and product/service launches, to enhance their presence in the market.
- Aarti Industries Ltd.: The company offers P-phenylenediamine that includes Di Fluoro Aniline Para Fluoro Aniline, Chloro Fluoro Aniline, N-isopropylaniline, Fluoro Acetanalide which is used in Dyes, Speciality Chemicals.
The market research and growth report also includes detailed analyses of the competitive landscape of the market and information about key companies, including:
- Alfa Aesar
- BOCSCI Inc.
- CHEMOS GmbH and Co. KG
- Chizhou Fangda Science and Technology Co., Ltd.
- DuPont de Nemours Inc.
- EC Plaza Network, Inc.
- JAY ORGANICS PVT. Ltd.
- Lanxess AG
- Liaoning Xinyu Bio-tech Co., Ltd.
- Qingdao ECHEMI Digital Technology Co. Ltd.
- TBI CORPORATION LTD.
- Thinkbiotech LLC
- Zhejiang Longsheng Group Co. Ltd.
Qualitative and quantitative analysis of companies has been conducted to help clients understand the wider business environment as well as the strengths and weaknesses of key market players. Data is qualitatively analyzed to categorize companies as pure play, category-focused, industry-focused, and diversified; it is quantitatively analyzed to categorize companies as dominant, leading, strong, tentative, and weak.
Market Segmentation
By Application
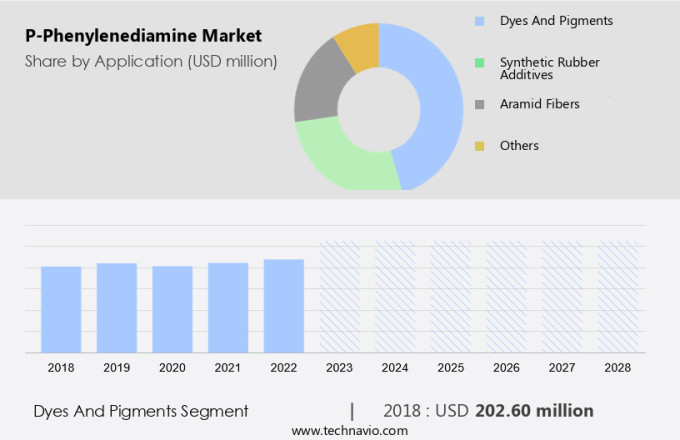
The dyes and pigments segment is estimated to witness significant growth during the forecast period. P-Phenylenediamine (PPD) is a crucial organic compound extensively used in various industries, primarily as synthetic rubber additives. In rubber manufacturing, PPD provides high-temperature stability, chemical resistance, and electric resistance, enhancing the overall performance of rubber products. However, health issues associated with PPD, including skin allergies and eye irritation, have raised concerns. The rubber industry's growth is driven by the increasing demand for PPD in applications such as cracking prevention in rubber, where it acts as an antiozontant against ozone. The global PPD market is forecasted to grow significantly, with the dyes and pigments segment leading the way due to PPD's low toxicity, temperature stability, and ability to provide natural black color that does not fade easily. The dyes and pigments industry's expansion, particularly in emerging economies, is expected to fuel the demand for PPD.
Get a glance at the market share of various regions Download the PDF Sample
The dyes and pigments segment accounted for USD 202.60 million in 2018. Moreover, PPD finds applications in other industries, including engineering polymers, composites, hair dyes, and photography. In aramid plastics and fibers like Twaron and Kevlar, PPD acts as a cross-linking agent, enhancing their strength. In the production of diisocyanate, PPD is used as a building block. In the field of dyes and pigments, PPD is used in azo dyes and antioxidants, contributing to elastic vulcanization in hair dyes and henna. In photography, PPD is used as a developer in black-and-white photographic emulsions.
Regional Analysis
For more insights on the market share of various regions Download PDF Sample now!
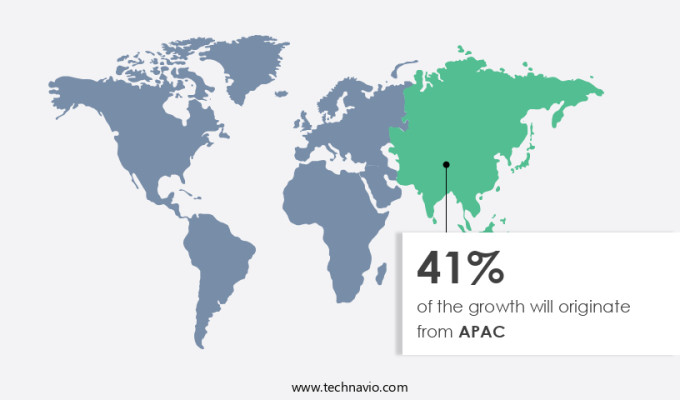
APAC is estimated to contribute 41% to the growth of the global market during the forecast period. Technavio's analysts have elaborately explained the regional trends and drivers that shape the market during the forecast period. P-Phenylenediamine (PPD), an organic compound derived from aniline, plays a significant role as a manufacturing ingredient in various industries, including synthetic rubber additives and dyes and pigments. In rubber manufacturing, PPD is employed for its high-temperature stability, chemical resistance, and electric resistance, contributing to the production of high-strength rubber. However, health concerns arise due to its potential to cause skin allergies and eye irritation. In the rubber industry, PPD is utilized as an antioxidant and antizoonant for rubber cracking prevention.
Further, the global P-Phenylenediamine Market is forecasted to grow due to its applications in engineering polymers, composites, and aramid plastics such as Twaron and Kevlar. Moreover, PPD is used in dyes and pigments, including azo dyes, elastic vulcanization, and hair colors. In photography, PPD is a crucial component in the production of Henna. Despite its benefits, PPD's low toxicity and temperature-stable nature are essential considerations to mitigate potential health risks. Additionally, PPD is used in the production of diisocyanate, a precursor to polyurethane plastic and chemical industries
Segment Overview
The market research report provides comprehensive data (region wise segment analysis), with forecasts and estimates in "USD Million" for the period 2024 to 2028, as well as historical data from 2018 to 2022 for the following segments.
- Application Outlook
- Dyes and pigments
- Synthetic rubber additives
- Aramid fibers
- Others
- Region Outlook
- North America
- The U.S.
- Canada
- Europe
- U.K.
- Germany
- France
- Rest of Europe
- APAC
- China
- India
- South America
- Chile
- Brazil
- Argentina
- Middle East & Africa
- Saudi Arabia
- South Africa
- Rest of the Middle East & Africa
- North America
You may also interested in below market reports:
- US Hair Care Market by Distribution Channel, Price Range, and Product - Forecast and Analysis
- Hair Styling Products Market analysis Europe, North America, APAC, South America, Middle East and Africa - US, China, Germany, Brazil, Japan - Size and Forecast
- Hair Care Market Analysis Europe, APAC, North America, South America, Middle East and Africa - US, China, Japan, Germany, UK - Size and Forecast
Market Analyst Overview
P-Phenylenediamine (PPD) is an organic compound used extensively in the manufacturing of synthetic rubber additives, particularly in the rubber industry. It is a crucial ingredient in the production of antioxidants, which are essential for rubber cracking prevention. The market for P-Phenylenediamine is driven by the growing demand for rubber products, particularly in the automotive and construction industries. However, the use of P-Phenylenediamine in manufacturing plants has raised health concerns due to its potential to cause skin allergies and eye irritation. This has led to stringent regulations and safety measures being implemented in the industry. Despite these challenges, the market for P-Phenylenediamine is expected to grow due to its high-temperature stability, chemical resistance, and electric resistance. These properties make it an ideal additive for engineering polymers, composites, and aramid plastics such as Twaron and Kevlar.
Moreover, P-Phenylenediamine is also used in the production of dyes and pigments, including hair colors, Azo dyes, and antioxidants. Its temperature-stable nature and natural color make it a popular choice in the photography industry as well. In summary, the P-Phenylenediamine market is a significant contributor to the rubber industry, with applications ranging from rubber manufacturing to engineering polymers, composites, and dyes and pigments. Despite health concerns, the market is expected to grow due to the unique properties of P-Phenylenediamine and its wide range of applications.
|
Market Scope |
|
|
Report Coverage |
Details |
|
Page number |
137 |
|
Base year |
2023 |
|
Historic period |
2018-2022 |
|
Forecast period |
2024-2028 |
|
Growth momentum & CAGR |
Accelerate at a CAGR of 4.5% |
|
Market growth 2024-2028 |
USD 122.1 million |
|
Market structure |
Concentrated |
|
YoY growth 2023-2024(%) |
4.23 |
|
Regional analysis |
APAC, North America, Europe, Middle East and Africa, and South America |
|
Performing market contribution |
APAC at 41% |
|
Key countries |
US, China, India, Germany, and Italy |
|
Competitive landscape |
Leading Companies, Market Positioning of Companies, Competitive Strategies, and Industry Risks |
|
Key companies profiled |
Aarti Industries Ltd., Alfa Aesar, BOCSCI Inc., CHEMOS GmbH and Co. KG, Chizhou Fangda Science and Technology Co., Ltd., DuPont de Nemours Inc., EC Plaza Network, Inc., JAY ORGANICS PVT. Ltd., Lanxess AG, Liaoning Xinyu Bio-tech Co., Ltd., Qingdao ECHEMI Digital Technology Co. Ltd., TBI CORPORATION LTD., Thinkbiotech LLC, and Zhejiang Longsheng Group Co. Ltd. |
|
Market dynamics |
Parent market analysis, Market growth inducers and obstacles, Fast-growing and slow-growing segment analysis, COVID-19 impact and recovery analysis and future consumer dynamics, Market condition analysis for mrket forecast period |
|
Customization purview |
If our market report has not included the data that you are looking for, you can reach out to our analysts and get segments customized. |
What are the Key Data Covered in this Market Research Report?
- CAGR of the market during the forecast period
- Detailed information on factors that will drive the market growth and forecasting between 2024 and 2028
- Precise estimation of the size of the market and its contribution of the market in focus to the parent market
- Accurate predictions about upcoming market growth and trends and changes in consumer behaviour
- Growth of the market across APAC, North America, Europe, Middle East and Africa, and South America
- Thorough analysis of the market's competitive landscape and detailed information about companies
- Comprehensive analysis of factors that will challenge the growth of market companies


