Packaged Burgers Market Analysis, Size, and Forecast 2026-2030: Europe (Germany, UK, and France), North America (US, Canada, and Mexico), APAC (China, Japan, and India), South America (Brazil and Argentina), Middle East and Africa (Saudi Arabia, UAE, and South Africa), and Rest of World (ROW)

Packaged Burgers Market Analysis, Size, and Forecast 2026-2030:
Europe (Germany, UK, and France), North America (US, Canada, and Mexico), APAC (China, Japan, and India), South America (Brazil and Argentina), Middle East and Africa (Saudi Arabia, UAE, and South Africa), and Rest of World (ROW)

Published: Mar 2026 307 Pages SKU: IRTNTR43619

Market Overview at a Glance

$3.88 B
Market Opportunity
8.6%
CAGR 2025 - 2030
44.2%
Europe Growth
$4.93 B
Frozen burgers segment 2024

Packaged Burgers Market Size 2026-2030

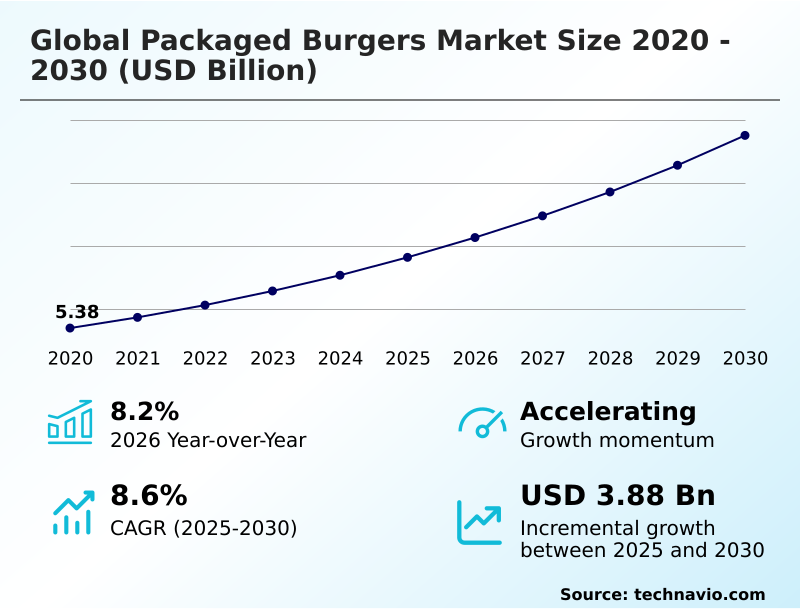
The packaged burgers market size is valued to increase by USD 3.88 billion, at a CAGR of 8.6% from 2025 to 2030. Escalating demand for convenience foods amidst urbanization and modern lifestyles will drive the packaged burgers market.

Major Market Trends & Insights

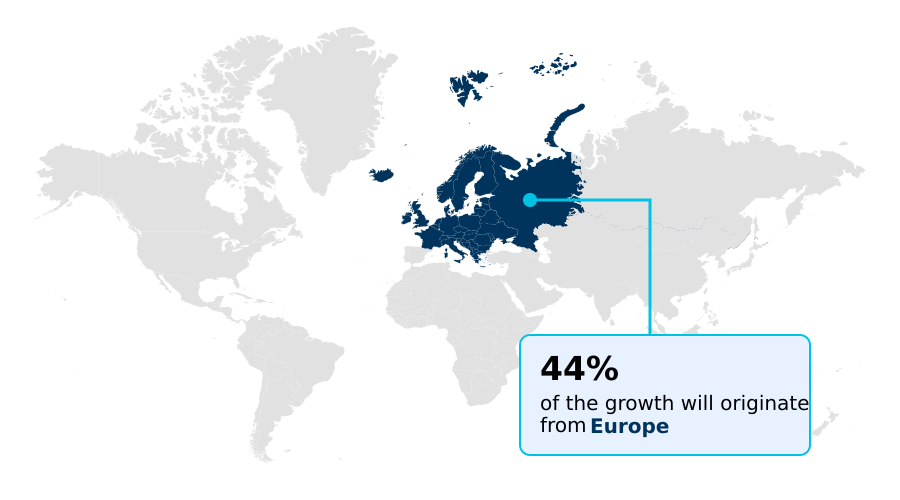
  • Europe dominated the market and accounted for a 44.2% growth during the forecast period.
  • By Type - Frozen burgers segment was valued at USD 4.93 billion in 2024
  • By Product Type - Beef segment accounted for the largest market revenue share in 2024

Market Size & Forecast

  • Market Opportunities: USD 6.13 billion
  • Market Future Opportunities: USD 3.88 billion
  • CAGR from 2025 to 2030 : 8.6%

Market Summary

  • The packaged burgers market is undergoing a significant transformation, balancing the foundational demand for convenience with increasingly sophisticated consumer expectations. Key drivers include the rise of plant-forward dietary shifts, leading to innovations in plant-based burger formulation that deliver authentic sensory attribute replication.
  • Concurrently, the push for premiumization has elevated standards, with a focus on grass-fed beef sourcing and organic packaged burgers. However, the industry grapples with significant challenges, including persistent supply chain cost escalation and the need for robust food product traceability to comply with stringent food safety protocols.
  • For instance, a manufacturer aiming to launch a clean-label burger product must navigate volatile agricultural commodity prices for its premium ingredients while investing in a transparent supply chain to validate its antibiotic-free meat claims to consumers.
  • This dynamic requires companies to master both culinary innovation, such as creating new gourmet flavor profiles, and operational resilience to maintain profitability and consumer trust in a competitive landscape.

What will be the Size of the Packaged Burgers Market during the forecast period?

Get Key Insights on Market Forecast (PDF) Request Free Sample

How is the Packaged Burgers Market Segmented?

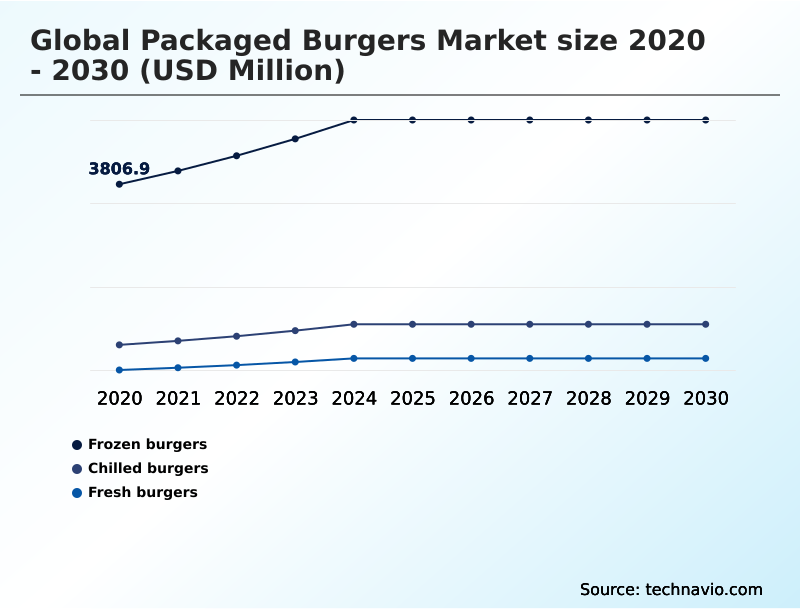
The packaged burgers industry research report provides comprehensive data (region-wise segment analysis), with forecasts and estimates in "USD million" for the period 2026-2030, as well as historical data from 2020-2024 for the following segments.

  • Type
    • Frozen burgers
    • Chilled burgers
    • Fresh burgers
  • Product type
    • Beef
    • Chicken
    • Plant-based
    • Others
  • Distribution channel
    • Supermarkets and hypermarkets
    • Convenience stores
    • Online retail
    • Others
  • Geography
    • Europe
      • Germany
      • UK
      • France
    • North America
      • US
      • Canada
      • Mexico
    • APAC
      • China
      • Japan
      • India
    • South America
      • Brazil
      • Argentina
    • Middle East and Africa
      • Saudi Arabia
      • UAE
      • South Africa
    • Rest of World (ROW)

By Type Insights

The frozen burgers segment is estimated to witness significant growth during the forecast period.

The frozen burgers segment remains a cornerstone of the market, driven by unparalleled convenience and an expanding cold chain logistics network.

Innovations in flash freezing techniques are pivotal, preserving taste and texture to a degree that consumer acceptance now rivals fresher alternatives.

This segment includes a diverse range of frozen burger patties, from economical family packs to premium plant-based options using soy protein-based burgers and pea protein burger formulations.

Advanced vacuum-sealed burger packaging and modified atmosphere packaging extend product usability, a key factor in consumer purchasing criteria, while also simplifying foodservice distribution channels. Enhanced offerings, including reduced sodium formulations, now cater to health-conscious consumers.

By leveraging technology to ensure an extended shelf life, manufacturers have improved inventory turnover by up to 15%, solidifying the segment's market position.

Request Free Sample

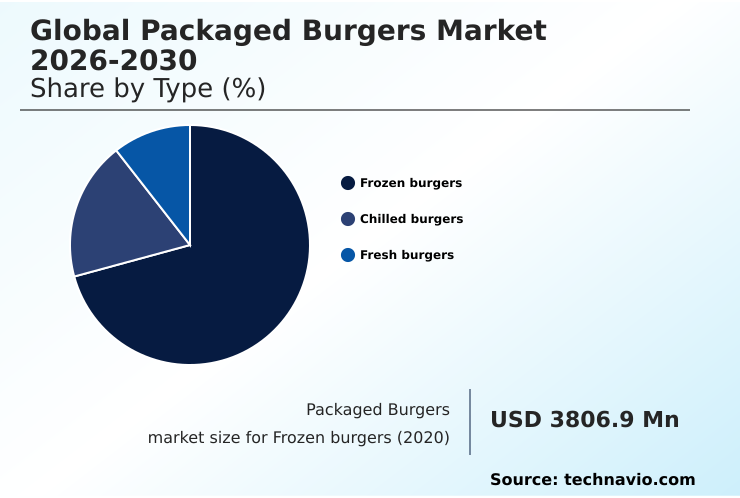
The Frozen burgers segment was valued at USD 4.93 billion in 2024 and showed a gradual increase during the forecast period.

Request Free Sample

Regional Analysis

Europe is estimated to contribute 44.2% to the growth of the global market during the forecast period.Technavio’s analysts have elaborately explained the regional trends and drivers that shape the market during the forecast period.

See How Packaged Burgers Market Demand is Rising in Europe Request Free Sample

The global geographic landscape for packaged burgers shows a clear distinction between mature and emerging regions.

North America and Europe remain dominant, driven by established retail infrastructures and high consumer demand for convenience, including chilled burger products and fresh butcher-quality patties prepared in-store.

Europe is set to contribute 44.24% of the market's incremental growth, with a strong focus on premiumization and sustainability. In contrast, APAC is a key growth frontier where rising disposable incomes and urbanization are driving adoption.

The expansion of e-commerce grocery platforms and sophisticated last-mile cold chain delivery networks in this region has boosted accessibility, with online adoption increasing by over 30% in major urban centers.

Success in markets like South America is often tied to regional flavor adaptation that resonates with local culinary traditions, such as the Brazilian barbecue culture, while direct-to-consumer food models are gaining traction globally.

Market Dynamics

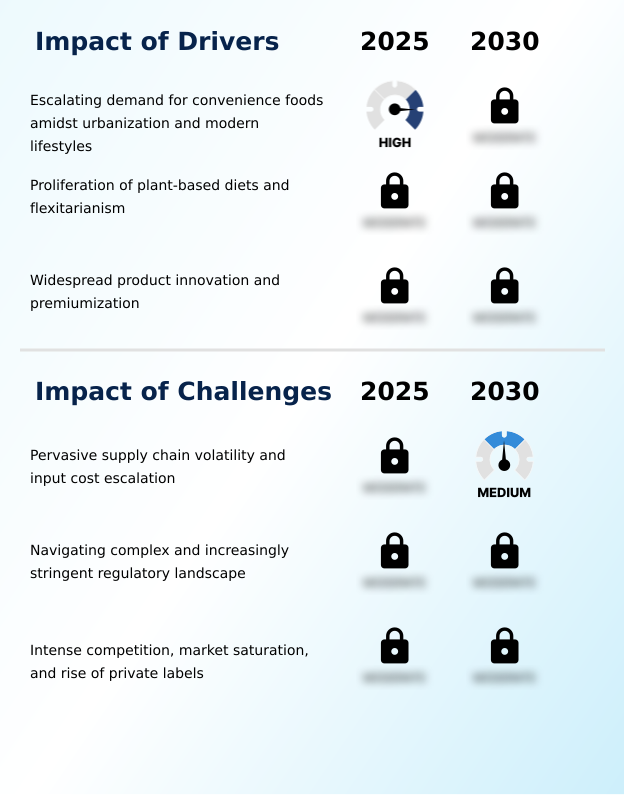
Our researchers analyzed the data with 2025 as the base year, along with the key drivers, trends, and challenges. A holistic analysis of drivers will help companies refine their marketing strategies to gain a competitive advantage.

  • The strategic landscape of the global packaged burgers market 2026-2030 is increasingly shaped by nuanced consumer demands and operational complexities. Key decisions revolve around the consumer perception of fresh vs frozen burgers, which influences portfolio strategy and cold chain logistics for burgers.
  • The growth of online retail for packaged burgers presents new avenues, but also amplifies the need for efficient distribution. Manufacturers are exploring innovations in plant protein for burgers to cater to health and wellness trends in burgers, a segment where products that mimic meat are gaining significant traction.
  • This requires a focus on gourmet burger offerings for retail that go beyond basic patties. Simultaneously, the impact of private labels on branded burgers forces established companies to double down on differentiation through premium grass fed beef burger patties and packaged burgers with clean label ingredients.
  • Navigating food safety regulations for burgers remains a top priority, driving investment in sustainable sourcing practices for packaged burgers. Companies that effectively communicate their commitment to antibiotic-free burgers often see higher consumer trust, with some reporting a 10% greater retention rate.
  • Addressing supply chain challenges in packaged burgers, from sourcing to managing the convenience of frozen vs chilled burgers, is crucial for maintaining market position and profitability.

What are the key market drivers leading to the rise in the adoption of Packaged Burgers Industry?

  • The escalating demand for convenience foods, driven by rapid urbanization and time-constrained modern lifestyles, serves as a primary driver for market growth.

  • The fundamental market driver remains the demand for convenience, manifesting as a preference for heat-and-eat meal solutions and quick-cook burger options.
  • This has led to the development of value-added burger products, such as pre-seasoned patty convenience items and single-serve packaging solutions, which can reduce meal preparation time by over 50%.
  • Catering to the flexitarian consumer demand, the market has seen a surge in premium beef burgers, including high-end angus beef burgers and wagyu beef patties.
  • Premium ingredient sourcing is a key differentiator, influencing the purchasing criteria of a growing consumer segment and fostering strong consumer brand loyalty.
  • The availability of diverse ready-to-cook meal components across various foodservice distribution channels further fuels market expansion by meeting the needs of time-constrained households seeking high-quality, easy-to-prepare meals.

What are the market trends shaping the Packaged Burgers Industry?

  • A pronounced consumer shift toward health and wellness is reshaping product development, driving demand for formulations with cleaner labels and enhanced nutritional profiles.

  • Key trends are reshaping the market, driven by consumer demand for healthier and more sophisticated options. The rise of plant-forward dietary shifts has spurred intense innovation in meat alternative products, where the goal is achieving authentic sensory attribute replication. Advanced protein isolation technology is enabling the creation of plant-based burger formulation options that closely mimic traditional gourmet chicken burgers.
  • Brands that offer restaurant-quality at home experiences through artisanal food production and globally inspired flavor innovation are gaining a competitive edge, with some achieving a 25% increase in consumer engagement.
  • This push toward premiumization is also seen in the demand for non-gmo project verified and clean label burger ingredients, including artisanal cheese inclusions, reflecting a broader movement toward transparency and quality in culinary fusion trends.

What challenges does the Packaged Burgers Industry face during its growth?

  • Pervasive supply chain volatility and the corresponding escalation of input costs present a significant challenge to profitability and stability within the industry.

  • Navigating market challenges requires a focus on operational resilience and strategic differentiation. Persistent supply chain cost escalation and agricultural commodity volatility necessitate robust input cost management, with effective strategies mitigating margin erosion by up to 15%. The rise of retailer brand competition, particularly from private label burger manufacturing, has intensified price pressures, making product differentiation strategies essential for survival.
  • Furthermore, adhering to a complex web of regulations, including food safety compliance and requirements for halal-certified meat products or kosher-certified food processing, adds significant operational overhead. Ensuring complete food product traceability across the supply chain is no longer optional.
  • These pressures force companies to innovate continuously to stand out in niche market segmentation while managing the logistical demands of foodservice distribution channels and maintaining extended shelf life standards.

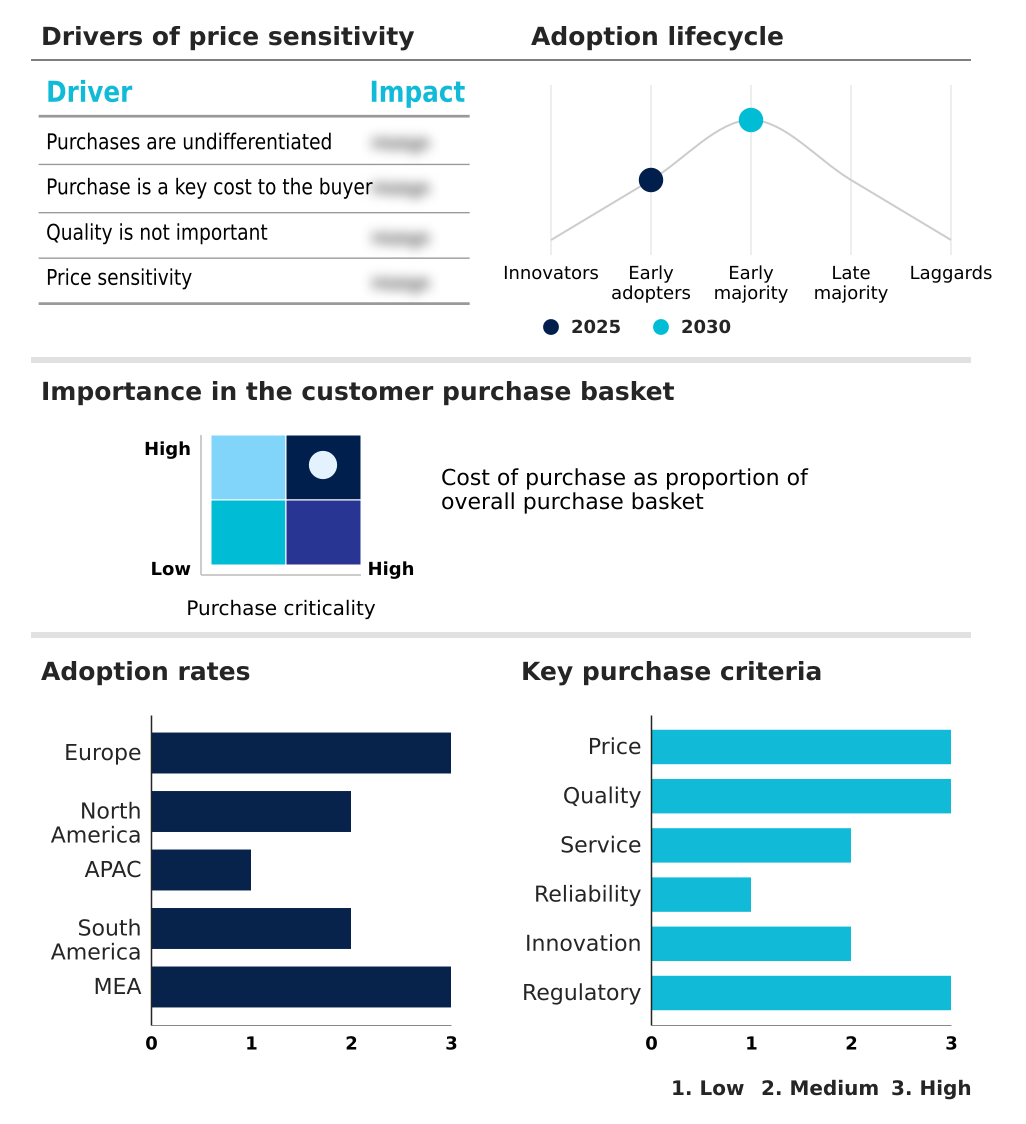
Exclusive Technavio Analysis on Customer Landscape

The packaged burgers market forecasting report includes the adoption lifecycle of the market, covering from the innovator’s stage to the laggard’s stage. It focuses on adoption rates in different regions based on penetration. Furthermore, the packaged burgers market report also includes key purchase criteria and drivers of price sensitivity to help companies evaluate and develop their market growth analysis strategies.

Customer Landscape of Packaged Burgers Industry

Competitive Landscape

Companies are implementing various strategies, such as strategic alliances, packaged burgers market forecast, partnerships, mergers and acquisitions, geographical expansion, and product/service launches, to enhance their presence in the industry.

Acabonac Farms LLC - Focuses on developing plant-based meat alternatives that replicate the sensory attributes of animal protein, catering to evolving dietary preferences through advanced formulations.

The industry research and growth report includes detailed analyses of the competitive landscape of the market and information about key companies, including:

  • Acabonac Farms LLC
  • Amys Kitchen Inc.
  • Beyond Meat Inc.
  • Bubba Foods LLC
  • Campbells Prime Meat Ltd.
  • Cremonini S.p.A.
  • DiLuigi Foods Inc.
  • Don Lee Farms
  • Dr. Praegers Sensible Foods Inc.
  • Impossible Foods Inc.
  • J Sainsbury plc
  • Kellanova
  • Marfrig Global Foods SA
  • Nestle SA
  • Paragon Quality Foods Ltd.
  • Quality Burgers Ltd.
  • Rangeland Foods Ltd.
  • The Kraft Heinz Co.
  • The Kroger Co.
  • Tyson Foods Inc.

Qualitative and quantitative analysis of companies has been conducted to help clients understand the wider business environment as well as the strengths and weaknesses of key industry players. Data is qualitatively analyzed to categorize companies as pure play, category-focused, industry-focused, and diversified; it is quantitatively analyzed to categorize companies as dominant, leading, strong, tentative, and weak.

Recent Development and News in Packaged burgers market

  • In April 2025, Tyson Foods Inc. expanded its foodservice portfolio by introducing new products, including fully cooked, flame-broiled turkey patties designed as a lower-fat alternative to traditional beef burgers.
  • In March 2025, Future Burger, a plant-based food company, announced a strategic partnership with fast-food chain Quick Serve Inc. to launch a co-branded line of plant-based packaged burgers sold exclusively through retail.
  • In February 2025, Global Foods Inc. launched a new line of premium packaged burgers under the brand name Natures Catch, marketed as a clean-label product made with organic, grass-fed beef and sustainable packaging.
  • In May 2025, the European Union introduced new sustainability regulations known as the Green Food Charter, setting mandatory requirements for food manufacturers to reduce environmental impact and promote animal welfare.

Dive into Technavio’s robust research methodology, blending expert interviews, extensive data synthesis, and validated models for unparalleled Packaged Burgers Market insights. See full methodology.

Market Scope
Page number 307
Base year 2025
Historic period 2020-2024
Forecast period 2026-2030
Growth momentum & CAGR Accelerate at a CAGR of 8.6%
Market growth 2026-2030 USD 3876.0 million
Market structure Fragmented
YoY growth 2025-2026(%) 8.2%
Key countries Germany, UK, France, Italy, Spain, The Netherlands, US, Canada, Mexico, China, Japan, India, South Korea, Thailand, Indonesia, Brazil, Argentina, Chile, Saudi Arabia, UAE, South Africa, Israel and Turkey
Competitive landscape Leading Companies, Market Positioning of Companies, Competitive Strategies, and Industry Risks

Request Free Sample

Research Analyst Overview

  • The packaged burgers market is defined by a complex interplay of consumer trends and operational demands, forcing boardroom-level decisions on R&D and supply chain investments. The push for clean label burger ingredients is compelling manufacturers to re-evaluate sourcing, prioritizing antibiotic-free meat claims and grass-fed beef sourcing.
  • This shift extends to plant-based alternatives, where protein isolation technology is used to create sophisticated soy protein-based burgers and pea protein burger formulations with authentic sensory attribute replication. Innovation is also evident in value-added burger products featuring artisanal cheese inclusions or gourmet flavor profiles.
  • To ensure safety and quality across frozen burger patties and chilled products, companies are implementing advanced food product traceability systems, which have been shown to reduce recall-related expenses by over 40%. The adoption of modified atmosphere packaging and flash freezing techniques supports extended shelf life, a critical factor in managing cold chain logistics.
  • Success in this environment requires balancing premium offerings, such as angus beef burgers, with the manufacturing efficiencies needed to compete against private label burger manufacturing.

What are the Key Data Covered in this Packaged Burgers Market Research and Growth Report?

  • What is the expected growth of the Packaged Burgers Market between 2026 and 2030?

    • USD 3.88 billion, at a CAGR of 8.6%

  • What segmentation does the market report cover?

    • The report is segmented by Type (Frozen burgers, Chilled burgers, and Fresh burgers), Product Type (Beef, Chicken, Plant-based, and Others), Distribution Channel (Supermarkets and hypermarkets, Convenience stores, Online retail, and Others) and Geography (Europe, North America, APAC, South America, Middle East and Africa)

  • Which regions are analyzed in the report?

    • Europe, North America, APAC, South America and Middle East and Africa

  • What are the key growth drivers and market challenges?

    • Escalating demand for convenience foods amidst urbanization and modern lifestyles, Pervasive supply chain volatility and input cost escalation

  • Who are the major players in the Packaged Burgers Market?

    • Acabonac Farms LLC, Amys Kitchen Inc., Beyond Meat Inc., Bubba Foods LLC, Campbells Prime Meat Ltd., Cremonini S.p.A., DiLuigi Foods Inc., Don Lee Farms, Dr. Praegers Sensible Foods Inc., Impossible Foods Inc., J Sainsbury plc, Kellanova, Marfrig Global Foods SA, Nestle SA, Paragon Quality Foods Ltd., Quality Burgers Ltd., Rangeland Foods Ltd., The Kraft Heinz Co., The Kroger Co. and Tyson Foods Inc.

Market Research Insights

  • The market's trajectory is heavily influenced by evolving consumer purchasing criteria, which increasingly favor ready-to-cook meal components and products aligned with plant-forward dietary shifts. The demand for restaurant-quality at home experiences has fueled product differentiation strategies, with some premium brands achieving a 15% uplift in consumer brand loyalty through superior ingredient sourcing.
  • Concurrently, the adoption of sustainable food packaging is a key factor, with studies indicating that 60% of consumers are more likely to purchase from brands with clear environmental commitments.
  • Effective input cost management remains critical; firms using advanced analytics to navigate agricultural commodity volatility have successfully protected their profit margins by 5-7% compared to industry averages, demonstrating the importance of operational agility in a competitive environment.

We can help! Our analysts can customize this packaged burgers market research report to meet your requirements.

Get in touch

1. Executive Summary

1.1 Market overview

Executive Summary - Chart on Market Overview
Executive Summary - Data Table on Market Overview
Executive Summary - Chart on Global Market Characteristics
Executive Summary - Chart on Market by Geography
Executive Summary - Chart on Market Segmentation by Type
Executive Summary - Chart on Market Segmentation by Product Type
Executive Summary - Chart on Market Segmentation by Distribution Channel
Executive Summary - Chart on Incremental Growth
Executive Summary - Data Table on Incremental Growth
Executive Summary - Chart on Company Market Positioning

2. Technavio Analysis

2.1 Analysis of price sensitivity, lifecycle, customer purchase basket, adoption rates, and purchase criteria

2.2 Criticality of inputs and Factors of differentiation

Chart on Overview on criticality of inputs and factors of differentiation

2.3 Factors of disruption

Chart on Overview on factors of disruption

2.4 Impact of drivers and challenges

Chart on Impact of drivers and challenges in 2025 and 2030

3. Market Landscape

3.1 Market ecosystem

Chart on Parent Market
Data Table on - Parent Market

3.2 Market characteristics

Chart on Market characteristics analysis

3.3 Value chain analysis

Chart on Value chain analysis

4. Market Sizing

4.1 Market definition

Data Table on Offerings of companies included in the market definition

4.2 Market segment analysis

Market segments

4.3 Market size 2025

4.4 Market outlook: Forecast for 2025-2030

Chart on Global - Market size and forecast 2025-2030 ($ million)
Data Table on Global - Market size and forecast 2025-2030 ($ million)
Chart on Global Market: Year-over-year growth 2025-2030 (%)
Data Table on Global Market: Year-over-year growth 2025-2030 (%)

5. Historic Market Size

5.1 Global Packaged Burgers Market 2020 - 2024

Historic Market Size - Data Table on Global Packaged Burgers Market 2020 - 2024 ($ million)

5.2 Type segment analysis 2020 - 2024

Historic Market Size - Type Segment 2020 - 2024 ($ million)

5.3 Product Type segment analysis 2020 - 2024

Historic Market Size - Product Type Segment 2020 - 2024 ($ million)

5.4 Distribution Channel segment analysis 2020 - 2024

Historic Market Size - Distribution Channel Segment 2020 - 2024 ($ million)

5.5 Geography segment analysis 2020 - 2024

Historic Market Size - Geography Segment 2020 - 2024 ($ million)

5.6 Country segment analysis 2020 - 2024

Historic Market Size - Country Segment 2020 - 2024 ($ million)

6. Qualitative Analysis

6.1 Impact of AI on global packaged burgers market

6.2 Impact of geopolitical conflicts on global packaged burgers market

7. Five Forces Analysis

7.1 Five forces summary

Five forces analysis - Comparison between 2025 and 2030

7.2 Bargaining power of buyers

Bargaining power of buyers - Impact of key factors 2025 and 2030

7.3 Bargaining power of suppliers

Bargaining power of suppliers - Impact of key factors in 2025 and 2030

7.4 Threat of new entrants

Threat of new entrants - Impact of key factors in 2025 and 2030

7.5 Threat of substitutes

Threat of substitutes - Impact of key factors in 2025 and 2030

7.6 Threat of rivalry

Threat of rivalry - Impact of key factors in 2025 and 2030

7.7 Market condition

Chart on Market condition - Five forces 2025 and 2030

8. Market Segmentation by Type

8.1 Market segments

Chart on Type - Market share 2025-2030 (%)
Data Table on Type - Market share 2025-2030 (%)

8.2 Comparison by Type

Chart on Comparison by Type
Data Table on Comparison by Type

8.3 Frozen burgers - Market size and forecast 2025-2030

Chart on Frozen burgers - Market size and forecast 2025-2030 ($ million)
Data Table on Frozen burgers - Market size and forecast 2025-2030 ($ million)
Chart on Frozen burgers - Year-over-year growth 2025-2030 (%)
Data Table on Frozen burgers - Year-over-year growth 2025-2030 (%)

8.4 Chilled burgers - Market size and forecast 2025-2030

Chart on Chilled burgers - Market size and forecast 2025-2030 ($ million)
Data Table on Chilled burgers - Market size and forecast 2025-2030 ($ million)
Chart on Chilled burgers - Year-over-year growth 2025-2030 (%)
Data Table on Chilled burgers - Year-over-year growth 2025-2030 (%)

8.5 Fresh burgers - Market size and forecast 2025-2030

Chart on Fresh burgers - Market size and forecast 2025-2030 ($ million)
Data Table on Fresh burgers - Market size and forecast 2025-2030 ($ million)
Chart on Fresh burgers - Year-over-year growth 2025-2030 (%)
Data Table on Fresh burgers - Year-over-year growth 2025-2030 (%)

8.6 Market opportunity by Type

Market opportunity by Type ($ million)
Data Table on Market opportunity by Type ($ million)

9. Market Segmentation by Product Type

9.1 Market segments

Chart on Product Type - Market share 2025-2030 (%)
Data Table on Product Type - Market share 2025-2030 (%)

9.2 Comparison by Product Type

Chart on Comparison by Product Type
Data Table on Comparison by Product Type

9.3 Beef - Market size and forecast 2025-2030

Chart on Beef - Market size and forecast 2025-2030 ($ million)
Data Table on Beef - Market size and forecast 2025-2030 ($ million)
Chart on Beef - Year-over-year growth 2025-2030 (%)
Data Table on Beef - Year-over-year growth 2025-2030 (%)

9.4 Chicken - Market size and forecast 2025-2030

Chart on Chicken - Market size and forecast 2025-2030 ($ million)
Data Table on Chicken - Market size and forecast 2025-2030 ($ million)
Chart on Chicken - Year-over-year growth 2025-2030 (%)
Data Table on Chicken - Year-over-year growth 2025-2030 (%)

9.5 Plant-based - Market size and forecast 2025-2030

Chart on Plant-based - Market size and forecast 2025-2030 ($ million)
Data Table on Plant-based - Market size and forecast 2025-2030 ($ million)
Chart on Plant-based - Year-over-year growth 2025-2030 (%)
Data Table on Plant-based - Year-over-year growth 2025-2030 (%)

9.6 Others - Market size and forecast 2025-2030

Chart on Others - Market size and forecast 2025-2030 ($ million)
Data Table on Others - Market size and forecast 2025-2030 ($ million)
Chart on Others - Year-over-year growth 2025-2030 (%)
Data Table on Others - Year-over-year growth 2025-2030 (%)

9.7 Market opportunity by Product Type

Market opportunity by Product Type ($ million)
Data Table on Market opportunity by Product Type ($ million)

10. Market Segmentation by Distribution Channel

10.1 Market segments

Chart on Distribution Channel - Market share 2025-2030 (%)
Data Table on Distribution Channel - Market share 2025-2030 (%)

10.2 Comparison by Distribution Channel

Chart on Comparison by Distribution Channel
Data Table on Comparison by Distribution Channel

10.3 Supermarkets and hypermarkets - Market size and forecast 2025-2030

Chart on Supermarkets and hypermarkets - Market size and forecast 2025-2030 ($ million)
Data Table on Supermarkets and hypermarkets - Market size and forecast 2025-2030 ($ million)
Chart on Supermarkets and hypermarkets - Year-over-year growth 2025-2030 (%)
Data Table on Supermarkets and hypermarkets - Year-over-year growth 2025-2030 (%)

10.4 Convenience stores - Market size and forecast 2025-2030

Chart on Convenience stores - Market size and forecast 2025-2030 ($ million)
Data Table on Convenience stores - Market size and forecast 2025-2030 ($ million)
Chart on Convenience stores - Year-over-year growth 2025-2030 (%)
Data Table on Convenience stores - Year-over-year growth 2025-2030 (%)

10.5 Online retail - Market size and forecast 2025-2030

Chart on Online retail - Market size and forecast 2025-2030 ($ million)
Data Table on Online retail - Market size and forecast 2025-2030 ($ million)
Chart on Online retail - Year-over-year growth 2025-2030 (%)
Data Table on Online retail - Year-over-year growth 2025-2030 (%)

10.6 Others - Market size and forecast 2025-2030

Chart on Others - Market size and forecast 2025-2030 ($ million)
Data Table on Others - Market size and forecast 2025-2030 ($ million)
Chart on Others - Year-over-year growth 2025-2030 (%)
Data Table on Others - Year-over-year growth 2025-2030 (%)

10.7 Market opportunity by Distribution Channel

Market opportunity by Distribution Channel ($ million)
Data Table on Market opportunity by Distribution Channel ($ million)

11. Customer Landscape

11.1 Customer landscape overview

Analysis of price sensitivity, lifecycle, customer purchase basket, adoption rates, and purchase criteria

12. Geographic Landscape

12.1 Geographic segmentation

Chart on Market share by geography 2025-2030 (%)
Data Table on Market share by geography 2025-2030 (%)

12.2 Geographic comparison

Chart on Geographic comparison
Data Table on Geographic comparison

12.3 Europe - Market size and forecast 2025-2030

Chart on Europe - Market size and forecast 2025-2030 ($ million)
Data Table on Europe - Market size and forecast 2025-2030 ($ million)
Chart on Europe - Year-over-year growth 2025-2030 (%)
Data Table on Europe - Year-over-year growth 2025-2030 (%)
Chart on Regional Comparison - Europe
Data Table on Regional Comparison - Europe

12.3.1 Germany - Market size and forecast 2025-2030

Chart on Germany - Market size and forecast 2025-2030 ($ million)
Data Table on Germany - Market size and forecast 2025-2030 ($ million)
Chart on Germany - Year-over-year growth 2025-2030 (%)
Data Table on Germany - Year-over-year growth 2025-2030 (%)

12.3.2 UK - Market size and forecast 2025-2030

Chart on UK - Market size and forecast 2025-2030 ($ million)
Data Table on UK - Market size and forecast 2025-2030 ($ million)
Chart on UK - Year-over-year growth 2025-2030 (%)
Data Table on UK - Year-over-year growth 2025-2030 (%)

12.3.3 France - Market size and forecast 2025-2030

Chart on France - Market size and forecast 2025-2030 ($ million)
Data Table on France - Market size and forecast 2025-2030 ($ million)
Chart on France - Year-over-year growth 2025-2030 (%)
Data Table on France - Year-over-year growth 2025-2030 (%)

12.3.4 Italy - Market size and forecast 2025-2030

Chart on Italy - Market size and forecast 2025-2030 ($ million)
Data Table on Italy - Market size and forecast 2025-2030 ($ million)
Chart on Italy - Year-over-year growth 2025-2030 (%)
Data Table on Italy - Year-over-year growth 2025-2030 (%)

12.3.5 Spain - Market size and forecast 2025-2030

Chart on Spain - Market size and forecast 2025-2030 ($ million)
Data Table on Spain - Market size and forecast 2025-2030 ($ million)
Chart on Spain - Year-over-year growth 2025-2030 (%)
Data Table on Spain - Year-over-year growth 2025-2030 (%)

12.3.6 The Netherlands - Market size and forecast 2025-2030

Chart on The Netherlands - Market size and forecast 2025-2030 ($ million)
Data Table on The Netherlands - Market size and forecast 2025-2030 ($ million)
Chart on The Netherlands - Year-over-year growth 2025-2030 (%)
Data Table on The Netherlands - Year-over-year growth 2025-2030 (%)

12.4 North America - Market size and forecast 2025-2030

Chart on North America - Market size and forecast 2025-2030 ($ million)
Data Table on North America - Market size and forecast 2025-2030 ($ million)
Chart on North America - Year-over-year growth 2025-2030 (%)
Data Table on North America - Year-over-year growth 2025-2030 (%)
Chart on Regional Comparison - North America
Data Table on Regional Comparison - North America

12.4.1 US - Market size and forecast 2025-2030

Chart on US - Market size and forecast 2025-2030 ($ million)
Data Table on US - Market size and forecast 2025-2030 ($ million)
Chart on US - Year-over-year growth 2025-2030 (%)
Data Table on US - Year-over-year growth 2025-2030 (%)

12.4.2 Canada - Market size and forecast 2025-2030

Chart on Canada - Market size and forecast 2025-2030 ($ million)
Data Table on Canada - Market size and forecast 2025-2030 ($ million)
Chart on Canada - Year-over-year growth 2025-2030 (%)
Data Table on Canada - Year-over-year growth 2025-2030 (%)

12.4.3 Mexico - Market size and forecast 2025-2030

Chart on Mexico - Market size and forecast 2025-2030 ($ million)
Data Table on Mexico - Market size and forecast 2025-2030 ($ million)
Chart on Mexico - Year-over-year growth 2025-2030 (%)
Data Table on Mexico - Year-over-year growth 2025-2030 (%)

12.5 APAC - Market size and forecast 2025-2030

Chart on APAC - Market size and forecast 2025-2030 ($ million)
Data Table on APAC - Market size and forecast 2025-2030 ($ million)
Chart on APAC - Year-over-year growth 2025-2030 (%)
Data Table on APAC - Year-over-year growth 2025-2030 (%)
Chart on Regional Comparison - APAC
Data Table on Regional Comparison - APAC

12.5.1 China - Market size and forecast 2025-2030

Chart on China - Market size and forecast 2025-2030 ($ million)
Data Table on China - Market size and forecast 2025-2030 ($ million)
Chart on China - Year-over-year growth 2025-2030 (%)
Data Table on China - Year-over-year growth 2025-2030 (%)

12.5.2 Japan - Market size and forecast 2025-2030

Chart on Japan - Market size and forecast 2025-2030 ($ million)
Data Table on Japan - Market size and forecast 2025-2030 ($ million)
Chart on Japan - Year-over-year growth 2025-2030 (%)
Data Table on Japan - Year-over-year growth 2025-2030 (%)

12.5.3 India - Market size and forecast 2025-2030

Chart on India - Market size and forecast 2025-2030 ($ million)
Data Table on India - Market size and forecast 2025-2030 ($ million)
Chart on India - Year-over-year growth 2025-2030 (%)
Data Table on India - Year-over-year growth 2025-2030 (%)

12.5.4 South Korea - Market size and forecast 2025-2030

Chart on South Korea - Market size and forecast 2025-2030 ($ million)
Data Table on South Korea - Market size and forecast 2025-2030 ($ million)
Chart on South Korea - Year-over-year growth 2025-2030 (%)
Data Table on South Korea - Year-over-year growth 2025-2030 (%)

12.5.5 Thailand - Market size and forecast 2025-2030

Chart on Thailand - Market size and forecast 2025-2030 ($ million)
Data Table on Thailand - Market size and forecast 2025-2030 ($ million)
Chart on Thailand - Year-over-year growth 2025-2030 (%)
Data Table on Thailand - Year-over-year growth 2025-2030 (%)

12.5.6 Indonesia - Market size and forecast 2025-2030

Chart on Indonesia - Market size and forecast 2025-2030 ($ million)
Data Table on Indonesia - Market size and forecast 2025-2030 ($ million)
Chart on Indonesia - Year-over-year growth 2025-2030 (%)
Data Table on Indonesia - Year-over-year growth 2025-2030 (%)

12.6 South America - Market size and forecast 2025-2030

Chart on South America - Market size and forecast 2025-2030 ($ million)
Data Table on South America - Market size and forecast 2025-2030 ($ million)
Chart on South America - Year-over-year growth 2025-2030 (%)
Data Table on South America - Year-over-year growth 2025-2030 (%)
Chart on Regional Comparison - South America
Data Table on Regional Comparison - South America

12.6.1 Brazil - Market size and forecast 2025-2030

Chart on Brazil - Market size and forecast 2025-2030 ($ million)
Data Table on Brazil - Market size and forecast 2025-2030 ($ million)
Chart on Brazil - Year-over-year growth 2025-2030 (%)
Data Table on Brazil - Year-over-year growth 2025-2030 (%)

12.6.2 Argentina - Market size and forecast 2025-2030

Chart on Argentina - Market size and forecast 2025-2030 ($ million)
Data Table on Argentina - Market size and forecast 2025-2030 ($ million)
Chart on Argentina - Year-over-year growth 2025-2030 (%)
Data Table on Argentina - Year-over-year growth 2025-2030 (%)

12.6.3 Chile - Market size and forecast 2025-2030

Chart on Chile - Market size and forecast 2025-2030 ($ million)
Data Table on Chile - Market size and forecast 2025-2030 ($ million)
Chart on Chile - Year-over-year growth 2025-2030 (%)
Data Table on Chile - Year-over-year growth 2025-2030 (%)

12.7 Middle East and Africa - Market size and forecast 2025-2030

Chart on Middle East and Africa - Market size and forecast 2025-2030 ($ million)
Data Table on Middle East and Africa - Market size and forecast 2025-2030 ($ million)
Chart on Middle East and Africa - Year-over-year growth 2025-2030 (%)
Data Table on Middle East and Africa - Year-over-year growth 2025-2030 (%)
Chart on Regional Comparison - Middle East and Africa
Data Table on Regional Comparison - Middle East and Africa

12.7.1 Saudi Arabia - Market size and forecast 2025-2030

Chart on Saudi Arabia - Market size and forecast 2025-2030 ($ million)
Data Table on Saudi Arabia - Market size and forecast 2025-2030 ($ million)
Chart on Saudi Arabia - Year-over-year growth 2025-2030 (%)
Data Table on Saudi Arabia - Year-over-year growth 2025-2030 (%)

12.7.2 UAE - Market size and forecast 2025-2030

Chart on UAE - Market size and forecast 2025-2030 ($ million)
Data Table on UAE - Market size and forecast 2025-2030 ($ million)
Chart on UAE - Year-over-year growth 2025-2030 (%)
Data Table on UAE - Year-over-year growth 2025-2030 (%)

12.7.3 South Africa - Market size and forecast 2025-2030

Chart on South Africa - Market size and forecast 2025-2030 ($ million)
Data Table on South Africa - Market size and forecast 2025-2030 ($ million)
Chart on South Africa - Year-over-year growth 2025-2030 (%)
Data Table on South Africa - Year-over-year growth 2025-2030 (%)

12.7.4 Israel - Market size and forecast 2025-2030

Chart on Israel - Market size and forecast 2025-2030 ($ million)
Data Table on Israel - Market size and forecast 2025-2030 ($ million)
Chart on Israel - Year-over-year growth 2025-2030 (%)
Data Table on Israel - Year-over-year growth 2025-2030 (%)

12.7.5 Turkey - Market size and forecast 2025-2030

Chart on Turkey - Market size and forecast 2025-2030 ($ million)
Data Table on Turkey - Market size and forecast 2025-2030 ($ million)
Chart on Turkey - Year-over-year growth 2025-2030 (%)
Data Table on Turkey - Year-over-year growth 2025-2030 (%)

12.8 Market opportunity by geography

Market opportunity by geography ($ million)
Data Tables on Market opportunity by geography ($ million)

13. Drivers, Challenges, and Opportunity

13.1 Market drivers

Escalating demand for convenience foods amidst urbanization and modern lifestyles
Proliferation of plant-based diets and flexitarianism
Widespread product innovation and premiumization

13.2 Market challenges

Pervasive supply chain volatility and input cost escalation
Navigating complex and increasingly stringent regulatory landscape
Intense competition, market saturation, and rise of private labels

13.3 Impact of drivers and challenges

Impact of drivers and challenges in 2025 and 2030

13.4 Market opportunities

Ascendancy of health and wellness formulations
Proliferation of plant based and alternative protein innovations
Convergence of convenience and premiumization

14. Competitive Landscape

14.1 Overview

14.2

Overview on criticality of inputs and factors of differentiation

14.3 Landscape disruption

Overview on factors of disruption

14.4 Industry risks

Impact of key risks on business

15. Competitive Analysis

15.1 Companies profiled

Companies covered

15.2 Company ranking index

15.3 Market positioning of companies

Matrix on companies position and classification

15.4 Amys Kitchen Inc.

Amys Kitchen Inc. - Overview
Amys Kitchen Inc. - Product / Service
Amys Kitchen Inc. - Key offerings
SWOT

15.5 Beyond Meat Inc.

Beyond Meat Inc. - Overview
Beyond Meat Inc. - Product / Service
Beyond Meat Inc. - Key offerings
SWOT

15.6 Campbells Prime Meat Ltd.

Campbells Prime Meat Ltd. - Overview
Campbells Prime Meat Ltd. - Product / Service
Campbells Prime Meat Ltd. - Key offerings
SWOT

15.7 Don Lee Farms

Don Lee Farms - Overview
Don Lee Farms - Product / Service
Don Lee Farms - Key offerings
SWOT

15.8 Impossible Foods Inc.

Impossible Foods Inc. - Overview
Impossible Foods Inc. - Product / Service
Impossible Foods Inc. - Key offerings
SWOT

15.9 J Sainsbury plc

J Sainsbury plc - Overview
J Sainsbury plc - Product / Service
J Sainsbury plc - Key news
J Sainsbury plc - Key offerings
SWOT

15.10 Kellanova

Kellanova - Overview
Kellanova - Business segments
Kellanova - Key offerings
Kellanova - Segment focus
SWOT

15.11 Marfrig Global Foods SA

Marfrig Global Foods SA - Overview
Marfrig Global Foods SA - Business segments
Marfrig Global Foods SA - Key offerings
Marfrig Global Foods SA - Segment focus
SWOT

15.12 Nestle SA

Nestle SA - Overview
Nestle SA - Business segments
Nestle SA - Key news
Nestle SA - Key offerings
Nestle SA - Segment focus
SWOT

15.13 Paragon Quality Foods Ltd.

Paragon Quality Foods Ltd. - Overview
Paragon Quality Foods Ltd. - Product / Service
Paragon Quality Foods Ltd. - Key offerings
SWOT

15.14 Quality Burgers Ltd.

Quality Burgers Ltd. - Overview
Quality Burgers Ltd. - Product / Service
Quality Burgers Ltd. - Key offerings
SWOT

15.15 Rangeland Foods Ltd.

Rangeland Foods Ltd. - Overview
Rangeland Foods Ltd. - Product / Service
Rangeland Foods Ltd. - Key offerings
SWOT

15.16 The Kraft Heinz Co.

The Kraft Heinz Co. - Overview
The Kraft Heinz Co. - Business segments
The Kraft Heinz Co. - Key news
The Kraft Heinz Co. - Key offerings
The Kraft Heinz Co. - Segment focus
SWOT

15.17 The Kroger Co.

The Kroger Co. - Overview
The Kroger Co. - Product / Service
The Kroger Co. - Key news
The Kroger Co. - Key offerings
SWOT

15.18 Tyson Foods Inc.

Tyson Foods Inc. - Overview
Tyson Foods Inc. - Business segments
Tyson Foods Inc. - Key news
Tyson Foods Inc. - Key offerings
Tyson Foods Inc. - Segment focus
SWOT

16. Appendix

16.1 Scope of the report

Market definition
Objectives
Notes and caveats

16.2 Inclusions and exclusions checklist

Inclusions checklist
Exclusions checklist

16.3 Currency conversion rates for US$

16.4 Research methodology

16.5 Data procurement

Information sources

16.6 Data validation

16.7 Validation techniques employed for market sizing

16.8 Data synthesis

16.9 360 degree market analysis

16.10 List of abbreviations

Research Methodology

Technavio presents a detailed picture of the market by way of study, synthesis, and summation of data from multiple sources. The analysts have presented the various facets of the market with a particular focus on identifying the key industry influencers. The data thus presented is comprehensive, reliable, and the result of extensive research, both primary and secondary.

INFORMATION SOURCES

Primary sources

  • Manufacturers and suppliers
  • Channel partners
  • Industry experts
  • Strategic decision makers

Secondary sources

  • Industry journals and periodicals
  • Government data
  • Financial reports of key industry players
  • Historical data
  • Press releases

DATA ANALYSIS

Data Synthesis

  • Collation of data
  • Estimation of key figures
  • Analysis of derived insights

Data Validation

  • Triangulation with data models
  • Reference against proprietary databases
  • Corroboration with industry experts

REPORT WRITING

Qualitative

  • Market drivers
  • Market challenges
  • Market trends
  • Five forces analysis

Quantitative

  • Market size and forecast
  • Market segmentation
  • Geographical insights
  • Competitive landscape

Interested in this report?

Get your sample now to see our research methodology and insights!

Download Now

Frequently Asked Questions

Packaged Burgers market growth will increase by USD 3876.0 million during 2026-2030.

The Packaged Burgers market is expected to grow at a CAGR of 8.6% during 2026-2030.

Packaged Burgers market is segmented by Type (Frozen burgers, Chilled burgers, Fresh burgers) Product type (Beef, Chicken, Plant-based, Others) Distribution channel (Supermarkets and hypermarkets, Convenience stores, Online retail, Others)

Acabonac Farms LLC, Amys Kitchen Inc., Beyond Meat Inc., Bubba Foods LLC, Campbells Prime Meat Ltd., Cremonini S.p.A., DiLuigi Foods Inc., Don Lee Farms, Dr. Praegers Sensible Foods Inc., Impossible Foods Inc., J Sainsbury plc, Kellanova, Marfrig Global Foods SA, Nestle SA, Paragon Quality Foods Ltd., Quality Burgers Ltd., Rangeland Foods Ltd., The Kraft Heinz Co., The Kroger Co., Tyson Foods Inc. are a few of the key vendors in the Packaged Burgers market.

Europe will register the highest growth rate of 44.2% among the other regions. Therefore, the Packaged Burgers market in Europe is expected to garner significant business opportunities for the vendors during the forecast period.

Germany, UK, France, Italy, Spain, The Netherlands, US, Canada, Mexico, China, Japan, India, South Korea, Thailand, Indonesia, Brazil, Argentina, Chile, Saudi Arabia, UAE, South Africa, Israel, Turkey

  • Escalating demand for convenience foods amidst urbanization and modern lifestyles is the driving factor this market.

The Packaged Burgers market vendors should focus on grabbing business opportunities from the Type segment as it accounted for the largest market share in the base year.
RIA - Research AI Assistant
Ask RIA