India Pallet Market Size 2025-2029
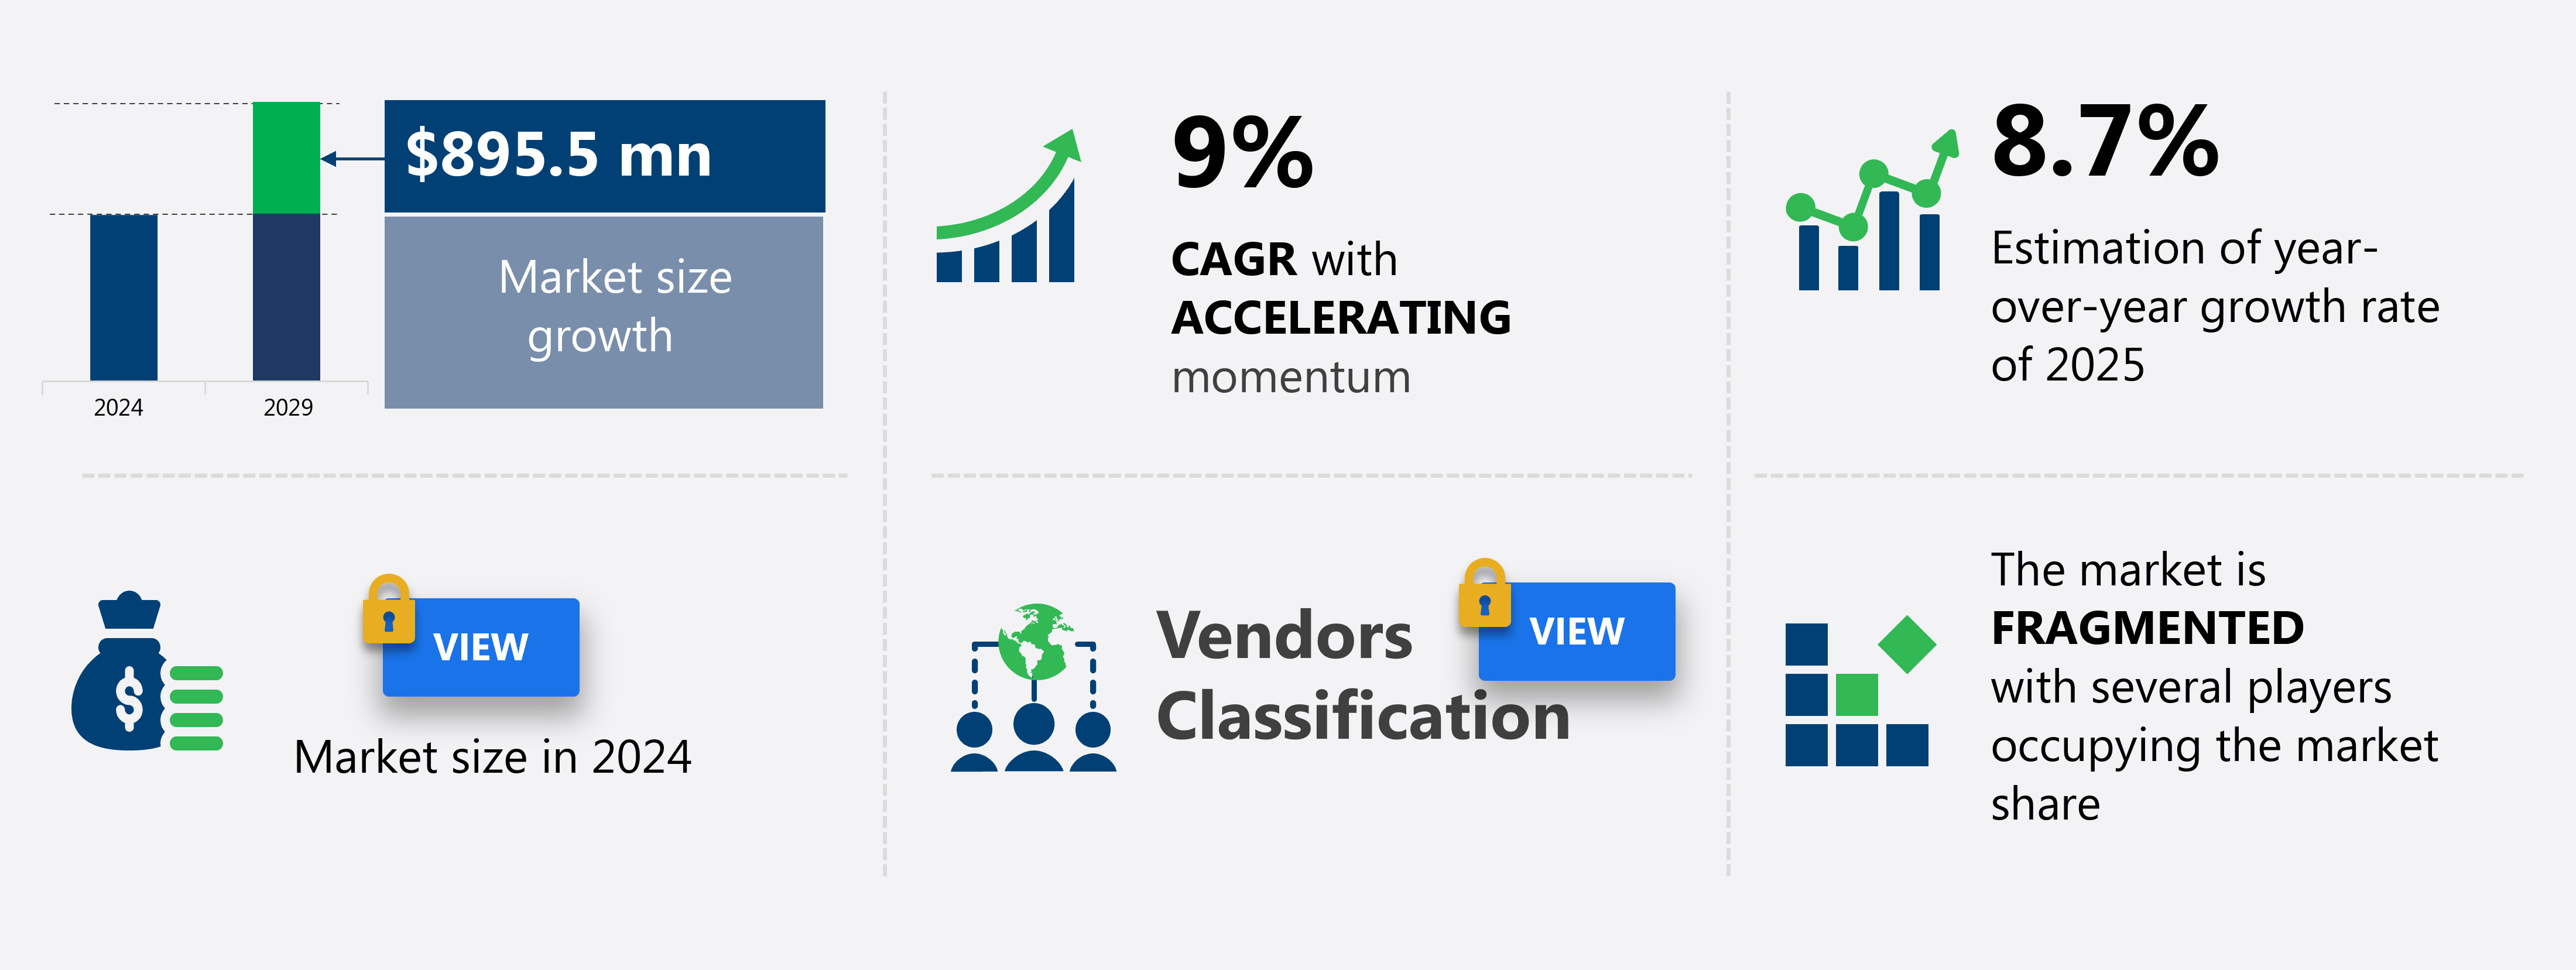
The India pallet market size is forecast to increase by USD 895.5 million, at a CAGR of 9% between 2024 and 2029.
- The market is experiencing significant growth due to several key factors. The expanding manufacturing sector in countries like India is driving market demand. Additionally, the adoption of reusable pallets is gaining traction as businesses seek to reduce costs and minimize waste. However, market trends are not without challenges. The market is also influenced by industry trends, such as e-commerce logistics, pooling services, and the growing importance of sustainability in packaging and logistics. Volatility in raw material prices poses a significant risk to market growth. Producers must navigate these price fluctuations to maintain profitability and meet customer demands. Overall, the market is poised for continued growth, with these trends and challenges shaping its future trajectory.
What will be the Size of the market during the Forecast Period?
How is this market segmented and which is the largest segment?
The market research report provides comprehensive data (region-wise segment analysis), with forecasts and estimates in "USD million" for the period 2025-2029, as well as historical data from 2019-2023 for the following segments.
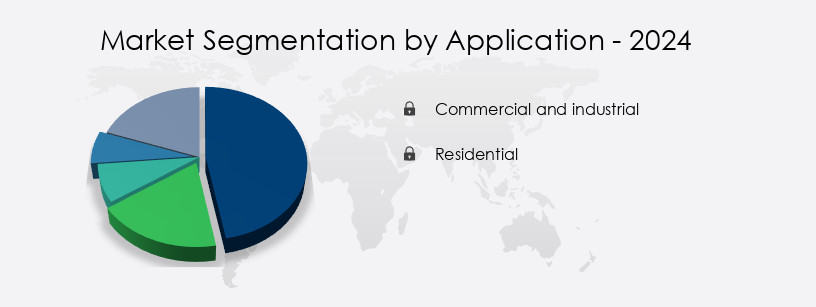
- Application
- Commercial and industrial
- Residential
- End-user
- Food and beverages
- Chemicals and pharmaceuticals
- Retail
- Construction
- Others
- Material
- Wood
- Plastic
- Metal
- Corrugated paper
- Geography
- India
By Application Insights
- The commercial and industrial segment is estimated to witness significant growth during the forecast period. The market's commercial and industrial segment is projected to expand due to the rising usage of pallets in commercial and industrial applications. This segment includes structures such as warehouses and industrial buildings. The segment's growth is attributed to India's significant investment in commercial and industrial activities during the forecast period. Factors fueling this growth include the government's decision to permit 100% foreign direct investment (FDI) in the construction industry, a thriving economy, an increase in industrial projects, and infrastructure development initiatives like Bharatmala and Sagarmala.
- Additionally, the market is influenced by trends in logistics optimization, warehouse automation solutions, material handling efficiency, safety, and sustainability. The market also focuses on circular economy principles, such as recycling and carbon footprint reduction, to promote sustainability. Regulations and compliance, material selection, and design software are essential considerations in the market. The market encompasses various sectors, including automotive, chemical, construction, e-commerce logistics, and manufacturing processes.
Get a glance at the market report of share of various segments Request Free Sample
Market Dynamics
The market encompasses a diverse range of products used for transporting and storing various goods, including wood, such as pine, oak, and Douglas fir, as well as aluminum and composite materials. This market caters to numerous industries, with significant demand from e-commerce, retail, and logistics sectors. The increasing adoption of automation and material handling equipment, like forklifts and conveyors, in warehousing and supply chain management drives market growth. Wooden pallets remain a popular choice due to their durability and recyclability, while plastic pallets offer advantages in terms of lightweight and stackability. The market also includes pallets made from corrugated paper and recyclable materials, reflecting the growing emphasis on sustainability.
Industries like chemicals and pharmaceuticals, which require specific pallet types for handling hazardous materials, contribute to the market's sizeable revenue. Modernization trends in material handling systems, such as the integration of robotics and compression or rotational molding, further boosts market expansion. Overall, the market is expected to continue growing, driven by the evolving needs of various industries and the ongoing modernization of logistics and warehousing operations.
Our India Pallet Market researchers analyzed the data with 2024 as the base year, along with the key drivers, trends, and challenges. A holistic analysis of drivers will help companies refine their marketing strategies to gain a competitive advantage.
What are the key market drivers leading to the rise in adoption of India Pallet Market?
- Growing manufacturing industry in India is the key driver of the market. The Indian manufacturing industry is experiencing significant growth, attracting both local and international investments. The company aims to increase its leased pallet inventory to 300,000 units by the end of 2022-2023 and 2 million units by 2025-2026. India's competitive edge includes a large, low-cost labor force and regulatory reforms that have improved the business environment. This has led to a rise in new manufacturing companies, as the industry adapts to market dynamics such as material handling efficiency, safety, and supply chain optimization. Inspection and certification are crucial aspects of the pallet market, ensuring compliance with regulations and enhancing the lifespan of pallets. Collaborative robots, or cobots, are increasingly being used in material handling, while logistics software and warehouse management systems facilitate efficient operations.
- Weight capacity, dimensions, and material selection are essential factors in pallet design, with a focus on sustainability and recycling. Innovation in pallet design and manufacturing processes includes the use of composite wood, nestable pallets, and circular economy principles. Reusable pallets, such as stackable and rackable options, are gaining popularity due to their durability and cost-effectiveness. Manufacturing processes for pallets involve careful material selection and handling equipment optimization to improve efficiency and reduce the carbon footprint. Regulations and safety standards, including those related to weight capacity, chemical handling, and environmental impact, are essential considerations. Repair services and recycling programs are essential for extending the lifecycle of pallets and reducing waste.
What are the market trends shaping the India Pallet Market?
- Adoption of reusable pallets is the upcoming trend in the market. Reusable pallets, crafted from durable materials like wood and plastic, are essential components of an efficient and safe supply chain. These pallets, which can be used multiple times, are increasingly preferred by corporations to transport sensitive goods due to their resistance to warping, shrinking, and splintering, even in extreme weather conditions. Reusable plastic pallets, in particular, offer significant advantages, including cost savings and a faster return on investment (ROI) through repeated use. The logistics industry's shift towards reusable pallets is driven by the need for sustainability and material efficiency. Reusable pallets are designed to withstand the rigors of the logistics system, ensuring that goods are handled safely and efficiently.
- By reducing the need for constant pallet replacement, corporations can save money and minimize waste. Inspection, certification, and repair services play a crucial role in extending the lifespan of reusable pallets. Management systems, such as warehouse automation solutions and logistics software, help optimize material handling efficiency, safety, and supply chain optimization. Regulations, such as safety and environmental impact assessments, are essential considerations when selecting and using reusable pallets. Recycling and the circular economy are also essential aspects of the reusable pallet market.
- E-commerce logistics and pooling services have further fueled the growth of the reusable pallet market, with an increasing focus on sustainability, traceability, and carbon footprint reduction. Innovation, such as stacking solutions, tertiary packaging, and handling equipment, continues to drive the market forward. Material selection, handling, storage, and stacking are critical factors in the design and use of reusable pallets. Wood sourcing, composite wood, and metal pallets are common options, each with its unique advantages and disadvantages. The market for reusable pallets is diverse, encompassing various types, such as stackable pallets, nestable pallets, and display pallets.
What challenges does India Pallet Market face during the growth?
- Volatility in raw material prices is a key challenge affecting the market growth. The market is influenced by various factors, including raw material prices, particularly those of wood. Wood prices can be volatile due to global economic conditions and the availability of raw materials. The decrease in new tree plantations and increase in deforestation have led to a scarcity of wood, causing price fluctuations. Despite this, some industries, such as manufacturing and logistics, continue to rely heavily on wood pallets for material handling efficiency and storage solutions. To mitigate the impact of price volatility and ensure regulatory compliance, collaboration with advanced technologies like inspection software, lifecycle management systems, and automation solutions is essential.
- Innovations in material handling equipment, such as collaborative robots (cobots), and warehouse management systems can improve material selection, efficiency, and sustainability. The circular economy is gaining traction, with a focus on recycling, reusable pallets, and sustainable packaging trends. Regulations regarding safety, cleanliness, and weight capacity are increasingly important, with industry news emphasizing the importance of compliance and environmental impact assessment. Logistics optimization, including four-way entry, nestable pallets, and pooling services, can help reduce carbon footprint and enhance supply chain optimization. Additionally, the adoption of handling, storage, and stacking solutions, such as solid deck pallets, stackable pallets, and metal pallets, can improve overall material handling efficiency.
Exclusive Customer Landscape
The market forecasting report includes the adoption lifecycle of the market, covering from the innovator's stage to the laggard's stage. It focuses on adoption rates in different regions based on penetration. Furthermore, the market report also includes key purchase criteria and drivers of price sensitivity to help companies evaluate and develop their market growth analysis strategies.

Customer Landscape
Key Companies & Market Insights
Companies are implementing various strategies, such as strategic alliances, market forecast, partnerships, mergers and acquisitions, geographical expansion, and product/service launches, to enhance their presence In the market.
Aristoplast Products Pvt. Ltd. - The company offers pallets such as Steel reinforcement, 121014 L, 121016 HW, 121016 MW, 121016 LW, 121015 FT, 121015 MW, 121015 CFT, 1201008 CFT, 121013 LW CFT, and 121013 HW CFT.
The market research and growth report includes detailed analyses of the competitive landscape of the market and information about key companies, including:
- Akash Industries
- AKS Packaging Solutions Ind.
- B. D. Industries India Pvt. Ltd.
- Brambles Ltd.
- DNA Packaging Systems
- DONRACKS TMTE Metal Tech Pvt Ltd
- Ergen Plastic Industries
- EXZOD India Pvt Ltd.
- Giraffe Storage Solutions
- Greif Inc.
- Hitech Innovations
- ImPakt Packaging
- Jay Wood Industry
- LEAP India Pvt. Ltd.
- Maxstor Pty Ltd
- NEFAB GROUP
- Nilkamal Ltd.
- Stakall
- The Supreme Industries Ltd.
Qualitative and quantitative analysis of companies has been conducted to help clients understand the wider business environment as well as the strengths and weaknesses of key market players. Data is qualitatively analyzed to categorize companies as pure play, category-focused, industry-focused, and diversified; it is quantitatively analyzed to categorize companies as dominant, leading, strong, tentative, and weak.
Recent Developments and News
-
In January 2025, Nilkamal Ltd. launched recyclable HDPE plastic pallets for the food and beverage sector, targeting 35.6% market share by 2025, supporting the market's growth to INR 1530.94 million.
-
In November 2024, LEAP India Pvt. Ltd. collaborated with an IoT provider to integrate RFID tracking into pallet pooling, reducing pallet loss by 20% and aiding market growth to USD 2.97 billion by 2031.
-
In September 2024, The Supreme Industries Ltd. acquired a Gujarat-based pallet manufacturer, adding 5 million units annually to its capacity, aligning with market growth to 372.9 million units by 2033.
-
In December 2024, Schoeller Allibert opened a Bengaluru facility producing 3 million plastic pallets yearly, cutting costs by 15% and supporting market growth to USD 895.5 million by 2029.
Research Analyst Overview
The market encompasses a diverse range of products and solutions that play a crucial role in the efficient movement and storage of goods within various industries. This market is characterized by continuous innovation and adaptation to meet evolving logistical needs and regulatory requirements. One significant trend in the pallet market is the integration of collaborative robots (cobots) in material handling processes. These robots enhance material handling efficiency and promote safety by assisting human workers in lifting, transporting, and stacking heavy loads. The use of cobots also contributes to supply chain optimization and compliance with safety regulations. Another area of focus in the pallet market is the development of advanced logistics software and warehouse management systems.
Further, these systems facilitate efficient tracking, data management, and optimization of warehouse operations. They enable real-time monitoring of inventory levels, automation of order processing, and integration with transportation management systems. Regulations play a pivotal role in shaping the pallet market. Stringent safety regulations mandate the use of certified pallets and handling equipment to ensure the safety of workers and reduce the risk of damage during transportation. Additionally, environmental regulations drive the adoption of sustainable pallet solutions, such as those made from recycled materials or with a lower carbon footprint. The pallet market is also influenced by various market dynamics, including price fluctuations and material selection.
In addition, wood prices and availability impact the cost and availability of wooden pallets, while plastic pallets offer a more consistent price and longer lifespan. The manufacturing process and durability of different pallet materials also impact their cost-effectiveness and environmental impact. Innovation continues to drive growth in the market, with new designs and technologies emerging to address specific industry needs. For example, nestable pallets offer space-saving storage solutions, while four-way entry pallets enable easier handling and transportation. Additionally, the adoption of circular economy principles is leading to the development of reusable and recyclable pallets, contributing to sustainability efforts and reducing waste.
|
Market Scope |
|
|
Report Coverage |
Details |
|
Page number |
177 |
|
Base year |
2024 |
|
Historic period |
2019-2023 |
|
Forecast period |
2025-2029 |
|
Growth momentum & CAGR |
Accelerate at a CAGR of 9% |
|
Market growth 2025-2029 |
USD 895.5 million |
|
Market structure |
Fragmented |
|
YoY growth 2024-2025(%) |
8.7 |
|
Competitive landscape |
Leading Companies, Market Positioning of Companies, Competitive Strategies, and Industry Risks |
What are the Key Data Covered in this Market Research and Growth Report?
- CAGR of the market during the forecast period
- Detailed information on factors that will drive the market growth and forecasting between 2025 and 2029
- Precise estimation of the size of the market and its contribution of the market in focus to the parent market
- Accurate predictions about upcoming market growth and trends and changes in consumer behaviour
- Growth of the market across India
- Thorough analysis of the market's competitive landscape and detailed information about companies
- Comprehensive analysis of factors that will challenge the growth of market companies
We can help! Our analysts can customize this market research report to meet your requirements. Get in touch