Palm Oil Market Size 2025-2029
The palm oil market size is valued to increase USD 54.4 billion, at a CAGR of 9% from 2024 to 2029. Increasing consumer awareness regarding health benefits of palm oil will drive the palm oil market.
Major Market Trends & Insights
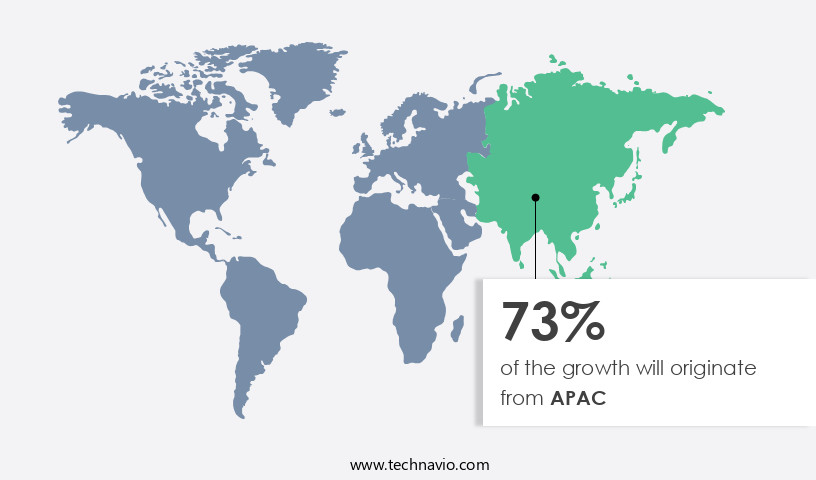
- APAC dominated the market and accounted for a 73% growth during the forecast period.
- By Application - Edible oil segment was valued at USD 54.00 billion in 2023
- By Type - Conventional segment accounted for the largest market revenue share in 2023
Market Size & Forecast
- Market Opportunities: USD 92.90 billion
- Market Future Opportunities: USD 54.40 billion
- CAGR : 9%
- APAC: Largest market in 2023
Market Summary
- The market encompasses the production, refining, and distribution of palm oil and its derivatives. This dynamic market is driven by the increasing demand for palm oil in core applications, such as food, cosmetics, and biodiesel. According to recent reports, the food industry accounts for approximately 65% of palm oil consumption, with the biodiesel sector emerging as a significant growth avenue. However, the market faces challenges from environmental concerns, particularly regarding deforestation and plant diversity losses. In 2020, it was estimated that around 10 million hectares of forest were lost due to palm oil cultivation. Despite these challenges, opportunities for sustainable production and innovative technologies continue to unfold, ensuring the market remains a vital and evolving sector in the global economy.
What will be the Size of the Palm Oil Market during the forecast period?

Get Key Insights on Market Forecast (PDF) Request Free Sample
How is the Palm Oil Market Segmented and what are the key trends of market segmentation?
The palm oil industry research report provides comprehensive data (region-wise segment analysis), with forecasts and estimates in "USD billion" for the period 2025-2029, as well as historical data from 2019-2023 for the following segments.
- Application
- Edible oil
- Surfactants
- Bio-diesel
- Others
- Type
- Conventional
- Organic
- Geography
- Europe
- Germany
- UK
- Middle East and Africa
- Qatar
- UAE
- APAC
- China
- India
- Indonesia
- Malaysia
- Pakistan
- Rest of World (ROW)
- Europe
By Application Insights
The edible oil segment is estimated to witness significant growth during the forecast period.
Palm oil, a widely used edible oil, holds significant importance in various industries, particularly in Asia. Approximately 45% of global palm oil production is attributed to palm fruit oil, primarily used in food processing due to its lower trans fat content and cost-effectiveness. Palm kernel oil, the other form, accounts for around 25% of the production. The food sector's reliance on palm oil is increasing, with an estimated 67% of its usage in food manufacturing. Moreover, the environmental impact of palm oil production is a growing concern. To address this, initiatives focusing on deforestation monitoring, water use efficiency, extraction rate optimization, and carbon footprint reduction are gaining traction.
The industry is also investing in soil nutrient management, palm oil byproducts utilization, and traceability systems to enhance supply chain transparency. The market's future growth is promising, with an anticipated 20% increase in demand for palm oil byproducts in the next five years. Additionally, there is a rising trend towards sustainable palm oil production, with RSPO certification becoming increasingly common. Oil palm cultivation is also evolving, with the adoption of high-yielding varieties, integrated pest management, and oil palm genetics. In terms of production processes, improvements in palm oil fractionation, fertilizer application techniques, biodiesel production, and irrigation efficiency are essential for maintaining competitiveness.

The Edible oil segment was valued at USD 54.00 billion in 2019 and showed a gradual increase during the forecast period.
Furthermore, biomass utilization and palm oil refining are being explored to minimize waste and optimize resource utilization. Smallholder farmers are also receiving support to improve their productivity and sustainability through various initiatives. These efforts aim to ensure the long-term viability of the palm oil industry while minimizing its environmental impact.

Regional Analysis
APAC is estimated to contribute 73% to the growth of the global market during the forecast period. Technavio's analysts have elaborately explained the regional trends and drivers that shape the market during the forecast period.
See How Palm Oil Market Demand is Rising in APAC Request Free Sample
The market in the Asia Pacific (APAC) region experiences significant growth, driven by the expanding economies of China, Australia, Thailand, South Korea, and India. India, in particular, is a major importer of palm oil globally. In the energy sector, palm oil serves as a viable alternative to mineral oil in power generation. Indonesia and Malaysia are the leading palm oil producers, with other tropical nations in South America, APAC, and Africa contributing as well. Malaysia is also a significant exporter of palm oil to the United Arab Emirates (UAE).
The demand for palm oil is escalating in the manufacturing of halal-certified processed foods and cosmetics, further fueling market expansion.
Market Dynamics
Our researchers analyzed the data with 2024 as the base year, along with the key drivers, trends, and challenges. A holistic analysis of drivers will help companies refine their marketing strategies to gain a competitive advantage.
The market is a significant player in the agricultural industry, with oil palm smallholder farmers contributing a substantial portion of the production. To enhance productivity, there is a growing focus on improving mill extraction rates and implementing sustainable palm oil certification schemes. These initiatives aim to reduce the environmental impact of palm oil production while ensuring ethical sourcing. Advanced technologies are playing a pivotal role in the palm oil processing sector. For instance, optimizing fertilizer use through precision agriculture and implementing water management strategies are crucial for sustainable oil palm cultivation. Genetic improvement of high-yielding palm trees is another area of investment, with breeding programs focusing on enhancing productivity while reducing the environmental footprint.
The impact of climate change on oil palm yields is a pressing concern. As temperatures rise and rainfall patterns shift, best practices for sustainable palm oil production are being reevaluated. Remote sensing applications for monitoring deforestation and crop diversification strategies within oil palm plantations are becoming increasingly important. More than 70% of new technological developments in palm oil processing focus on improving waste management solutions for oil mills. Economic feasibility of sustainable palm oil production is a critical factor driving these investments. Soil health management techniques and integrated pest management strategies are also essential components of sustainable palm oil production.
Palm oil byproduct utilization for biofuel is another area of growth. Traceability technologies in palm oil supply chains are increasingly being adopted to ensure transparency and ethical sourcing. The industrial application segment accounts for a significantly larger share of palm oil consumption compared to the food sector. In conclusion, the market is undergoing a transformation, driven by a need for sustainability, productivity, and innovation. The adoption of advanced technologies, optimization of resource use, and a focus on reducing environmental impact are key trends shaping the market's future.

What are the key market drivers leading to the rise in the adoption of Palm Oil Industry?
- The significant growth of the market can be attributed to the increasing consumer awareness and understanding of the health benefits associated with palm oil.
- Palm oil, recognized for its perceived natural benefits, experiences growing demand due to its application in promoting healthier lifestyles and cooking. This trend propels market expansion, with crude palm oil (CPO) and palm kernel oil (PKO) leading the charge. CPO dominates The market, accounting for a substantial 58.3% revenue share.
- The versatility of PKO extends beyond edible applications, as it is increasingly used as feedstock for animal feed and biomass production, further fueling sales growth.
What are the market trends shaping the Palm Oil Industry?
- The emerging trend in the biodiesel industry presents a new growth opportunity for palm oil production. Palm oil is poised to play a significant role in the upcoming biodiesel market.
- Biofuel, an alternative energy source derived from plant biomass, is rapidly expanding its reach in various sectors. Biofuels serve as energy carriers, releasing embedded energy through combustion or conversion. Among different types, biodiesel stands out for its sustainability and cleaner emissions. First-generation biodiesel feedstocks, such as edible vegetable oils like soybean, palm, and sunflower oil, were the initial choices for biodiesel production. However, the growing demand for food and the environmental impact of using edible oils for fuel have led to the exploration of alternative feedstocks. Second-generation biodiesel feedstocks, including non-edible vegetable oils (jatropha, mahua, jojoba oil, salmon oil, sea mango), animal fats, used cooking oils, agricultural and solid municipal wastes, offer a more sustainable solution.
- These feedstocks reduce the pressure on food crops and offer a wider range of sources. The third-generation biodiesel feedstock, microalgae, cyanobacteria, and other single-celled oleaginous microorganisms, holds immense potential due to their high oil content and rapid growth rates. These feedstocks can be produced in large quantities using minimal land and water resources, making them an attractive option for the future of biodiesel production. Biofuel's continuous evolution and expanding applications underscore its importance as a viable alternative energy source.
What challenges does the Palm Oil Industry face during its growth?
- The issue of deforestation and resulting plant diversity losses poses a significant challenge to the growth of the industry. This concern, rooted in the environmental implications of industrial expansion, necessitates a proactive approach to sustainable practices and conservation efforts.
- The market faces significant challenges, including deforestation and plant diversity loss, which threaten the sustainability of this vital commodity. Indonesia and Malaysia, producing 85% of the world's palm oil, grapple with these issues as they strive for sustainable and organic production. Deforestation not only affects natural resources but also contributes to climate change, posing challenges for the global food production system.
- Furthermore, the endangered Orangutan and Sumatran Rhino populations are under threat due to palm oil tree plantations. Consequently, forest departments and government bodies are taking steps to prevent land allocation for cultivation. This shift towards sustainability reflects the evolving market dynamics, as stakeholders increasingly prioritize environmental concerns and ethical production practices.
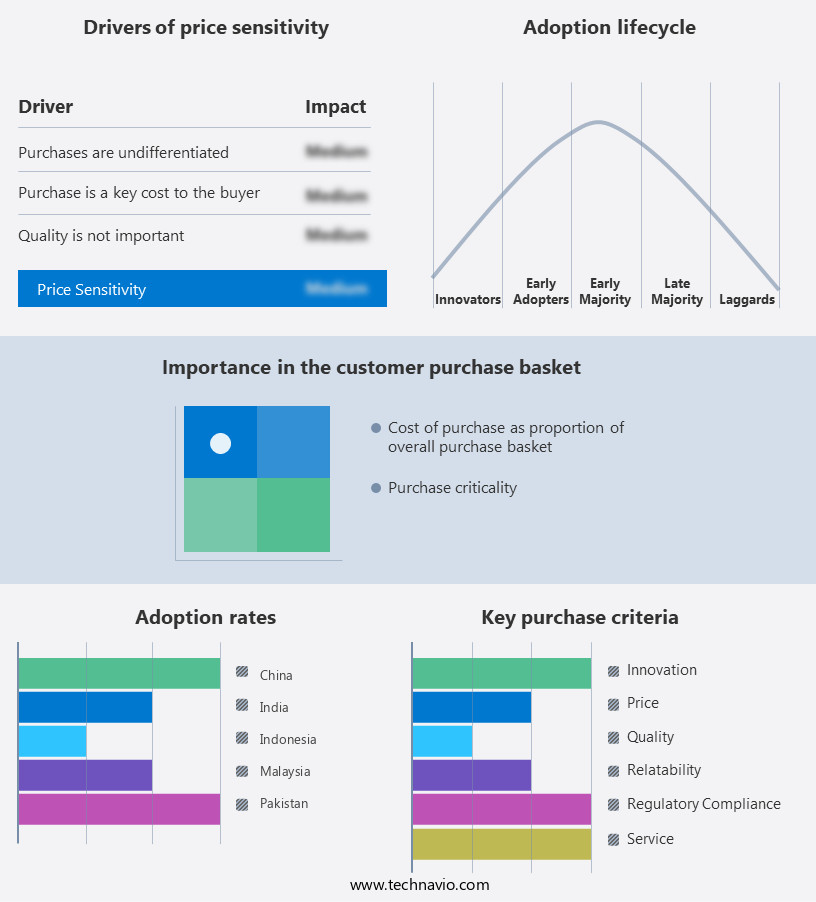
Exclusive Technavio Analysis on Customer Landscape
The palm oil market forecasting report includes the adoption lifecycle of the market, covering from the innovator's stage to the laggard's stage. It focuses on adoption rates in different regions based on penetration. Furthermore, the palm oil market report also includes key purchase criteria and drivers of price sensitivity to help companies evaluate and develop their market growth analysis strategies.
Customer Landscape of Palm Oil Industry
Competitive Landscape
Companies are implementing various strategies, such as strategic alliances, palm oil market forecast, partnerships, mergers and acquisitions, geographical expansion, and product/service launches, to enhance their presence in the industry.
Agarwal Industries P Ltd. - This company specializes in the production and distribution of refined, bleached palm olein oil. RBD Palm Olein oil is a high-quality, versatile edible oil derived from palm fruits.
The industry research and growth report includes detailed analyses of the competitive landscape of the market and information about key companies, including:
- Agarwal Industries P Ltd.
- Alami Commodities Sdn Bhd
- Alfa Laval AB
- Archer Daniels Midland Co.
- Asian Agri
- Best Industry Group
- Cargill Inc.
- Charleston Holdings Pte Ltd.
- Crowe LLP
- Godrej Agrovet Ltd
- Gujarat Ambuja Exports Ltd.
- IOI Corp. Berhad
- Kuala Lumpur Kepong Berhad
- Musim Mas Group
- Nisshin OilliO Group Ltd.
- Oil Palm India Ltd.
- Patanjali Ayurved Ltd.
- Sime Darby Plantation Berhad
- Sinar Mas
- Univanich Palm Oil Public Co. Ltd.
Qualitative and quantitative analysis of companies has been conducted to help clients understand the wider business environment as well as the strengths and weaknesses of key industry players. Data is qualitatively analyzed to categorize companies as pure play, category-focused, industry-focused, and diversified; it is quantitatively analyzed to categorize companies as dominant, leading, strong, tentative, and weak.
Recent Development and News in Palm Oil Market
- In January 2024, Wilmar International, a leading agribusiness company, announced the launch of its new sustainable palm oil brand, "GreenPalm," in collaboration with the Roundtable on Sustainable Palm Oil (RSPO). This initiative aimed to increase transparency and promote sustainable palm oil production (Wilmar International Press Release, 2024).
- In March 2024, Cargill and Archer Daniels Midland Company (ADM) formed a strategic partnership to jointly develop and commercialize innovative sustainable palm oil derivatives. This collaboration was aimed at addressing the growing demand for sustainable palm oil in the food, feed, and industrial sectors (Cargill Press Release, 2024).
- In May 2024, Musim Mas, the world's largest palm oil producer, secured a USD 300 million investment from the International Finance Corporation (IFC) to expand its sustainable palm oil production and processing capacity. This investment was expected to increase the company's sustainable palm oil production by 30% (IFC Press Release, 2024).
- In February 2025, the European Union (EU) passed a regulation banning the use of palm oil in biodiesel production from 2030, citing environmental concerns. This decision was expected to significantly impact the market, leading to a shift towards sustainable palm oil and alternative feedstocks (European Parliament Press Release, 2025).
Dive into Technavio's robust research methodology, blending expert interviews, extensive data synthesis, and validated models for unparalleled Palm Oil Market insights. See full methodology.
|
Market Scope |
|
|
Report Coverage |
Details |
|
Page number |
202 |
|
Base year |
2024 |
|
Historic period |
2019-2023 |
|
Forecast period |
2025-2029 |
|
Growth momentum & CAGR |
Accelerate at a CAGR of 9% |
|
Market growth 2025-2029 |
USD 54.4 billion |
|
Market structure |
Fragmented |
|
YoY growth 2024-2025(%) |
8.2 |
|
Key countries |
Indonesia, India, China, Pakistan, Malaysia, Saudi Arabia, UAE, Qatar, UK, and Germany |
|
Competitive landscape |
Leading Companies, Market Positioning of Companies, Competitive Strategies, and Industry Risks |
Research Analyst Overview
- Palm oil, a versatile vegetable oil, occupies a significant role in the global market due to its extensive usage in various industries, including food, cosmetics, and biodiesel production. The market's dynamics are shaped by ongoing efforts to address environmental concerns and optimize production processes. One critical aspect is deforestation monitoring, with companies adopting advanced technologies to minimize forest destruction. Water use efficiency is another focus, as palm oil production consumes vast quantities. Extraction rate optimization is another priority, with improvements in palm kernel shell utilization and kernel oil processing reducing waste and enhancing profitability. Carbon footprint reduction is a continuous endeavor, with efforts underway to minimize greenhouse gas emissions through improved soil nutrient management and palm oil byproducts utilization.
- Traceability systems and supply chain transparency are essential for ensuring sustainability and addressing consumer concerns. Climate change adaptation strategies, such as crop diversification and environmental impact assessments, are crucial for long-term market sustainability. Fruit bunch yield enhancement, wastewater treatment, and land use change management are other areas of active research and development. Integrated pest management, oil palm genetics, and mesocarp oil extraction techniques are essential for maintaining high-yielding varieties and improving palm oil cultivation practices. Sustainable palm oil production, RSPO certification, and palm oil fractionation are key initiatives aimed at addressing environmental concerns and promoting industry best practices.
- Smallholder farmer support, fertilizer application techniques, biodiesel production, and oleochemical production are additional areas of growth within the palm oil sector. Irrigation efficiency, soil erosion control, palm oil milling, biomass utilization, and palm oil refining are other essential aspects of the market, with ongoing research and innovation driving continuous improvement.
What are the Key Data Covered in this Palm Oil Market Research and Growth Report?
-
What is the expected growth of the Palm Oil Market between 2025 and 2029?
-
USD 54.4 billion, at a CAGR of 9%
-
-
What segmentation does the market report cover?
-
The report segmented by Application (Edible oil, Surfactants, Bio-diesel, and Others), Type (Conventional and Organic), and Geography (APAC, Middle East and Africa, Europe, North America, and South America)
-
-
Which regions are analyzed in the report?
-
APAC, Middle East and Africa, Europe, North America, and South America
-
-
What are the key growth drivers and market challenges?
-
Increasing consumer awareness regarding health benefits of palm oil, Concerns about deforestation and plant diversity losses
-
-
Who are the major players in the Palm Oil Market?
-
Key Companies Agarwal Industries P Ltd., Alami Commodities Sdn Bhd, Alfa Laval AB, Archer Daniels Midland Co., Asian Agri, Best Industry Group, Cargill Inc., Charleston Holdings Pte Ltd., Crowe LLP, Godrej Agrovet Ltd, Gujarat Ambuja Exports Ltd., IOI Corp. Berhad, Kuala Lumpur Kepong Berhad, Musim Mas Group, Nisshin OilliO Group Ltd., Oil Palm India Ltd., Patanjali Ayurved Ltd., Sime Darby Plantation Berhad, Sinar Mas, and Univanich Palm Oil Public Co. Ltd.
-
Market Research Insights
- The market is a significant player in the global edible oils industry, with production reaching approximately 73.6 million metric tons in 2020. This represents a steady increase from the 68.5 million metric tons produced in 2018. The market's growth can be attributed to various factors, including productivity enhancement through plant growth regulators, processing optimization, and yield improvement strategies. Additionally, market access strategies, harvesting techniques, and integrated nutrient management have contributed to cost reduction measures and sustainable intensification. Iodine value and peroxide value are crucial quality indicators for palm oil.
- In 2020, the average iodine value was 46.5 g/100g, while the peroxide value was 11.5 meq/kg. These values demonstrate the importance of maintaining high-quality standards in the production process. As the market continues to evolve, mill efficiency improvement, yield forecasting, product diversification, and risk management strategies will play a crucial role in ensuring long-term success.
We can help! Our analysts can customize this palm oil market research report to meet your requirements.