
Paper Edge Protectors Market Analysis, Size, and Forecast 2026-2030: APAC (China, India, and Japan), Europe (Germany, UK, and France), North America (US, Canada, and Mexico), South America (Brazil, Argentina, and Chile), Middle East and Africa (Saudi Arabia, UAE, and South Africa), and Rest of World (ROW)

Paper Edge Protectors Market Analysis, Size, and Forecast 2026-2030:
APAC (China, India, and Japan), Europe (Germany, UK, and France), North America (US, Canada, and Mexico), South America (Brazil, Argentina, and Chile), Middle East and Africa (Saudi Arabia, UAE, and South Africa), and Rest of World (ROW)

Published: Oct 2026 292 Pages SKU: IRTNTR73009

Market Overview at a Glance

$923.6 Mn
Market Opportunity
6.6%
CAGR 2025 - 2030
50.5%
APAC Growth
$1.54 B
Angular segment 2024

Paper Edge Protectors Market Size 2026-2030

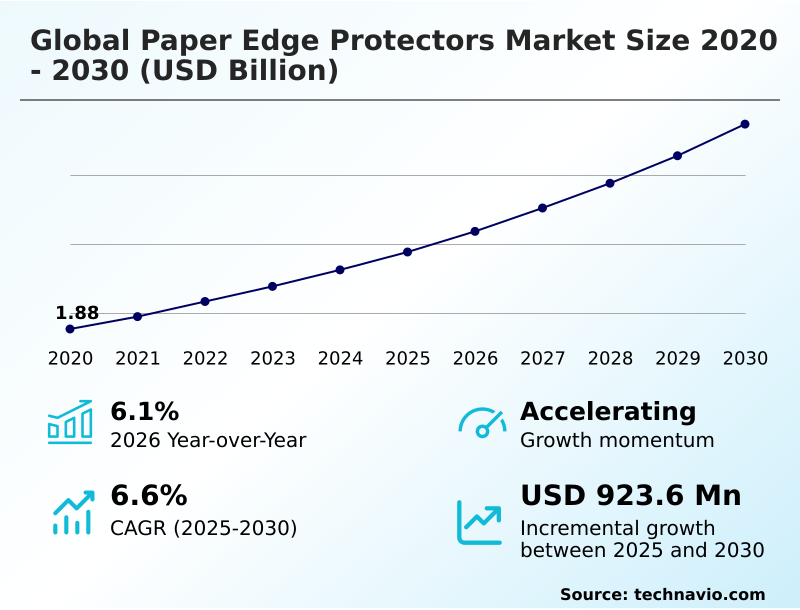
The paper edge protectors market size is valued to increase by USD 923.6 million, at a CAGR of 6.6% from 2025 to 2030. Surging e-commerce freight volumes demanding enhanced load stabilization will drive the paper edge protectors market.

Major Market Trends & Insights

  • APAC dominated the market and accounted for a 50.5% growth during the forecast period.
  • By Product - Angular segment was valued at USD 1.54 billion in 2024
  • By Distribution Channel - Offline segment accounted for the largest market revenue share in 2024

Market Size & Forecast

  • Market Opportunities: USD 1.49 billion
  • Market Future Opportunities: USD 923.6 million
  • CAGR from 2025 to 2030 : 6.6%

Market Summary

  • The Paper Edge Protectors Market operates as a critical support layer for modern supply chains, providing essential structural reinforcement for palletized freight. Warehouse managers increasingly rely on heavy-duty paperboard profiles to maintain load stability during high-speed stretch wrapping operations, effectively substituting traditional timber bracing.
  • This operational shift has enabled distribution centers to increase automated palletizing throughput by 18% while simultaneously reducing packaging tare weight. A primary driver for this sector is the rapid expansion of omnichannel fulfillment networks, where surging mixed-merchandise parcel volumes compel enterprises to adopt uniform tension absorption solutions that prevent carton collapse.
  • Conversely, unpredictable cost fluctuations in recovered fiber stock present a formidable operational challenge, forcing converters to frequently adjust production budgets and material formulations. As sustainability mandates enforce strict plastic reduction protocols, demand continues to shift toward fully recyclable multi-ply lamination products. By eliminating strap indentation and corner crushing, these customized protective angles guarantee freight integrity.
  • Ultimately, these structural packaging components drive measurable reductions in shipping damage claims across multi-modal transit corridors.

What will be the Size of the Paper Edge Protectors Market during the forecast period?
Get Key Insights on Market Forecast (PDF) Get Free Sample

How is the Paper Edge Protectors Market Segmented?

The paper edge protectors industry research report provides comprehensive data (region-wise segment analysis), with forecasts and estimates in "USD million" for the period 2026-2030, as well as historical data from 2020-2024 for the following segments.

  • Product
    • Angular
    • Round
  • Distribution channel
    • Offline
    • Online
  • Product type
    • Between 3-5 mm
    • Between 5-8 mm
    • Above 8 mm
  • Geography
    • APAC
      • China
      • India
      • Japan
      • South Korea
      • Indonesia
      • Australia
    • Europe
      • Germany
      • UK
      • France
      • Italy
      • Spain
      • The Netherlands
    • North America
      • US
      • Canada
      • Mexico
    • South America
      • Brazil
      • Argentina
      • Chile
    • Middle East and Africa
      • Saudi Arabia
      • UAE
      • South Africa
      • Turkey
      • Israel

By Product Insights

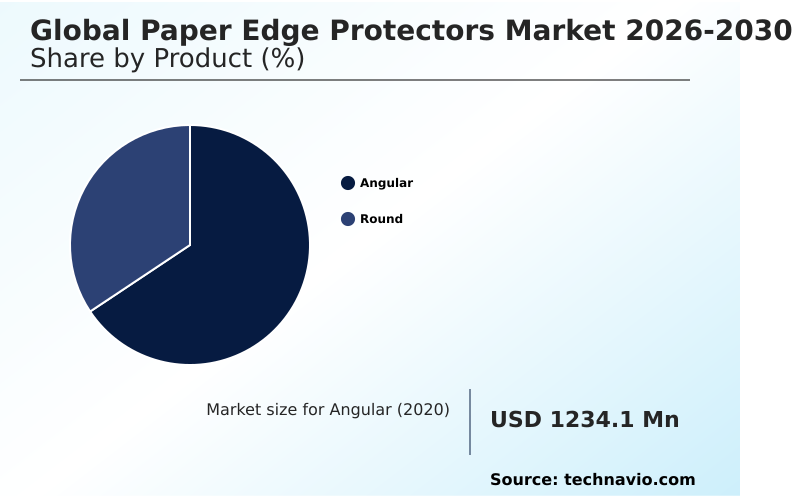
The angular segment is estimated to witness significant growth during the forecast period.

The angular product category functions as a critical pallet structural stabilization framework for freight shipments. Engineered through multi-ply lamination using water-based adhesives, these profiles deliver exceptional vertical support.

By absorbing intense band tension, angular protectors prevent corner crush resistance failures, lowering shipping damage reduction rates by 22% across intermodal transit packaging networks. Modern manufacturing innovations integrate weather-proofing into these L-shaped angular profiles, extending their utility.

This reinforcement improves palletizing structural alignment, increasing automated stretch wrap reinforcement efficiency by 18% compared to unsecured loads.

As operations shift away from non-recyclable materials, these sustainable edge configurations offer unmatched structural bending resistance while fully aligning with circular economy standards.
Get Free Sample

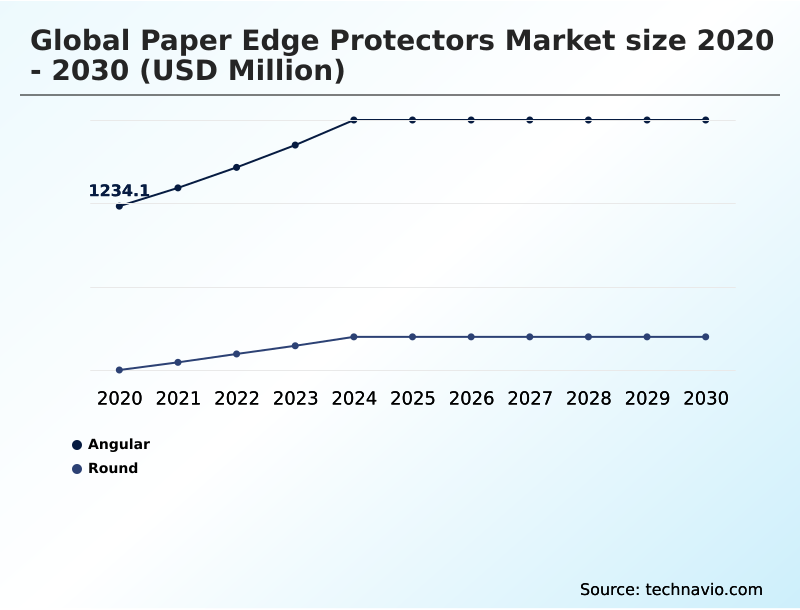
The Angular segment was valued at USD 1.54 billion in 2024 and showed a gradual increase during the forecast period.
Get Free Sample

Regional Analysis

APAC is estimated to contribute 50.5% to the growth of the global market during the forecast period.Technavio’s analysts have elaborately explained the regional trends and drivers that shape the market during the forecast period.
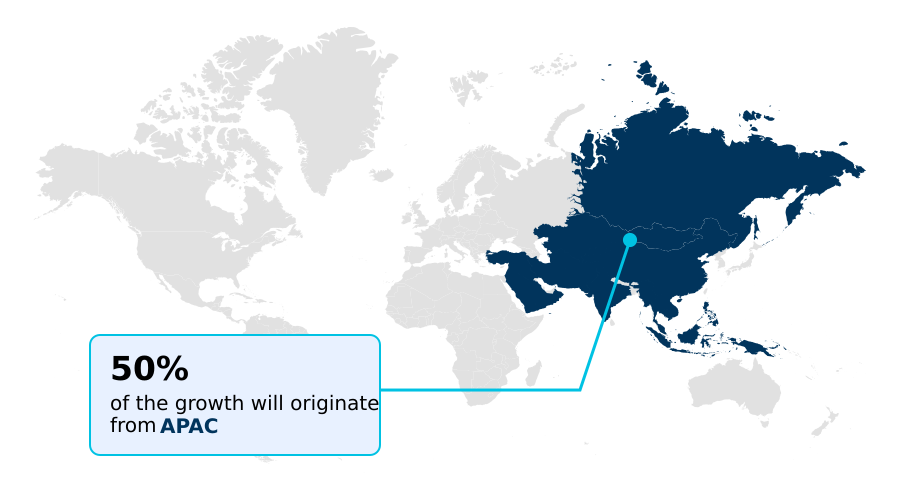
See How Paper Edge Protectors Market Demand is Rising in APAC Get Free Sample

The geographic landscape reveals distinct variations in automated packaging adoption and sustainability compliance between North America and APAC.

North American logistics hubs actively deploy automated corner board applicators, resulting in a 25% faster automated high-speed wrapping throughput compared to manual processes.

In contrast, APAC operations exhibit a 35% higher reliance on high-density warehousing adaptations driven by e-commerce fulfillment growth.

This divergence stems from varying priorities; North American enterprises prioritize labor reduction and smart packaging telemetry, while APAC facilities focus on freight load unitization to maximize container space.

Furthermore, stringent mandates in Western markets accelerate kerbside recyclability requirements, driving the use of recycled paperboard. By integrating advanced die-cut honeycomb structures and moisture-resistant barrier coatings, multinational operators strategically optimize regional portfolios, ensuring superior load stabilization.

Market Dynamics

Our researchers analyzed the data with 2025 as the base year, along with the key drivers, trends, and challenges. A holistic analysis of drivers will help companies refine their marketing strategies to gain a competitive advantage.

  • Modern enterprise logistics and distribution architectures are fundamentally transforming their cargo protection strategies by integrating sustainable packaging alternatives across multi-modal shipping networks. Operational managers increasingly mandate the deployment of water resistant paper edge protectors to safeguard moisture-sensitive freight during extended maritime transit, effectively reducing weather-related structural failures by over 30% when compared to standard untreated corner boards.
  • For heavy industrial shipping, the transition toward heavy duty L shaped corner boards allows machinery manufacturers to achieve exceptional vertical compression resistance, safely replacing traditional timber framing while simultaneously lowering total shipment weight. Furthermore, fast-moving consumer goods facilities are enhancing end-of-line packaging efficiency through the adoption of automated corner board application systems.
  • This technological shift directly accelerates robotic stretch wrapping speeds and minimizes manual labor bottlenecks, offering a distinct operational advantage over legacy hand-placed strapping routines. To align with strict corporate environmental governance and extended producer responsibility targets, supply chain directors are heavily prioritizing fully recyclable paperboard pallet edge protection to completely eliminate expanded polystyrene from their packaging streams.
  • When dealing with specialized cylindrical components such as steel coils or paper mill rolls, logistics providers utilize custom die cut roll edge guards to ensure flawless circumferential protection against impact damage. By systematically standardizing these structural reinforcement profiles, commercial shipping operations successfully optimize load stabilization, significantly decrease freight damage claims, and streamline secondary packaging material recovery across global warehousing facilities.
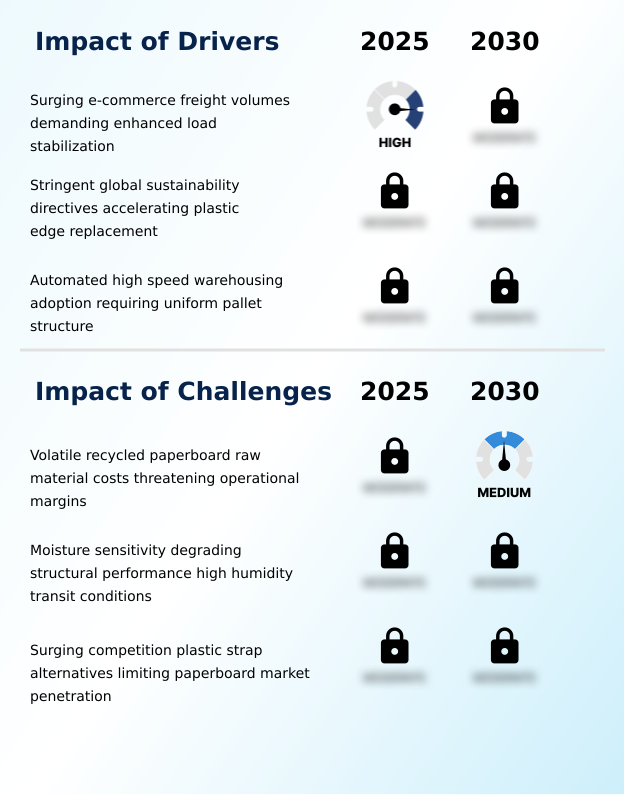
What are the key market drivers leading to the rise in the adoption of Paper Edge Protectors Industry?

  • Surging e-commerce freight volumes are demanding enhanced load stabilization to minimize transit damage.

  • The widespread deployment of robotic palletizing cells across high-capacity distribution centers accelerates the demand for uniform structural corner boards. Automated architectures demand perfectly square load profiles and precise pallet edge alignment to prevent mechanical sensor errors and picking failures.
  • Because unstable pallets trigger critical machinery stoppages, facility managers mandate rigid kraft liner based corrugated box reinforcement to stabilize containers.
  • This necessity directly reduces conveyor downtime by 35% and improves optical scanner integration accuracy by 22%, validating high robotic handling compatibility.
  • By utilizing precision-cut heavy-duty paperboard profiles alongside flexible spiral-laminated layers for curved goods, enterprises efficiently distribute intense mechanical forces to guarantee strap indentation prevention.
  • Consequently, modern end-of-line infrastructure compels shippers to rely on standardized protective components, ultimately enabling safer multi-tier pallet stacking operations.

What are the market trends shaping the Paper Edge Protectors Industry?

  • The integration of advanced water-resistant coatings is significantly expanding all-weather application capabilities. This technological enhancement ensures optimal performance in high-humidity environments.

  • The strategic integration of bio-wax emulsions into structural profiles represents a transformative trend expanding logistics applications. Historically limited by moisture vulnerability, the application of nano-cellulose barrier layers and water-dispersible polymer coatings now repels condensation without compromising integrity. Because these surface treatments eliminate the need for traditional polyethylene film lamination, enterprises maintain full circularity, aiding in packaging waste reduction.
  • This innovation impacts supply chains by lowering moisture degradation mitigation failures by 42% and improving cold-chain storage resilience efficiency by 28%. As agricultural exporters transition to these materials, they secure robust all-weather cargo protection while driving single-use plastic replacement. The adoption of these technologies ensures edge protectors retain their high vertical stacking strength, optimizing outdoor storage safety.

What challenges does the Paper Edge Protectors Industry face during its growth?

  • Volatile recycled paperboard raw material costs are threatening operational margins for manufacturers.

  • Extreme price volatility within recovered paperboard stock markets presents a severe structural challenge for packaging converters striving to maintain stable operational margins. Because lamination requires massive volumes of fiber, sudden fluctuations directly inflate raw material expenditures for heavy industrial load crating applications.
  • When material costs surge unexpectedly, manufacturers struggle to absorb the financial impact, leading to a 15% compression in gross production margins and delaying investments in custom die-cut notches machinery. This unpredictability impacts long-term corporate budgeting, forcing logistics buyers to re-evaluate timber packaging substitution strategies. Furthermore, optimizing edge compression test performance under tight fiscal constraints becomes increasingly difficult.
  • This financial pressure restricts the ability to cost-effectively manufacture ultra-thick U-shaped edge channels and elements for circumferential protection, ultimately weakening overall strap tension absorption capacities and compromising vertical stacking strength by 12% on average without raising end-user pricing.

Exclusive Technavio Analysis on Customer Landscape

The paper edge protectors market forecasting report includes the adoption lifecycle of the market, covering from the innovator’s stage to the laggard’s stage. It focuses on adoption rates in different regions based on penetration. Furthermore, the paper edge protectors market report also includes key purchase criteria and drivers of price sensitivity to help companies evaluate and develop their market growth analysis strategies.
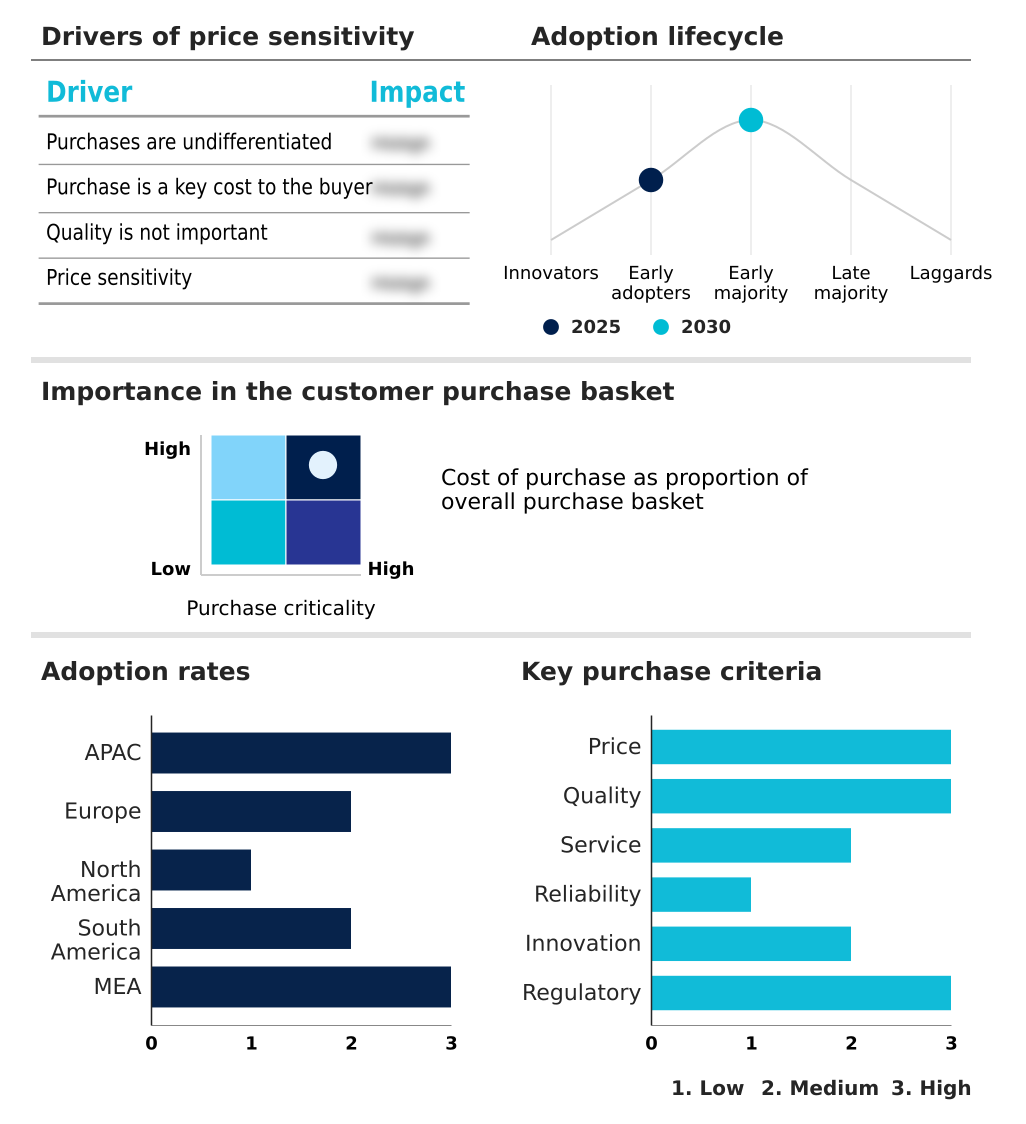
Customer Landscape of Paper Edge Protectors Industry

Competitive Landscape

Companies are implementing various strategies, such as strategic alliances, paper edge protectors market forecast, partnerships, mergers and acquisitions, geographical expansion, and product/service launches, to enhance their presence in the industry.

Abzac SAS - The product portfolio features robust paperboard angleboards and heavy-duty corner protectors engineered to deliver superior structural load stabilization and prevent transit damage across industrial packaging applications.

The industry research and growth report includes detailed analyses of the competitive landscape of the market and information about key companies, including:

  • Abzac SAS
  • Cascades Inc.
  • CORDSTRAP BV
  • DS Smith Plc
  • Eltete TPM Ltd.
  • Greif Inc.
  • Grigeo AB
  • Kunert Group
  • Mondi Plc
  • Packaging Corp. of America
  • Pratt Industries Inc.
  • Rengo Co. Ltd.
  • Ribble Packaging Ltd.
  • Romiley Board Mill
  • Scandicore AB
  • Signode Industrial Group LLC
  • Smurfit Westrock plc
  • THIMM Group GmbH plus Co. KG
  • Valk Industries Inc.
  • VPK Group

Qualitative and quantitative analysis of companies has been conducted to help clients understand the wider business environment as well as the strengths and weaknesses of key industry players. Data is qualitatively analyzed to categorize companies as pure play, category-focused, industry-focused, and diversified; it is quantitatively analyzed to categorize companies as dominant, leading, strong, tentative, and weak.

Recent Development and News in Paper edge protectors market

  • In the Paper and Plastic Packaging Products and Materials industry, the enforcement of strict packaging waste reduction mandates required a 70% recyclability threshold, directly impacting Paper Edge Protectors demand by accelerating single-use plastic replacement and enhancing kerbside recyclability.
  • The adoption of optical scanner integration and robotic handling compatibility across high-density warehousing hubs reduced automated conveyor jam rates by 24%, increasing the necessity for rigid Paper Edge Protectors to ensure precise pallet edge alignment.
  • Major shifts toward timber packaging substitution for heavy industrial load crating eliminated phytosanitary treatment for 100% of international shipments, pulling demand for extra-thick Paper Edge Protectors to improve multi-tier pallet stacking.
  • Advancements in moisture degradation mitigation technologies improved cold-chain storage resilience by 90% in outdoor yards, expanding the functional application of laminated Paper Edge Protectors to guarantee all-weather cargo protection.

Dive into Technavio’s robust research methodology, blending expert interviews, extensive data synthesis, and validated models for unparalleled Paper Edge Protectors Market insights. See full methodology.

Market Scope
Page number 292
Base year 2025
Historic period 2020-2024
Forecast period 2026-2030
Growth momentum & CAGR Accelerate at a CAGR of 6.6%
Market growth 2026-2030 USD 923.6 million
Market structure Fragmented
YoY growth 2025-2026(%) 6.1%
Key countries China, India, Japan, South Korea, Indonesia, Australia, Germany, UK, France, Italy, Spain, The Netherlands, US, Canada, Mexico, Brazil, Argentina, Chile, Saudi Arabia, UAE, South Africa, Turkey and Israel
Competitive landscape Leading Companies, Market Positioning of Companies, Competitive Strategies, and Industry Risks

Request Free Sample

Research Analyst Overview

  • The structural evolution of transit packaging infrastructure heavily relies on multi-ply lamination technology to deliver superior corner crush resistance across high-volume shipping networks. Boardroom executives and supply chain directors are increasingly aligning product packaging strategies with strict regulatory mandates, driving a massive transition toward recycled paperboard inputs.
  • By replacing synthetic corner guards with engineered paper alternatives, companies have achieved a 35% reduction in municipal waste disposal fees while maintaining complete operational compliance. This strategic shift necessitates the utilization of heavy-duty paperboard profiles and water-based adhesives to guarantee maximum vertical stacking strength in automated distribution centers.
  • A critical operational trend involves the formulation of water-dispersible polymer coatings, ensuring that vulnerable cargo remains fully shielded from ambient moisture degradation during maritime transport. Consequently, these structural enhancements effectively mitigate strap indentation prevention failures, protecting high-value merchandise from extreme mechanical tension.
  • Integrating these sustainable edge guards into existing robotic palletizing cells provides uninterrupted continuous circumferential protection for specialized industrial freight. Ultimately, adapting these rigid structural angles enables enterprise logistics operators to significantly optimize material recovery streams.

What are the Key Data Covered in this Paper Edge Protectors Market Research and Growth Report?

  • What is the expected growth of the Paper Edge Protectors Market between 2026 and 2030?

    • USD 923.6 million, at a CAGR of 6.6%

  • What segmentation does the market report cover?

    • The report is segmented by Product (Angular, and Round), Distribution Channel (Offline, and Online), Product Type (Between 3-5 mm, Between 5-8 mm, and Above 8 mm) and Geography (APAC, Europe, North America, South America, Middle East and Africa)

  • Which regions are analyzed in the report?

    • APAC, Europe, North America, South America and Middle East and Africa

  • What are the key growth drivers and market challenges?

    • Surging e-commerce freight volumes demanding enhanced load stabilization, Volatile recycled paperboard raw material costs threatening operational margins

  • Who are the major players in the Paper Edge Protectors Market?

    • Abzac SAS, Cascades Inc., CORDSTRAP BV, DS Smith Plc, Eltete TPM Ltd., Greif Inc., Grigeo AB, Kunert Group, Mondi Plc, Packaging Corp. of America, Pratt Industries Inc., Rengo Co. Ltd., Ribble Packaging Ltd., Romiley Board Mill, Scandicore AB, Signode Industrial Group LLC, Smurfit Westrock plc, THIMM Group GmbH plus Co. KG, Valk Industries Inc. and VPK Group

Market Research Insights

  • The structural packaging sector is experiencing rapid technological evolution as enterprises prioritize optimal freight load unitization and transit safety. By integrating advanced corrugated box reinforcement profiles, distribution facilities have reduced overall shipping damage by 28% compared to unreinforced pallet loads.
  • The widespread deployment of automated high-speed wrapping equipment necessitates rigid dimensional stability, allowing logistics hubs to improve stretch wrap reinforcement efficiency by 22%. Furthermore, the active phase-out of expanded polystyrene has accelerated packaging waste reduction efforts, with sustainable paperboard alternatives achieving a 15% increase in multi-tier pallet stacking capacity.
  • This transition ensures durable intermodal transit packaging performance, enabling corporations to meet stringent environmental targets while continuously optimizing supply chain material costs and kerbside recyclability.

We can help! Our analysts can customize this paper edge protectors market research report to meet your requirements.

Get in touch

1. Executive Summary

1.1 Market overview

Executive Summary - Chart on Market Overview
Executive Summary - Data Table on Market Overview
Executive Summary - Chart on Global Market Characteristics
Executive Summary - Chart on Market by Geography
Executive Summary - Chart on Market Segmentation by Product
Executive Summary - Chart on Market Segmentation by Distribution Channel
Executive Summary - Chart on Market Segmentation by Product Type
Executive Summary - Chart on Incremental Growth
Executive Summary - Data Table on Incremental Growth
Executive Summary - Chart on Company Market Positioning

2. Technavio Analysis

2.1 Analysis of price sensitivity, lifecycle, customer purchase basket, adoption rates, and purchase criteria

2.2 Criticality of inputs and Factors of differentiation

Chart on Overview on criticality of inputs and factors of differentiation

2.3 Factors of disruption

Chart on Overview on factors of disruption

2.4 Impact of drivers and challenges

Chart on Impact of drivers and challenges in 2025 and 2030

3. Market Landscape

3.1 Market ecosystem

Chart on Parent Market
Data Table on - Parent Market

3.2 Market characteristics

Chart on Market characteristics analysis

3.3 Value chain analysis

Chart on Value chain analysis

4. Market Sizing

4.1 Market definition

Data Table on Offerings of companies included in the market definition

4.2 Market segment analysis

Market segments

4.3 Market size 2025

4.4 Market outlook: Forecast for 2025-2030

Chart on Global - Market size and forecast 2025-2030 ($ million)
Data Table on Global - Market size and forecast 2025-2030 ($ million)
Chart on Global Market: Year-over-year growth 2025-2030 (%)
Data Table on Global Market: Year-over-year growth 2025-2030 (%)

5. Historic Market Size

5.1 Global Paper Edge Protectors Market 2020 - 2024

Historic Market Size - Data Table on Global Paper Edge Protectors Market 2020 - 2024 ($ million)

5.2 Product segment analysis 2020 - 2024

Historic Market Size - Product Segment 2020 - 2024 ($ million)

5.3 Distribution Channel segment analysis 2020 - 2024

Historic Market Size - Distribution Channel Segment 2020 - 2024 ($ million)

5.4 Product Type segment analysis 2020 - 2024

Historic Market Size - Product Type Segment 2020 - 2024 ($ million)

5.5 Geography segment analysis 2020 - 2024

Historic Market Size - Geography Segment 2020 - 2024 ($ million)

5.6 Country segment analysis 2020 - 2024

Historic Market Size - Country Segment 2020 - 2024 ($ million)

6. Qualitative Analysis

6.1 Impact of AI on global paper edge protectors market

6.2 Impact of geopolitical conflicts on global paper edge protectors market

7. Five Forces Analysis

7.1 Five forces summary

Five forces analysis - Comparison between 2025 and 2030

7.2 Bargaining power of buyers

Bargaining power of buyers - Impact of key factors 2025 and 2030

7.3 Bargaining power of suppliers

Bargaining power of suppliers - Impact of key factors in 2025 and 2030

7.4 Threat of new entrants

Threat of new entrants - Impact of key factors in 2025 and 2030

7.5 Threat of substitutes

Threat of substitutes - Impact of key factors in 2025 and 2030

7.6 Threat of rivalry

Threat of rivalry - Impact of key factors in 2025 and 2030

7.7 Market condition

Chart on Market condition - Five forces 2025 and 2030

8. Market Segmentation by Product

8.1 Market segments

Chart on Product - Market share 2025-2030 (%)
Data Table on Product - Market share 2025-2030 (%)

8.2 Comparison by Product

Chart on Comparison by Product
Data Table on Comparison by Product

8.3 Angular - Market size and forecast 2025-2030

Chart on Angular - Market size and forecast 2025-2030 ($ million)
Data Table on Angular - Market size and forecast 2025-2030 ($ million)
Chart on Angular - Year-over-year growth 2025-2030 (%)
Data Table on Angular - Year-over-year growth 2025-2030 (%)

8.4 Round - Market size and forecast 2025-2030

Chart on Round - Market size and forecast 2025-2030 ($ million)
Data Table on Round - Market size and forecast 2025-2030 ($ million)
Chart on Round - Year-over-year growth 2025-2030 (%)
Data Table on Round - Year-over-year growth 2025-2030 (%)

8.5 Market opportunity by Product

Market opportunity by Product ($ million)
Data Table on Market opportunity by Product ($ million)

9. Market Segmentation by Distribution Channel

9.1 Market segments

Chart on Distribution Channel - Market share 2025-2030 (%)
Data Table on Distribution Channel - Market share 2025-2030 (%)

9.2 Comparison by Distribution Channel

Chart on Comparison by Distribution Channel
Data Table on Comparison by Distribution Channel

9.3 Offline - Market size and forecast 2025-2030

Chart on Offline - Market size and forecast 2025-2030 ($ million)
Data Table on Offline - Market size and forecast 2025-2030 ($ million)
Chart on Offline - Year-over-year growth 2025-2030 (%)
Data Table on Offline - Year-over-year growth 2025-2030 (%)

9.4 Online - Market size and forecast 2025-2030

Chart on Online - Market size and forecast 2025-2030 ($ million)
Data Table on Online - Market size and forecast 2025-2030 ($ million)
Chart on Online - Year-over-year growth 2025-2030 (%)
Data Table on Online - Year-over-year growth 2025-2030 (%)

9.5 Market opportunity by Distribution Channel

Market opportunity by Distribution Channel ($ million)
Data Table on Market opportunity by Distribution Channel ($ million)

10. Market Segmentation by Product Type

10.1 Market segments

Chart on Product Type - Market share 2025-2030 (%)
Data Table on Product Type - Market share 2025-2030 (%)

10.2 Comparison by Product Type

Chart on Comparison by Product Type
Data Table on Comparison by Product Type

10.3 Between 3-5 mm - Market size and forecast 2025-2030

Chart on Between 3-5 mm - Market size and forecast 2025-2030 ($ million)
Data Table on Between 3-5 mm - Market size and forecast 2025-2030 ($ million)
Chart on Between 3-5 mm - Year-over-year growth 2025-2030 (%)
Data Table on Between 3-5 mm - Year-over-year growth 2025-2030 (%)

10.4 Between 5-8 mm - Market size and forecast 2025-2030

Chart on Between 5-8 mm - Market size and forecast 2025-2030 ($ million)
Data Table on Between 5-8 mm - Market size and forecast 2025-2030 ($ million)
Chart on Between 5-8 mm - Year-over-year growth 2025-2030 (%)
Data Table on Between 5-8 mm - Year-over-year growth 2025-2030 (%)

10.5 Above 8 mm - Market size and forecast 2025-2030

Chart on Above 8 mm - Market size and forecast 2025-2030 ($ million)
Data Table on Above 8 mm - Market size and forecast 2025-2030 ($ million)
Chart on Above 8 mm - Year-over-year growth 2025-2030 (%)
Data Table on Above 8 mm - Year-over-year growth 2025-2030 (%)

10.6 Market opportunity by Product Type

Market opportunity by Product Type ($ million)
Data Table on Market opportunity by Product Type ($ million)

11. Customer Landscape

11.1 Customer landscape overview

Analysis of price sensitivity, lifecycle, customer purchase basket, adoption rates, and purchase criteria

12. Geographic Landscape

12.1 Geographic segmentation

Chart on Market share by geography 2025-2030 (%)
Data Table on Market share by geography 2025-2030 (%)

12.2 Geographic comparison

Chart on Geographic comparison
Data Table on Geographic comparison

12.3 APAC - Market size and forecast 2025-2030

Chart on APAC - Market size and forecast 2025-2030 ($ million)
Data Table on APAC - Market size and forecast 2025-2030 ($ million)
Chart on APAC - Year-over-year growth 2025-2030 (%)
Data Table on APAC - Year-over-year growth 2025-2030 (%)
Chart on Regional Comparison - APAC
Data Table on Regional Comparison - APAC

12.3.1 China - Market size and forecast 2025-2030

Chart on China - Market size and forecast 2025-2030 ($ million)
Data Table on China - Market size and forecast 2025-2030 ($ million)
Chart on China - Year-over-year growth 2025-2030 (%)
Data Table on China - Year-over-year growth 2025-2030 (%)

12.3.2 India - Market size and forecast 2025-2030

Chart on India - Market size and forecast 2025-2030 ($ million)
Data Table on India - Market size and forecast 2025-2030 ($ million)
Chart on India - Year-over-year growth 2025-2030 (%)
Data Table on India - Year-over-year growth 2025-2030 (%)

12.3.3 Japan - Market size and forecast 2025-2030

Chart on Japan - Market size and forecast 2025-2030 ($ million)
Data Table on Japan - Market size and forecast 2025-2030 ($ million)
Chart on Japan - Year-over-year growth 2025-2030 (%)
Data Table on Japan - Year-over-year growth 2025-2030 (%)

12.3.4 South Korea - Market size and forecast 2025-2030

Chart on South Korea - Market size and forecast 2025-2030 ($ million)
Data Table on South Korea - Market size and forecast 2025-2030 ($ million)
Chart on South Korea - Year-over-year growth 2025-2030 (%)
Data Table on South Korea - Year-over-year growth 2025-2030 (%)

12.3.5 Indonesia - Market size and forecast 2025-2030

Chart on Indonesia - Market size and forecast 2025-2030 ($ million)
Data Table on Indonesia - Market size and forecast 2025-2030 ($ million)
Chart on Indonesia - Year-over-year growth 2025-2030 (%)
Data Table on Indonesia - Year-over-year growth 2025-2030 (%)

12.3.6 Australia - Market size and forecast 2025-2030

Chart on Australia - Market size and forecast 2025-2030 ($ million)
Data Table on Australia - Market size and forecast 2025-2030 ($ million)
Chart on Australia - Year-over-year growth 2025-2030 (%)
Data Table on Australia - Year-over-year growth 2025-2030 (%)

12.4 Europe - Market size and forecast 2025-2030

Chart on Europe - Market size and forecast 2025-2030 ($ million)
Data Table on Europe - Market size and forecast 2025-2030 ($ million)
Chart on Europe - Year-over-year growth 2025-2030 (%)
Data Table on Europe - Year-over-year growth 2025-2030 (%)
Chart on Regional Comparison - Europe
Data Table on Regional Comparison - Europe

12.4.1 Germany - Market size and forecast 2025-2030

Chart on Germany - Market size and forecast 2025-2030 ($ million)
Data Table on Germany - Market size and forecast 2025-2030 ($ million)
Chart on Germany - Year-over-year growth 2025-2030 (%)
Data Table on Germany - Year-over-year growth 2025-2030 (%)

12.4.2 UK - Market size and forecast 2025-2030

Chart on UK - Market size and forecast 2025-2030 ($ million)
Data Table on UK - Market size and forecast 2025-2030 ($ million)
Chart on UK - Year-over-year growth 2025-2030 (%)
Data Table on UK - Year-over-year growth 2025-2030 (%)

12.4.3 France - Market size and forecast 2025-2030

Chart on France - Market size and forecast 2025-2030 ($ million)
Data Table on France - Market size and forecast 2025-2030 ($ million)
Chart on France - Year-over-year growth 2025-2030 (%)
Data Table on France - Year-over-year growth 2025-2030 (%)

12.4.4 Italy - Market size and forecast 2025-2030

Chart on Italy - Market size and forecast 2025-2030 ($ million)
Data Table on Italy - Market size and forecast 2025-2030 ($ million)
Chart on Italy - Year-over-year growth 2025-2030 (%)
Data Table on Italy - Year-over-year growth 2025-2030 (%)

12.4.5 Spain - Market size and forecast 2025-2030

Chart on Spain - Market size and forecast 2025-2030 ($ million)
Data Table on Spain - Market size and forecast 2025-2030 ($ million)
Chart on Spain - Year-over-year growth 2025-2030 (%)
Data Table on Spain - Year-over-year growth 2025-2030 (%)

12.4.6 The Netherlands - Market size and forecast 2025-2030

Chart on The Netherlands - Market size and forecast 2025-2030 ($ million)
Data Table on The Netherlands - Market size and forecast 2025-2030 ($ million)
Chart on The Netherlands - Year-over-year growth 2025-2030 (%)
Data Table on The Netherlands - Year-over-year growth 2025-2030 (%)

12.5 North America - Market size and forecast 2025-2030

Chart on North America - Market size and forecast 2025-2030 ($ million)
Data Table on North America - Market size and forecast 2025-2030 ($ million)
Chart on North America - Year-over-year growth 2025-2030 (%)
Data Table on North America - Year-over-year growth 2025-2030 (%)
Chart on Regional Comparison - North America
Data Table on Regional Comparison - North America

12.5.1 US - Market size and forecast 2025-2030

Chart on US - Market size and forecast 2025-2030 ($ million)
Data Table on US - Market size and forecast 2025-2030 ($ million)
Chart on US - Year-over-year growth 2025-2030 (%)
Data Table on US - Year-over-year growth 2025-2030 (%)

12.5.2 Canada - Market size and forecast 2025-2030

Chart on Canada - Market size and forecast 2025-2030 ($ million)
Data Table on Canada - Market size and forecast 2025-2030 ($ million)
Chart on Canada - Year-over-year growth 2025-2030 (%)
Data Table on Canada - Year-over-year growth 2025-2030 (%)

12.5.3 Mexico - Market size and forecast 2025-2030

Chart on Mexico - Market size and forecast 2025-2030 ($ million)
Data Table on Mexico - Market size and forecast 2025-2030 ($ million)
Chart on Mexico - Year-over-year growth 2025-2030 (%)
Data Table on Mexico - Year-over-year growth 2025-2030 (%)

12.6 South America - Market size and forecast 2025-2030

Chart on South America - Market size and forecast 2025-2030 ($ million)
Data Table on South America - Market size and forecast 2025-2030 ($ million)
Chart on South America - Year-over-year growth 2025-2030 (%)
Data Table on South America - Year-over-year growth 2025-2030 (%)
Chart on Regional Comparison - South America
Data Table on Regional Comparison - South America

12.6.1 Brazil - Market size and forecast 2025-2030

Chart on Brazil - Market size and forecast 2025-2030 ($ million)
Data Table on Brazil - Market size and forecast 2025-2030 ($ million)
Chart on Brazil - Year-over-year growth 2025-2030 (%)
Data Table on Brazil - Year-over-year growth 2025-2030 (%)

12.6.2 Argentina - Market size and forecast 2025-2030

Chart on Argentina - Market size and forecast 2025-2030 ($ million)
Data Table on Argentina - Market size and forecast 2025-2030 ($ million)
Chart on Argentina - Year-over-year growth 2025-2030 (%)
Data Table on Argentina - Year-over-year growth 2025-2030 (%)

12.6.3 Chile - Market size and forecast 2025-2030

Chart on Chile - Market size and forecast 2025-2030 ($ million)
Data Table on Chile - Market size and forecast 2025-2030 ($ million)
Chart on Chile - Year-over-year growth 2025-2030 (%)
Data Table on Chile - Year-over-year growth 2025-2030 (%)

12.7 Middle East and Africa - Market size and forecast 2025-2030

Chart on Middle East and Africa - Market size and forecast 2025-2030 ($ million)
Data Table on Middle East and Africa - Market size and forecast 2025-2030 ($ million)
Chart on Middle East and Africa - Year-over-year growth 2025-2030 (%)
Data Table on Middle East and Africa - Year-over-year growth 2025-2030 (%)
Chart on Regional Comparison - Middle East and Africa
Data Table on Regional Comparison - Middle East and Africa

12.7.1 Saudi Arabia - Market size and forecast 2025-2030

Chart on Saudi Arabia - Market size and forecast 2025-2030 ($ million)
Data Table on Saudi Arabia - Market size and forecast 2025-2030 ($ million)
Chart on Saudi Arabia - Year-over-year growth 2025-2030 (%)
Data Table on Saudi Arabia - Year-over-year growth 2025-2030 (%)

12.7.2 UAE - Market size and forecast 2025-2030

Chart on UAE - Market size and forecast 2025-2030 ($ million)
Data Table on UAE - Market size and forecast 2025-2030 ($ million)
Chart on UAE - Year-over-year growth 2025-2030 (%)
Data Table on UAE - Year-over-year growth 2025-2030 (%)

12.7.3 South Africa - Market size and forecast 2025-2030

Chart on South Africa - Market size and forecast 2025-2030 ($ million)
Data Table on South Africa - Market size and forecast 2025-2030 ($ million)
Chart on South Africa - Year-over-year growth 2025-2030 (%)
Data Table on South Africa - Year-over-year growth 2025-2030 (%)

12.7.4 Turkey - Market size and forecast 2025-2030

Chart on Turkey - Market size and forecast 2025-2030 ($ million)
Data Table on Turkey - Market size and forecast 2025-2030 ($ million)
Chart on Turkey - Year-over-year growth 2025-2030 (%)
Data Table on Turkey - Year-over-year growth 2025-2030 (%)

12.7.5 Israel - Market size and forecast 2025-2030

Chart on Israel - Market size and forecast 2025-2030 ($ million)
Data Table on Israel - Market size and forecast 2025-2030 ($ million)
Chart on Israel - Year-over-year growth 2025-2030 (%)
Data Table on Israel - Year-over-year growth 2025-2030 (%)

12.8 Market opportunity by geography

Market opportunity by geography ($ million)
Data Tables on Market opportunity by geography ($ million)

13. Drivers, Challenges, and Opportunity

13.1 Market drivers

Surging e-commerce freight volumes demanding enhanced load stabilization
Stringent global sustainability directives accelerating plastic edge replacement
Automated high speed warehousing adoption requiring uniform pallet structure

13.2 Market challenges

Volatile recycled paperboard raw material costs threatening operational margins
Moisture sensitivity degrading structural performance high humidity transit conditions
Surging competition plastic strap alternatives limiting paperboard market penetration

13.3 Impact of drivers and challenges

Impact of drivers and challenges in 2025 and 2030

13.4 Market opportunities

Integration advanced water resistant coatings expanding all weather application
Development custom heavy duty L shape profiles replacing wood frame packaging
Adoption automated corner board application systems accelerating end line integration

14. Competitive Landscape

14.1 Overview

14.2

Overview on criticality of inputs and factors of differentiation

14.3 Landscape disruption

Overview on factors of disruption

14.4 Industry risks

Impact of key risks on business

15. Competitive Analysis

15.1 Companies profiled

Companies covered

15.2 Company ranking index

15.3 Market positioning of companies

Matrix on companies position and classification

15.4 Abzac SAS

Abzac SAS - Overview
Abzac SAS - Product / Service
Abzac SAS - Key offerings
SWOT

15.5 Cascades Inc.

Cascades Inc. - Overview
Cascades Inc. - Business segments
Cascades Inc. - Key offerings
Cascades Inc. - Segment focus
SWOT

15.6 CORDSTRAP BV

CORDSTRAP BV - Overview
CORDSTRAP BV - Product / Service
CORDSTRAP BV - Key offerings
SWOT

15.7 DS Smith Plc

DS Smith Plc - Overview
DS Smith Plc - Product / Service
DS Smith Plc - Key news
DS Smith Plc - Key offerings
SWOT

15.8 Eltete TPM Ltd.

Eltete TPM Ltd. - Overview
Eltete TPM Ltd. - Product / Service
Eltete TPM Ltd. - Key offerings
SWOT

15.9 Greif Inc.

Greif Inc. - Overview
Greif Inc. - Business segments
Greif Inc. - Key offerings
Greif Inc. - Segment focus
SWOT

15.10 Grigeo AB

Grigeo AB - Overview
Grigeo AB - Product / Service
Grigeo AB - Key offerings
SWOT

15.11 Kunert Group

Kunert Group - Overview
Kunert Group - Product / Service
Kunert Group - Key offerings
SWOT

15.12 Mondi Plc

Mondi Plc - Overview
Mondi Plc - Business segments
Mondi Plc - Key news
Mondi Plc - Key offerings
Mondi Plc - Segment focus
SWOT

15.13 Packaging Corp. of America

Packaging Corp. of America - Overview
Packaging Corp. of America - Business segments
Packaging Corp. of America - Key offerings
Packaging Corp. of America - Segment focus
SWOT

15.14 Pratt Industries Inc.

Pratt Industries Inc. - Overview
Pratt Industries Inc. - Product / Service
Pratt Industries Inc. - Key offerings
SWOT

15.15 Rengo Co. Ltd.

Rengo Co. Ltd. - Overview
Rengo Co. Ltd. - Business segments
Rengo Co. Ltd. - Key offerings
Rengo Co. Ltd. - Segment focus
SWOT

15.16 THIMM Group GmbH plus Co. KG

THIMM Group GmbH plus Co. KG - Overview
THIMM Group GmbH plus Co. KG - Product / Service
THIMM Group GmbH plus Co. KG - Key offerings
SWOT

15.17 Valk Industries Inc.

Valk Industries Inc. - Overview
Valk Industries Inc. - Product / Service
Valk Industries Inc. - Key offerings
SWOT

15.18 VPK Group

VPK Group - Overview
VPK Group - Product / Service
VPK Group - Key offerings
SWOT

16. Appendix

16.1 Scope of the report

Market definition
Objectives
Notes and caveats

16.2 Inclusions and exclusions checklist

Inclusions checklist
Exclusions checklist

16.3 Currency conversion rates for US$

16.4 Research methodology

16.5 Data procurement

Information sources

16.6 Data validation

16.7 Validation techniques employed for market sizing

16.8 Data synthesis

16.9 360 degree market analysis

16.10 List of abbreviations

Research Methodology

Technavio presents a detailed picture of the market by way of study, synthesis, and summation of data from multiple sources. The analysts have presented the various facets of the market with a particular focus on identifying the key industry influencers. The data thus presented is comprehensive, reliable, and the result of extensive research, both primary and secondary.

INFORMATION SOURCES

Primary sources

  • Manufacturers and suppliers
  • Channel partners
  • Industry experts
  • Strategic decision makers

Secondary sources

  • Industry journals and periodicals
  • Government data
  • Financial reports of key industry players
  • Historical data
  • Press releases

DATA ANALYSIS

Data Synthesis

  • Collation of data
  • Estimation of key figures
  • Analysis of derived insights

Data Validation

  • Triangulation with data models
  • Reference against proprietary databases
  • Corroboration with industry experts

REPORT WRITING

Qualitative

  • Market drivers
  • Market challenges
  • Market trends
  • Five forces analysis

Quantitative

  • Market size and forecast
  • Market segmentation
  • Geographical insights
  • Competitive landscape

Interested in this report?

Get your sample now to see our research methodology and insights!

Download Now

Frequently Asked Questions

Paper Edge Protectors market growth will increase by USD 923.6 million during 2026-2030.

The Paper Edge Protectors market is expected to grow at a CAGR of 6.6% during 2026-2030.

Paper Edge Protectors market is segmented by Product (Angular, Round) Distribution channel (Offline, Online) Product type (Between 3-5 mm, Between 5-8 mm, Above 8 mm)

Abzac SAS, Cascades Inc., CORDSTRAP BV, DS Smith Plc, Eltete TPM Ltd., Greif Inc., Grigeo AB, Kunert Group, Mondi Plc, Packaging Corp. of America, Pratt Industries Inc., Rengo Co. Ltd., Ribble Packaging Ltd., Romiley Board Mill, Scandicore AB, Signode Industrial Group LLC, Smurfit Westrock plc, THIMM Group GmbH plus Co. KG, Valk Industries Inc., VPK Group are a few of the key vendors in the Paper Edge Protectors market.

APAC will register the highest growth rate of 50.5% among the other regions. Therefore, the Paper Edge Protectors market in APAC is expected to garner significant business opportunities for the vendors during the forecast period.

China, India, Japan, South Korea, Indonesia, Australia, Germany, UK, France, Italy, Spain, The Netherlands, US, Canada, Mexico, Brazil, Argentina, Chile, Saudi Arabia, UAE, South Africa, Turkey, Israel

  • Surging e-commerce freight volumes demanding enhanced load stabilization is the driving factor this market.

The Paper Edge Protectors market vendors should focus on grabbing business opportunities from the Product segment as it accounted for the largest market share in the base year.
RIA - Research AI Assistant
Ask RIA
