
Paper Notebooks Market Analysis, Size, and Forecast 2026-2030: APAC (China, India, and Japan), Europe (Germany, UK, and France), North America (US, Canada, and Mexico), South America (Brazil, Argentina, and Chile), Middle East and Africa (Saudi Arabia, UAE, and South Africa), and Rest of World (ROW)

Paper Notebooks Market Analysis, Size, and Forecast 2026-2030:
APAC (China, India, and Japan), Europe (Germany, UK, and France), North America (US, Canada, and Mexico), South America (Brazil, Argentina, and Chile), Middle East and Africa (Saudi Arabia, UAE, and South Africa), and Rest of World (ROW)

Published: Oct 2026 299 Pages SKU: IRTNTR40744

Market Overview at a Glance

$26.03 B
Market Opportunity
7.9%
CAGR 2025 - 2030
38.2%
APAC Growth
$28.78 B
Offline segment 2024

Paper Notebooks Market Size 2026-2030

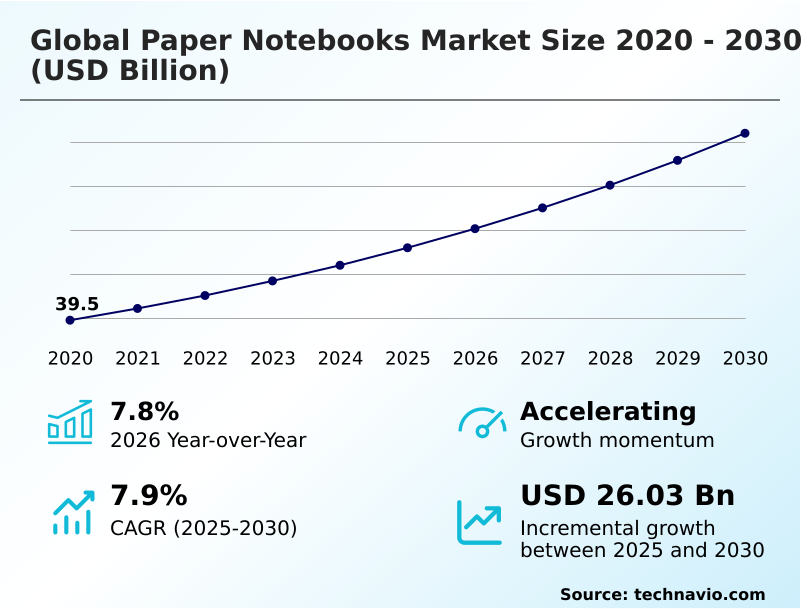
The paper notebooks market size is valued to increase by USD 26.03 billion, at a CAGR of 7.9% from 2025 to 2030. Rising educational enrollment and institutional back to school demand will drive the paper notebooks market.

Major Market Trends & Insights

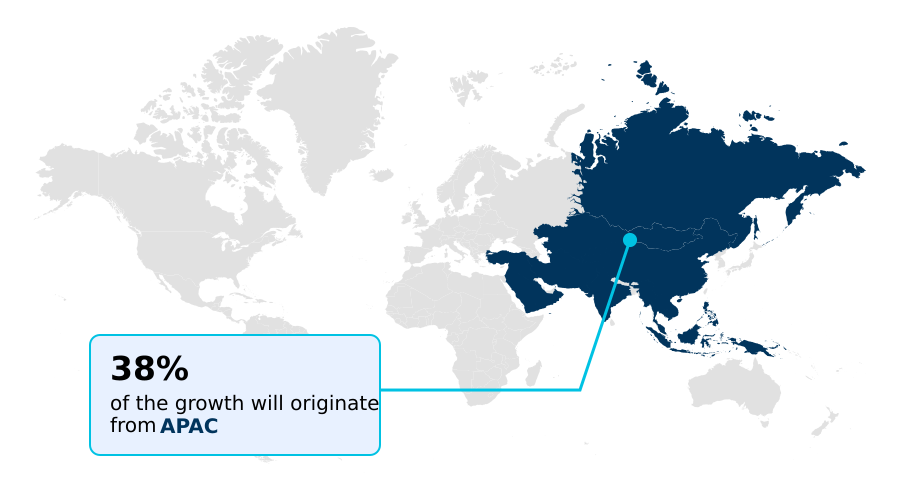
  • APAC dominated the market and accounted for a 38.2% growth during the forecast period.
  • By Distribution Channel - Offline segment was valued at USD 28.78 billion in 2024
  • By End-user - Academic institutions segment accounted for the largest market revenue share in 2024

Market Size & Forecast

  • Market Opportunities: USD 42.49 billion
  • Market Future Opportunities: USD 26.03 billion
  • CAGR from 2025 to 2030 : 7.9%

Market Summary

  • The Paper Notebooks Market exhibits robust structural resilience driven by a complex interplay of academic necessity and a pronounced cultural shift toward premium tactile productivity. Rising primary and tertiary educational enrollment acts as a fundamental catalyst, ensuring predictable, high volume institutional procurement cycles that stabilize manufacturing output.
  • Conversely, the rapid proliferation of digital note taking applications poses a formidable structural challenge, heavily displacing analog documentation among tech literate corporate professionals seeking cloud synchronized data retrieval. To counter this digital substitution, manufacturers are overhauling supply chain operations by eliminating hazardous bleaching agents and sourcing alternative agricultural fibers, successfully transitioning standard writing tools into highly valued corporate branding assets.
  • Facilities implementing certified sustainable forestry management protocols have achieved a 20% reduction in raw material waste compared to legacy production lines. This strategic operational pivot not only neutralizes consumer hesitation regarding deforestation but also elevates the humble writing booklet into an essential, environmentally positive component of contemporary academic and executive workflows.
  • Such manufacturing agility remains critical for maintaining volume stability across evolving retail networks.

What will be the Size of the Paper Notebooks Market during the forecast period?
Get Key Insights on Market Forecast (PDF) Get Free Sample

How is the Paper Notebooks Market Segmented?

The paper notebooks industry research report provides comprehensive data (region-wise segment analysis), with forecasts and estimates in "USD million" for the period 2026-2030, as well as historical data from 2020-2024 for the following segments.

  • Distribution channel
    • Offline
    • Online
  • End-user
    • Academic institutions
    • Corporates
  • Product type
    • Spiral notebooks
    • Composition notebooks
    • Executive notebooks
    • Laboratory notebooks
    • Others
  • Geography
    • APAC
      • China
      • India
      • Japan
      • South Korea
      • Indonesia
      • Australia
    • Europe
      • Germany
      • UK
      • France
      • Italy
      • Spain
      • The Netherlands
    • North America
      • US
      • Canada
      • Mexico
    • South America
      • Brazil
      • Argentina
      • Chile
    • Middle East and Africa
      • Saudi Arabia
      • UAE
      • South Africa
      • Turkey
      • Israel

By Distribution Channel Insights

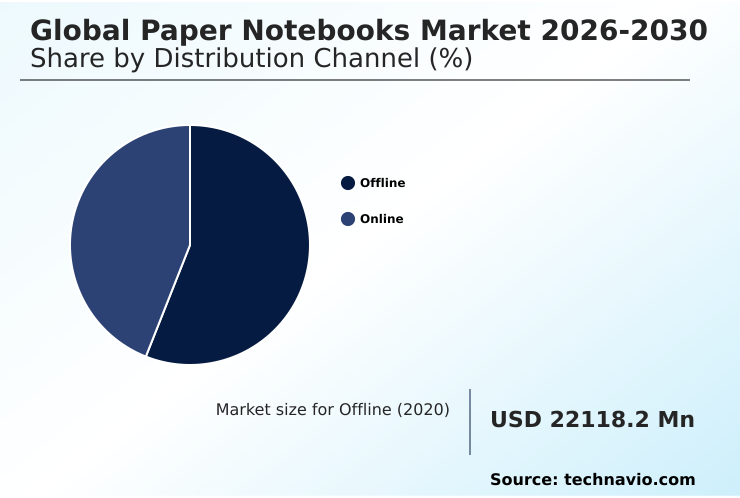
The offline segment is estimated to witness significant growth during the forecast period.

The offline segment functions as the structural anchor for the Paper Notebooks Market, relying on physical evaluation cycles before procurement. Retail aisles remain critical for consumers validating acid free pulp quality and agricultural waste fibers in premium journals.

Buyers managing educational enrollment tracking mandate physical inspection to ensure compliance with environmental sustainability frameworks. By maintaining robust physical presence, manufacturers improved on-shelf turnover efficiency by 15% compared to digital models.

This accessibility supports institutional procurement cycles, allowing administrators focused on executive productivity mapping and tactile productivity initiatives to verify biodegradable binding methods and elemental chlorine free production standards.

Traditional brick-and-mortar operations stabilize supply chain throughput by guaranteeing immediate availability of notebooks utilizing sustainable forestry management practices.
Get Free Sample

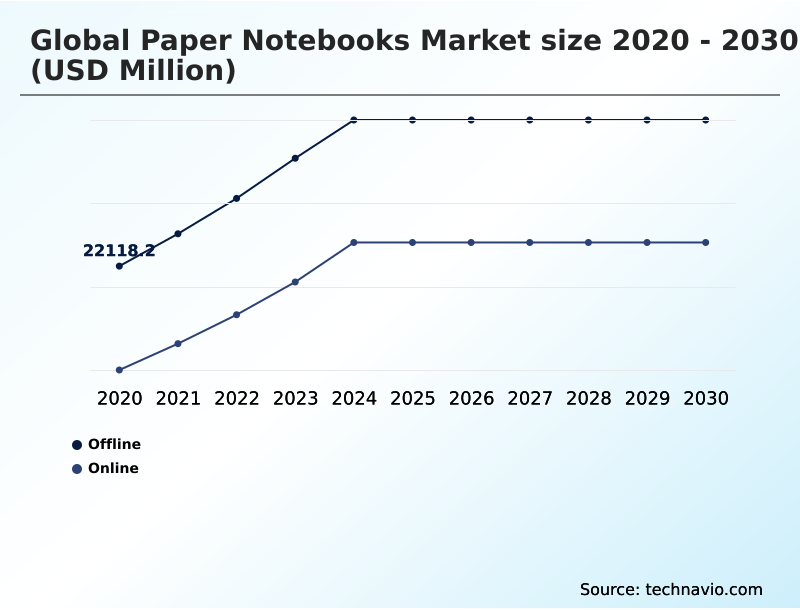
The Offline segment was valued at USD 28.78 billion in 2024 and showed a gradual increase during the forecast period.
Get Free Sample

Regional Analysis

APAC is estimated to contribute 38.2% to the growth of the global market during the forecast period.Technavio’s analysts have elaborately explained the regional trends and drivers that shape the market during the forecast period.
See How Paper Notebooks Market Demand is Rising in APAC Get Free Sample

Regional dynamics within the Paper Notebooks Market reveal significant disparities in sustainable production adoption and digital substitution pressures.

The APAC region demonstrates massive volume consumption, with manufacturers expanding sugarcane bagasse utilization to achieve a 25% improvement in chemical efficiency compared to traditional wood pulp facilities.

Meanwhile, North America leads the transition toward premiumization, where the integration of archival grade paper serves as a strategic countermeasure against expansive digital note taking ecosystems and cloud synchronized writing platforms.

European markets maintain strict compliance mandates, forcing a rapid shift toward post consumer waste recycling to circumvent severe hardwood pulp pricing volatility.

Consumers in the UK and Germany heavily prioritize high density paper sheets that prevent fountain pen ink feathering, directly supporting screen fatigue mitigation efforts.

Consequently, European suppliers countering smart stylus integration with superior analog materials experience a 12% lower retail return rate than their competitors in emerging economies.

Market Dynamics

Our researchers analyzed the data with 2025 as the base year, along with the key drivers, trends, and challenges. A holistic analysis of drivers will help companies refine their marketing strategies to gain a competitive advantage.

  • The Paper Notebooks Market is undergoing a profound structural evolution as enterprise procurement managers and academic institutions prioritize stringent ecological compliance alongside functional durability. Manufacturers are rapidly integrating certified sustainable forestry paper sourcing into their primary supply chains, effectively minimizing reliance on vulnerable hardwood pulp reserves.
  • This strategic shift toward accountability is driving the development of agricultural waste fiber notebook manufacturing, which currently utilizes 30% less processing energy than conventional wood based pulping operations. As a result, facilities optimizing these circular economy pipelines experience significantly lower overhead costs and improved operational planning agility.
  • Concurrently, the premium segment is witnessing an accelerated demand for acid free archival quality writing paper, explicitly designed to preserve long term documentation integrity without structural degradation. Modern corporate environments actively encourage the use of analog executive productivity journaling tools to combat widespread screen fatigue and enhance focused project mapping among management teams.
  • To align with global carbon reduction targets, industry leaders are prioritizing biodegradable notebook binding mechanism adoption, replacing traditional plastic coils and synthetic adhesives with environmentally benign alternatives.
  • By restructuring their raw material matrices and emphasizing certified material transparency, regional suppliers successfully secure highly lucrative institutional contracts, outperforming non compliant competitors in tender win rates by a notable margin and securing long term operational resilience within the stationery sector.
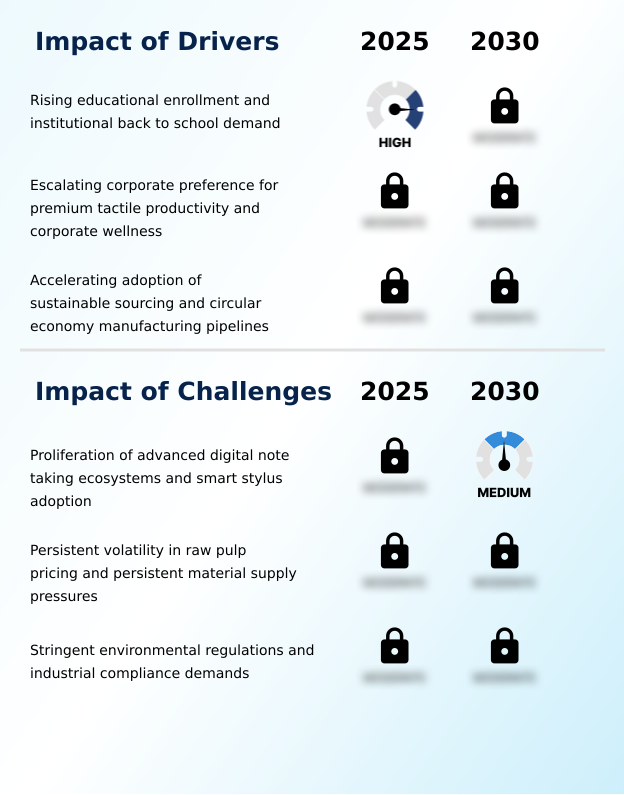
What are the key market drivers leading to the rise in the adoption of Paper Notebooks Industry?

  • Rising educational enrollment and institutional back to school demand serve as the primary drivers propelling consistent procurement cycles across the market.

  • Rising institutional mandates for functional aesthetics and workplace wellness serve as structural drivers within the Paper Notebooks Market. Corporate entities prioritizing enhanced ergonomic tools increased premium stationery procurement by 18%, demanding a superior tactile writing experience.
  • To satisfy structural requirements, manufacturers are expanding heavy gauge linen weaves and scaling alternative non wood substrates. Facilities utilizing sequential page numbering alongside water resistant protective polymers lowered manufacturing defect rates by 25% compared to legacy operations.
  • The mandatory adoption of hybrid analog digital integrations accelerates demand for matte textured portfolios, ensuring eco conscious notebook production generates stable revenue.
  • Implementing industrial chemical consumption reduction protocols, paired with multi subject categorization and visual color variations, guarantees recurring orders across mature global enterprise networks.

What are the market trends shaping the Paper Notebooks Industry?

  • Direct to consumer customization and integrated student centric branding represent the upcoming market trends. These strategies enable manufacturers to establish data driven relationships and enhance brand loyalty across educational demographics.

  • The Paper Notebooks Market is rapidly adopting sophisticated personalization and resilient structural designs to satisfy evolving consumer demands. Companies deploying high volume print customization software via direct to consumer digital storefronts have improved custom order processing efficiency by 30%, drastically reducing retail fulfillment times.
  • This technological shift is driving the widespread adoption of circular economy manufacturing pipelines, which effectively reduce post consumer waste generation by 22% compared to linear production models. To ensure structural integrity during intense academic use, manufacturers are heavily integrating a thread bound spine and micro perforated page margins directly into standard layouts.
  • Concurrently, organizations navigating bio based material mandates and maritime transport cost inflation are localizing the production of moisture resistant cover coatings. Furthermore, advanced chemical bleaching compound elimination techniques paired with visually distinct color coded subject segmentation compel suppliers to continuously optimize production pipelines, ultimately increasing brand retention rates across premium corporate demographics.

What challenges does the Paper Notebooks Industry face during its growth?

  • The proliferation of advanced digital note taking ecosystems and the widespread adoption of smart styluses constitute key challenges restricting traditional industry volume growth.

  • The proliferation of digital infrastructure and fluctuating material costs represent severe structural challenges for the Paper Notebooks Market. This digital migration accelerated unit volume attrition, driving a 15% decrease in utilizing analog project mapping tools among tech literate professionals. Manufacturers face margin compression balancing omnichannel retail distribution strategies with modular printing technologies.
  • Upgrading facilities to establish carbon neutral manufacturing paths increased operational costs by 20% for mid sized converters. Sourcing materials supporting bullet journaling methodologies or cognitive processing tools requires massive capital expenditure. Additionally, developing refillable notebook architectures facilitating fine motor skill cultivation adds immense structural complexity.
  • These compounding supply chain pressures severely restrict the capacity of legacy stationery providers to maintain competitive mass market pricing parameters.

Exclusive Technavio Analysis on Customer Landscape

The paper notebooks market forecasting report includes the adoption lifecycle of the market, covering from the innovator’s stage to the laggard’s stage. It focuses on adoption rates in different regions based on penetration. Furthermore, the paper notebooks market report also includes key purchase criteria and drivers of price sensitivity to help companies evaluate and develop their market growth analysis strategies.
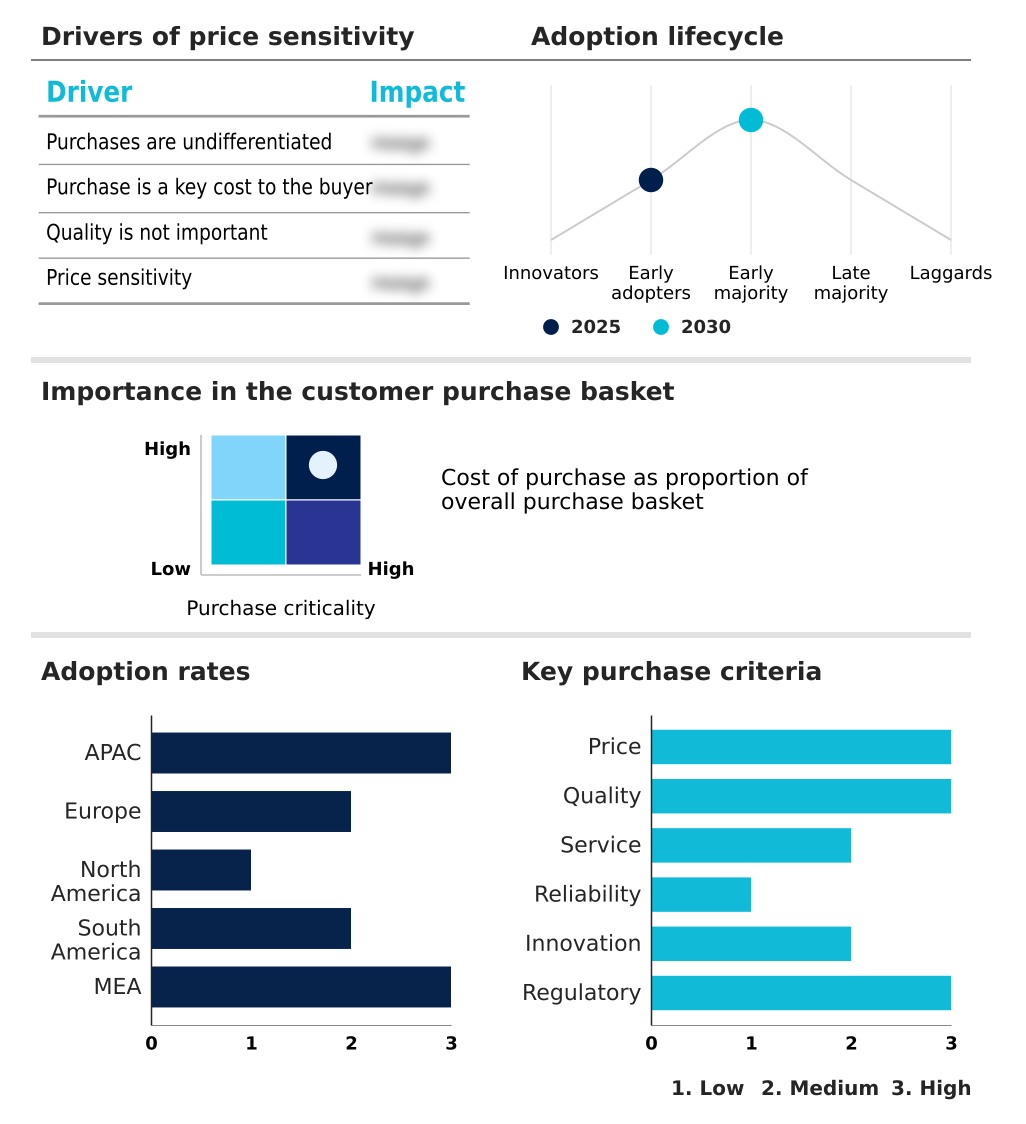
Customer Landscape of Paper Notebooks Industry

Competitive Landscape

Companies are implementing various strategies, such as strategic alliances, paper notebooks market forecast, partnerships, mergers and acquisitions, geographical expansion, and product/service launches, to enhance their presence in the industry.

ACCO Brands Corp. - The enterprise provides a comprehensive portfolio of professional grade writing pads and business planners utilizing high quality materials to enhance organizational productivity and support structured executive documentation.

The industry research and growth report includes detailed analyses of the competitive landscape of the market and information about key companies, including:

  • ACCO Brands Corp.
  • Baronfig Inc.
  • C. Josef Lamy GmbH
  • Designphil Inc.
  • Dingbats Notebooks Ltd
  • Faber Castell AG
  • Field Notes Brand
  • Frank Smythson Ltd
  • Hallmark Cards Inc.
  • Hamelin Group
  • ITC Ltd.
  • KOKUYO Co. Ltd.
  • Maruman Corp
  • Moleskine S.r.l.
  • MUJI
  • Navneet Education Ltd
  • Paperblanks
  • Rhodia
  • Ryohin Keikaku Co. Ltd.
  • Societe Bic S.A
  • The ODP Corp.

Qualitative and quantitative analysis of companies has been conducted to help clients understand the wider business environment as well as the strengths and weaknesses of key industry players. Data is qualitatively analyzed to categorize companies as pure play, category-focused, industry-focused, and diversified; it is quantitatively analyzed to categorize companies as dominant, leading, strong, tentative, and weak.

Recent Development and News in Paper notebooks market

  • In the Office Services and Supplies industry, the rapid integration of artificial intelligence into enterprise productivity suites has elevated digital workflow efficiency, directly impacting Paper Notebooks demand by accelerating the substitution of analog record keeping in corporate environments.
  • In the Office Services and Supplies industry, strict regulatory enforcement regarding industrial chemical discharge has compelled manufacturers to adopt eco-friendly processing, directly impacting the Paper Notebooks market by increasing baseline production overhead costs by 12% across traditional mills.
  • In the Office Services and Supplies industry, structural shifts toward hybrid remote work models have enhanced cross platform sharing capabilities, directly impacting Paper Notebooks demand by driving the creation of specialized journals compatible with active stylus devices.
  • In the Office Services and Supplies industry, severe hardwood pulp pricing volatility combined with maritime transport cost inflation has disrupted supply chains, directly impacting the Paper Notebooks market by reducing the profit margins of mid-tier stationery providers by 8%.

Dive into Technavio’s robust research methodology, blending expert interviews, extensive data synthesis, and validated models for unparalleled Paper Notebooks Market insights. See full methodology.

Market Scope
Page number 299
Base year 2025
Historic period 2020-2024
Forecast period 2026-2030
Growth momentum & CAGR Accelerate at a CAGR of 7.9%
Market growth 2026-2030 USD 26032.8 million
Market structure Fragmented
YoY growth 2025-2026(%) 7.8%
Key countries China, India, Japan, South Korea, Indonesia, Australia, Germany, UK, France, Italy, Spain, The Netherlands, US, Canada, Mexico, Brazil, Argentina, Chile, Saudi Arabia, UAE, South Africa, Turkey and Israel
Competitive landscape Leading Companies, Market Positioning of Companies, Competitive Strategies, and Industry Risks

Request Free Sample

Research Analyst Overview

  • The Paper Notebooks Market demonstrates remarkable resilience through continuous material innovation and targeted functional design adjustments. The strategic deployment of circular economy manufacturing pipelines has enabled leading production facilities to achieve a 25% reduction in overall processing waste compared to conventional manufacturing methods.
  • Institutional buyers increasingly mandate the inclusion of a thread bound spine and micro perforated page margins to guarantee data integrity and physical flexibility in rigorous academic environments. Furthermore, manufacturers are actively transitioning toward high grade materials, replacing standard pulp with acid free pulp to dramatically extend product lifespans across diverse geographic territories.
  • Corporate design strategies heavily prioritize sequential page numbering and sophisticated portfolios, transforming basic writing instruments into highly sophisticated cognitive organization tools. By optimizing the tactile writing experience with specialized paper formulations, suppliers successfully align product development with stringent corporate wellness initiatives.
  • This persistent focus on structural durability and ecological compliance ensures the physical notebook remains an indispensable asset for strategic boardroom planning and complex project execution.

What are the Key Data Covered in this Paper Notebooks Market Research and Growth Report?

  • What is the expected growth of the Paper Notebooks Market between 2026 and 2030?

    • USD 26.03 billion, at a CAGR of 7.9%

  • What segmentation does the market report cover?

    • The report is segmented by Distribution Channel (Offline, and Online), End-user (Academic institutions, and Corporates), Product Type (Spiral notebooks, Composition notebooks, Executive notebooks, Laboratory notebooks, and Others) and Geography (APAC, Europe, North America, South America, Middle East and Africa)

  • Which regions are analyzed in the report?

    • APAC, Europe, North America, South America and Middle East and Africa

  • What are the key growth drivers and market challenges?

    • Rising educational enrollment and institutional back to school demand, Proliferation of advanced digital note taking ecosystems and smart stylus adoption

  • Who are the major players in the Paper Notebooks Market?

    • ACCO Brands Corp., Baronfig Inc., C. Josef Lamy GmbH, Designphil Inc., Dingbats Notebooks Ltd, Faber Castell AG, Field Notes Brand, Frank Smythson Ltd, Hallmark Cards Inc., Hamelin Group, ITC Ltd., KOKUYO Co. Ltd., Maruman Corp, Moleskine S.r.l., MUJI, Navneet Education Ltd, Paperblanks, Rhodia, Ryohin Keikaku Co. Ltd., Societe Bic S.A and The ODP Corp.

Market Research Insights

  • The Paper Notebooks Market operates within a highly dynamic landscape characterized by rapid shifts in procurement methodologies and environmental compliance. Companies leveraging digital supply chain integrations have increased customer retention by 22% compared to traditional wholesale channels. To mitigate the impact of fluctuating freight costs, regional manufacturers are localizing operations, improving order fulfillment speeds by 18%.
  • Furthermore, the strict enforcement of environmental regulations is compelling producers to integrate sustainable materials and introduce expansive visual customization. These operational adaptations not only ensure regulatory alignment but also elevate supply chain transparency, directly enabling enterprises to reduce excess inventory holding costs by 15% across major urban distribution networks.

We can help! Our analysts can customize this paper notebooks market research report to meet your requirements.

Get in touch

1. Executive Summary

1.1 Market overview

Executive Summary - Chart on Market Overview
Executive Summary - Data Table on Market Overview
Executive Summary - Chart on Global Market Characteristics
Executive Summary - Chart on Market by Geography
Executive Summary - Chart on Market Segmentation by Distribution Channel
Executive Summary - Chart on Market Segmentation by End-user
Executive Summary - Chart on Market Segmentation by Product Type
Executive Summary - Chart on Incremental Growth
Executive Summary - Data Table on Incremental Growth
Executive Summary - Chart on Company Market Positioning

2. Technavio Analysis

2.1 Analysis of price sensitivity, lifecycle, customer purchase basket, adoption rates, and purchase criteria

2.2 Criticality of inputs and Factors of differentiation

Chart on Overview on criticality of inputs and factors of differentiation

2.3 Factors of disruption

Chart on Overview on factors of disruption

2.4 Impact of drivers and challenges

Chart on Impact of drivers and challenges in 2025 and 2030

3. Market Landscape

3.1 Market ecosystem

Chart on Parent Market
Data Table on - Parent Market

3.2 Market characteristics

Chart on Market characteristics analysis

3.3 Value chain analysis

Chart on Value chain analysis

4. Market Sizing

4.1 Market definition

Data Table on Offerings of companies included in the market definition

4.2 Market segment analysis

Market segments

4.3 Market size 2025

4.4 Market outlook: Forecast for 2025-2030

Chart on Global - Market size and forecast 2025-2030 ($ million)
Data Table on Global - Market size and forecast 2025-2030 ($ million)
Chart on Global Market: Year-over-year growth 2025-2030 (%)
Data Table on Global Market: Year-over-year growth 2025-2030 (%)

5. Historic Market Size

5.1 Global Paper Notebooks Market 2020 - 2024

Historic Market Size - Data Table on Global Paper Notebooks Market 2020 - 2024 ($ million)

5.2 Distribution Channel segment analysis 2020 - 2024

Historic Market Size - Distribution Channel Segment 2020 - 2024 ($ million)

5.3 End-user segment analysis 2020 - 2024

Historic Market Size - End-user Segment 2020 - 2024 ($ million)

5.4 Product Type segment analysis 2020 - 2024

Historic Market Size - Product Type Segment 2020 - 2024 ($ million)

5.5 Geography segment analysis 2020 - 2024

Historic Market Size - Geography Segment 2020 - 2024 ($ million)

5.6 Country segment analysis 2020 - 2024

Historic Market Size - Country Segment 2020 - 2024 ($ million)

6. Qualitative Analysis

6.1 Impact of AI on global paper notebooks market

6.2 Impact of geopolitical conflicts on global paper notebooks market

7. Five Forces Analysis

7.1 Five forces summary

Five forces analysis - Comparison between 2025 and 2030

7.2 Bargaining power of buyers

Bargaining power of buyers - Impact of key factors 2025 and 2030

7.3 Bargaining power of suppliers

Bargaining power of suppliers - Impact of key factors in 2025 and 2030

7.4 Threat of new entrants

Threat of new entrants - Impact of key factors in 2025 and 2030

7.5 Threat of substitutes

Threat of substitutes - Impact of key factors in 2025 and 2030

7.6 Threat of rivalry

Threat of rivalry - Impact of key factors in 2025 and 2030

7.7 Market condition

Chart on Market condition - Five forces 2025 and 2030

8. Market Segmentation by Distribution Channel

8.1 Market segments

Chart on Distribution Channel - Market share 2025-2030 (%)
Data Table on Distribution Channel - Market share 2025-2030 (%)

8.2 Comparison by Distribution Channel

Chart on Comparison by Distribution Channel
Data Table on Comparison by Distribution Channel

8.3 Offline - Market size and forecast 2025-2030

Chart on Offline - Market size and forecast 2025-2030 ($ million)
Data Table on Offline - Market size and forecast 2025-2030 ($ million)
Chart on Offline - Year-over-year growth 2025-2030 (%)
Data Table on Offline - Year-over-year growth 2025-2030 (%)

8.4 Online - Market size and forecast 2025-2030

Chart on Online - Market size and forecast 2025-2030 ($ million)
Data Table on Online - Market size and forecast 2025-2030 ($ million)
Chart on Online - Year-over-year growth 2025-2030 (%)
Data Table on Online - Year-over-year growth 2025-2030 (%)

8.5 Market opportunity by Distribution Channel

Market opportunity by Distribution Channel ($ million)
Data Table on Market opportunity by Distribution Channel ($ million)

9. Market Segmentation by End-user

9.1 Market segments

Chart on End-user - Market share 2025-2030 (%)
Data Table on End-user - Market share 2025-2030 (%)

9.2 Comparison by End-user

Chart on Comparison by End-user
Data Table on Comparison by End-user

9.3 Academic institutions - Market size and forecast 2025-2030

Chart on Academic institutions - Market size and forecast 2025-2030 ($ million)
Data Table on Academic institutions - Market size and forecast 2025-2030 ($ million)
Chart on Academic institutions - Year-over-year growth 2025-2030 (%)
Data Table on Academic institutions - Year-over-year growth 2025-2030 (%)

9.4 Corporates - Market size and forecast 2025-2030

Chart on Corporates - Market size and forecast 2025-2030 ($ million)
Data Table on Corporates - Market size and forecast 2025-2030 ($ million)
Chart on Corporates - Year-over-year growth 2025-2030 (%)
Data Table on Corporates - Year-over-year growth 2025-2030 (%)

9.5 Market opportunity by End-user

Market opportunity by End-user ($ million)
Data Table on Market opportunity by End-user ($ million)

10. Market Segmentation by Product Type

10.1 Market segments

Chart on Product Type - Market share 2025-2030 (%)
Data Table on Product Type - Market share 2025-2030 (%)

10.2 Comparison by Product Type

Chart on Comparison by Product Type
Data Table on Comparison by Product Type

10.3 Spiral notebooks - Market size and forecast 2025-2030

Chart on Spiral notebooks - Market size and forecast 2025-2030 ($ million)
Data Table on Spiral notebooks - Market size and forecast 2025-2030 ($ million)
Chart on Spiral notebooks - Year-over-year growth 2025-2030 (%)
Data Table on Spiral notebooks - Year-over-year growth 2025-2030 (%)

10.4 Composition notebooks - Market size and forecast 2025-2030

Chart on Composition notebooks - Market size and forecast 2025-2030 ($ million)
Data Table on Composition notebooks - Market size and forecast 2025-2030 ($ million)
Chart on Composition notebooks - Year-over-year growth 2025-2030 (%)
Data Table on Composition notebooks - Year-over-year growth 2025-2030 (%)

10.5 Executive notebooks - Market size and forecast 2025-2030

Chart on Executive notebooks - Market size and forecast 2025-2030 ($ million)
Data Table on Executive notebooks - Market size and forecast 2025-2030 ($ million)
Chart on Executive notebooks - Year-over-year growth 2025-2030 (%)
Data Table on Executive notebooks - Year-over-year growth 2025-2030 (%)

10.6 Laboratory notebooks - Market size and forecast 2025-2030

Chart on Laboratory notebooks - Market size and forecast 2025-2030 ($ million)
Data Table on Laboratory notebooks - Market size and forecast 2025-2030 ($ million)
Chart on Laboratory notebooks - Year-over-year growth 2025-2030 (%)
Data Table on Laboratory notebooks - Year-over-year growth 2025-2030 (%)

10.7 Others - Market size and forecast 2025-2030

Chart on Others - Market size and forecast 2025-2030 ($ million)
Data Table on Others - Market size and forecast 2025-2030 ($ million)
Chart on Others - Year-over-year growth 2025-2030 (%)
Data Table on Others - Year-over-year growth 2025-2030 (%)

10.8 Market opportunity by Product Type

Market opportunity by Product Type ($ million)
Data Table on Market opportunity by Product Type ($ million)

11. Customer Landscape

11.1 Customer landscape overview

Analysis of price sensitivity, lifecycle, customer purchase basket, adoption rates, and purchase criteria

12. Geographic Landscape

12.1 Geographic segmentation

Chart on Market share by geography 2025-2030 (%)
Data Table on Market share by geography 2025-2030 (%)

12.2 Geographic comparison

Chart on Geographic comparison
Data Table on Geographic comparison

12.3 APAC - Market size and forecast 2025-2030

Chart on APAC - Market size and forecast 2025-2030 ($ million)
Data Table on APAC - Market size and forecast 2025-2030 ($ million)
Chart on APAC - Year-over-year growth 2025-2030 (%)
Data Table on APAC - Year-over-year growth 2025-2030 (%)
Chart on Regional Comparison - APAC
Data Table on Regional Comparison - APAC

12.3.1 China - Market size and forecast 2025-2030

Chart on China - Market size and forecast 2025-2030 ($ million)
Data Table on China - Market size and forecast 2025-2030 ($ million)
Chart on China - Year-over-year growth 2025-2030 (%)
Data Table on China - Year-over-year growth 2025-2030 (%)

12.3.2 India - Market size and forecast 2025-2030

Chart on India - Market size and forecast 2025-2030 ($ million)
Data Table on India - Market size and forecast 2025-2030 ($ million)
Chart on India - Year-over-year growth 2025-2030 (%)
Data Table on India - Year-over-year growth 2025-2030 (%)

12.3.3 Japan - Market size and forecast 2025-2030

Chart on Japan - Market size and forecast 2025-2030 ($ million)
Data Table on Japan - Market size and forecast 2025-2030 ($ million)
Chart on Japan - Year-over-year growth 2025-2030 (%)
Data Table on Japan - Year-over-year growth 2025-2030 (%)

12.3.4 South Korea - Market size and forecast 2025-2030

Chart on South Korea - Market size and forecast 2025-2030 ($ million)
Data Table on South Korea - Market size and forecast 2025-2030 ($ million)
Chart on South Korea - Year-over-year growth 2025-2030 (%)
Data Table on South Korea - Year-over-year growth 2025-2030 (%)

12.3.5 Indonesia - Market size and forecast 2025-2030

Chart on Indonesia - Market size and forecast 2025-2030 ($ million)
Data Table on Indonesia - Market size and forecast 2025-2030 ($ million)
Chart on Indonesia - Year-over-year growth 2025-2030 (%)
Data Table on Indonesia - Year-over-year growth 2025-2030 (%)

12.3.6 Australia - Market size and forecast 2025-2030

Chart on Australia - Market size and forecast 2025-2030 ($ million)
Data Table on Australia - Market size and forecast 2025-2030 ($ million)
Chart on Australia - Year-over-year growth 2025-2030 (%)
Data Table on Australia - Year-over-year growth 2025-2030 (%)

12.4 Europe - Market size and forecast 2025-2030

Chart on Europe - Market size and forecast 2025-2030 ($ million)
Data Table on Europe - Market size and forecast 2025-2030 ($ million)
Chart on Europe - Year-over-year growth 2025-2030 (%)
Data Table on Europe - Year-over-year growth 2025-2030 (%)
Chart on Regional Comparison - Europe
Data Table on Regional Comparison - Europe

12.4.1 Germany - Market size and forecast 2025-2030

Chart on Germany - Market size and forecast 2025-2030 ($ million)
Data Table on Germany - Market size and forecast 2025-2030 ($ million)
Chart on Germany - Year-over-year growth 2025-2030 (%)
Data Table on Germany - Year-over-year growth 2025-2030 (%)

12.4.2 UK - Market size and forecast 2025-2030

Chart on UK - Market size and forecast 2025-2030 ($ million)
Data Table on UK - Market size and forecast 2025-2030 ($ million)
Chart on UK - Year-over-year growth 2025-2030 (%)
Data Table on UK - Year-over-year growth 2025-2030 (%)

12.4.3 France - Market size and forecast 2025-2030

Chart on France - Market size and forecast 2025-2030 ($ million)
Data Table on France - Market size and forecast 2025-2030 ($ million)
Chart on France - Year-over-year growth 2025-2030 (%)
Data Table on France - Year-over-year growth 2025-2030 (%)

12.4.4 Italy - Market size and forecast 2025-2030

Chart on Italy - Market size and forecast 2025-2030 ($ million)
Data Table on Italy - Market size and forecast 2025-2030 ($ million)
Chart on Italy - Year-over-year growth 2025-2030 (%)
Data Table on Italy - Year-over-year growth 2025-2030 (%)

12.4.5 Spain - Market size and forecast 2025-2030

Chart on Spain - Market size and forecast 2025-2030 ($ million)
Data Table on Spain - Market size and forecast 2025-2030 ($ million)
Chart on Spain - Year-over-year growth 2025-2030 (%)
Data Table on Spain - Year-over-year growth 2025-2030 (%)

12.4.6 The Netherlands - Market size and forecast 2025-2030

Chart on The Netherlands - Market size and forecast 2025-2030 ($ million)
Data Table on The Netherlands - Market size and forecast 2025-2030 ($ million)
Chart on The Netherlands - Year-over-year growth 2025-2030 (%)
Data Table on The Netherlands - Year-over-year growth 2025-2030 (%)

12.5 North America - Market size and forecast 2025-2030

Chart on North America - Market size and forecast 2025-2030 ($ million)
Data Table on North America - Market size and forecast 2025-2030 ($ million)
Chart on North America - Year-over-year growth 2025-2030 (%)
Data Table on North America - Year-over-year growth 2025-2030 (%)
Chart on Regional Comparison - North America
Data Table on Regional Comparison - North America

12.5.1 US - Market size and forecast 2025-2030

Chart on US - Market size and forecast 2025-2030 ($ million)
Data Table on US - Market size and forecast 2025-2030 ($ million)
Chart on US - Year-over-year growth 2025-2030 (%)
Data Table on US - Year-over-year growth 2025-2030 (%)

12.5.2 Canada - Market size and forecast 2025-2030

Chart on Canada - Market size and forecast 2025-2030 ($ million)
Data Table on Canada - Market size and forecast 2025-2030 ($ million)
Chart on Canada - Year-over-year growth 2025-2030 (%)
Data Table on Canada - Year-over-year growth 2025-2030 (%)

12.5.3 Mexico - Market size and forecast 2025-2030

Chart on Mexico - Market size and forecast 2025-2030 ($ million)
Data Table on Mexico - Market size and forecast 2025-2030 ($ million)
Chart on Mexico - Year-over-year growth 2025-2030 (%)
Data Table on Mexico - Year-over-year growth 2025-2030 (%)

12.6 South America - Market size and forecast 2025-2030

Chart on South America - Market size and forecast 2025-2030 ($ million)
Data Table on South America - Market size and forecast 2025-2030 ($ million)
Chart on South America - Year-over-year growth 2025-2030 (%)
Data Table on South America - Year-over-year growth 2025-2030 (%)
Chart on Regional Comparison - South America
Data Table on Regional Comparison - South America

12.6.1 Brazil - Market size and forecast 2025-2030

Chart on Brazil - Market size and forecast 2025-2030 ($ million)
Data Table on Brazil - Market size and forecast 2025-2030 ($ million)
Chart on Brazil - Year-over-year growth 2025-2030 (%)
Data Table on Brazil - Year-over-year growth 2025-2030 (%)

12.6.2 Argentina - Market size and forecast 2025-2030

Chart on Argentina - Market size and forecast 2025-2030 ($ million)
Data Table on Argentina - Market size and forecast 2025-2030 ($ million)
Chart on Argentina - Year-over-year growth 2025-2030 (%)
Data Table on Argentina - Year-over-year growth 2025-2030 (%)

12.6.3 Chile - Market size and forecast 2025-2030

Chart on Chile - Market size and forecast 2025-2030 ($ million)
Data Table on Chile - Market size and forecast 2025-2030 ($ million)
Chart on Chile - Year-over-year growth 2025-2030 (%)
Data Table on Chile - Year-over-year growth 2025-2030 (%)

12.7 Middle East and Africa - Market size and forecast 2025-2030

Chart on Middle East and Africa - Market size and forecast 2025-2030 ($ million)
Data Table on Middle East and Africa - Market size and forecast 2025-2030 ($ million)
Chart on Middle East and Africa - Year-over-year growth 2025-2030 (%)
Data Table on Middle East and Africa - Year-over-year growth 2025-2030 (%)
Chart on Regional Comparison - Middle East and Africa
Data Table on Regional Comparison - Middle East and Africa

12.7.1 Saudi Arabia - Market size and forecast 2025-2030

Chart on Saudi Arabia - Market size and forecast 2025-2030 ($ million)
Data Table on Saudi Arabia - Market size and forecast 2025-2030 ($ million)
Chart on Saudi Arabia - Year-over-year growth 2025-2030 (%)
Data Table on Saudi Arabia - Year-over-year growth 2025-2030 (%)

12.7.2 UAE - Market size and forecast 2025-2030

Chart on UAE - Market size and forecast 2025-2030 ($ million)
Data Table on UAE - Market size and forecast 2025-2030 ($ million)
Chart on UAE - Year-over-year growth 2025-2030 (%)
Data Table on UAE - Year-over-year growth 2025-2030 (%)

12.7.3 South Africa - Market size and forecast 2025-2030

Chart on South Africa - Market size and forecast 2025-2030 ($ million)
Data Table on South Africa - Market size and forecast 2025-2030 ($ million)
Chart on South Africa - Year-over-year growth 2025-2030 (%)
Data Table on South Africa - Year-over-year growth 2025-2030 (%)

12.7.4 Turkey - Market size and forecast 2025-2030

Chart on Turkey - Market size and forecast 2025-2030 ($ million)
Data Table on Turkey - Market size and forecast 2025-2030 ($ million)
Chart on Turkey - Year-over-year growth 2025-2030 (%)
Data Table on Turkey - Year-over-year growth 2025-2030 (%)

12.7.5 Israel - Market size and forecast 2025-2030

Chart on Israel - Market size and forecast 2025-2030 ($ million)
Data Table on Israel - Market size and forecast 2025-2030 ($ million)
Chart on Israel - Year-over-year growth 2025-2030 (%)
Data Table on Israel - Year-over-year growth 2025-2030 (%)

12.8 Market opportunity by geography

Market opportunity by geography ($ million)
Data Tables on Market opportunity by geography ($ million)

13. Drivers, Challenges, and Opportunity

13.1 Market drivers

Rising educational enrollment and institutional back to school demand
Escalating corporate preference for premium tactile productivity and corporate wellness
Accelerating adoption of sustainable sourcing and circular economy manufacturing pipelines

13.2 Market challenges

Proliferation of advanced digital note taking ecosystems and smart stylus adoption
Persistent volatility in raw pulp pricing and persistent material supply pressures
Stringent environmental regulations and industrial compliance demands

13.3 Impact of drivers and challenges

Impact of drivers and challenges in 2025 and 2030

13.4 Market opportunities

Direct to consumer customization and integrated student centric branding
Academic motivation boosting through vibrant color coded subject segmentation
Proliferation of agricultural waste paper and nonwood fiber sourcing

14. Competitive Landscape

14.1 Overview

14.2

Overview on criticality of inputs and factors of differentiation

14.3 Landscape disruption

Overview on factors of disruption

14.4 Industry risks

Impact of key risks on business

15. Competitive Analysis

15.1 Companies profiled

Companies covered

15.2 Company ranking index

15.3 Market positioning of companies

Matrix on companies position and classification

15.4 ACCO Brands Corp.

ACCO Brands Corp. - Overview
ACCO Brands Corp. - Business segments
ACCO Brands Corp. - Key offerings
ACCO Brands Corp. - Segment focus
SWOT

15.5 C. Josef Lamy GmbH

C. Josef Lamy GmbH - Overview
C. Josef Lamy GmbH - Product / Service
C. Josef Lamy GmbH - Key offerings
SWOT

15.6 Designphil Inc.

Designphil Inc. - Overview
Designphil Inc. - Product / Service
Designphil Inc. - Key offerings
SWOT

15.7 Faber Castell AG

Faber Castell AG - Overview
Faber Castell AG - Product / Service
Faber Castell AG - Key offerings
SWOT

15.8 Frank Smythson Ltd

Frank Smythson Ltd - Overview
Frank Smythson Ltd - Product / Service
Frank Smythson Ltd - Key offerings
SWOT

15.9 Hallmark Cards Inc.

Hallmark Cards Inc. - Overview
Hallmark Cards Inc. - Product / Service
Hallmark Cards Inc. - Key offerings
SWOT

15.10 Hamelin Group

Hamelin Group - Overview
Hamelin Group - Product / Service
Hamelin Group - Key offerings
SWOT

15.11 ITC Ltd.

ITC Ltd. - Overview
ITC Ltd. - Business segments
ITC Ltd. - Key offerings
ITC Ltd. - Segment focus
SWOT

15.12 KOKUYO Co. Ltd.

KOKUYO Co. Ltd. - Overview
KOKUYO Co. Ltd. - Business segments
KOKUYO Co. Ltd. - Key offerings
KOKUYO Co. Ltd. - Segment focus
SWOT

15.13 Moleskine S.r.l.

Moleskine S.r.l. - Overview
Moleskine S.r.l. - Product / Service
Moleskine S.r.l. - Key offerings
SWOT

15.14 Navneet Education Ltd

Navneet Education Ltd - Overview
Navneet Education Ltd - Business segments
Navneet Education Ltd - Key offerings
Navneet Education Ltd - Segment focus
SWOT

15.15 Paperblanks

Paperblanks - Overview
Paperblanks - Product / Service
Paperblanks - Key offerings
SWOT

15.16 Ryohin Keikaku Co. Ltd.

Ryohin Keikaku Co. Ltd. - Overview
Ryohin Keikaku Co. Ltd. - Business segments
Ryohin Keikaku Co. Ltd. - Key offerings
Ryohin Keikaku Co. Ltd. - Segment focus
SWOT

15.17 Societe Bic S.A

Societe Bic S.A - Overview
Societe Bic S.A - Product / Service
Societe Bic S.A - Key offerings
SWOT

15.18 The ODP Corp.

The ODP Corp. - Overview
The ODP Corp. - Business segments
The ODP Corp. - Key offerings
The ODP Corp. - Segment focus
SWOT

16. Appendix

16.1 Scope of the report

Market definition
Objectives
Notes and caveats

16.2 Inclusions and exclusions checklist

Inclusions checklist
Exclusions checklist

16.3 Currency conversion rates for US$

16.4 Research methodology

16.5 Data procurement

Information sources

16.6 Data validation

16.7 Validation techniques employed for market sizing

16.8 Data synthesis

16.9 360 degree market analysis

16.10 List of abbreviations

Research Methodology

Technavio presents a detailed picture of the market by way of study, synthesis, and summation of data from multiple sources. The analysts have presented the various facets of the market with a particular focus on identifying the key industry influencers. The data thus presented is comprehensive, reliable, and the result of extensive research, both primary and secondary.

INFORMATION SOURCES

Primary sources

  • Manufacturers and suppliers
  • Channel partners
  • Industry experts
  • Strategic decision makers

Secondary sources

  • Industry journals and periodicals
  • Government data
  • Financial reports of key industry players
  • Historical data
  • Press releases

DATA ANALYSIS

Data Synthesis

  • Collation of data
  • Estimation of key figures
  • Analysis of derived insights

Data Validation

  • Triangulation with data models
  • Reference against proprietary databases
  • Corroboration with industry experts

REPORT WRITING

Qualitative

  • Market drivers
  • Market challenges
  • Market trends
  • Five forces analysis

Quantitative

  • Market size and forecast
  • Market segmentation
  • Geographical insights
  • Competitive landscape

Interested in this report?

Get your sample now to see our research methodology and insights!

Download Now

Frequently Asked Questions

Paper Notebooks market growth will increase by USD 26032.8 million during 2026-2030.

The Paper Notebooks market is expected to grow at a CAGR of 7.9% during 2026-2030.

Paper Notebooks market is segmented by Distribution channel (Offline, Online) End-user (Academic institutions, Corporates) Product type (Spiral notebooks, Composition notebooks, Executive notebooks, Laboratory notebooks, Others)

ACCO Brands Corp., Baronfig Inc., C. Josef Lamy GmbH, Designphil Inc., Dingbats Notebooks Ltd, Faber Castell AG, Field Notes Brand, Frank Smythson Ltd, Hallmark Cards Inc., Hamelin Group, ITC Ltd., KOKUYO Co. Ltd., Maruman Corp, Moleskine S.r.l., MUJI, Navneet Education Ltd, Paperblanks, Rhodia, Ryohin Keikaku Co. Ltd., Societe Bic S.A, The ODP Corp. are a few of the key vendors in the Paper Notebooks market.

APAC will register the highest growth rate of 38.2% among the other regions. Therefore, the Paper Notebooks market in APAC is expected to garner significant business opportunities for the vendors during the forecast period.

China, India, Japan, South Korea, Indonesia, Australia, Germany, UK, France, Italy, Spain, The Netherlands, US, Canada, Mexico, Brazil, Argentina, Chile, Saudi Arabia, UAE, South Africa, Turkey, Israel

  • Rising educational enrollment and institutional back to school demand is the driving factor this market.

The Paper Notebooks market vendors should focus on grabbing business opportunities from the Distribution channel segment as it accounted for the largest market share in the base year.
RIA - Research AI Assistant
Ask RIA
