
Parenting Apps Market Size 2026-2030
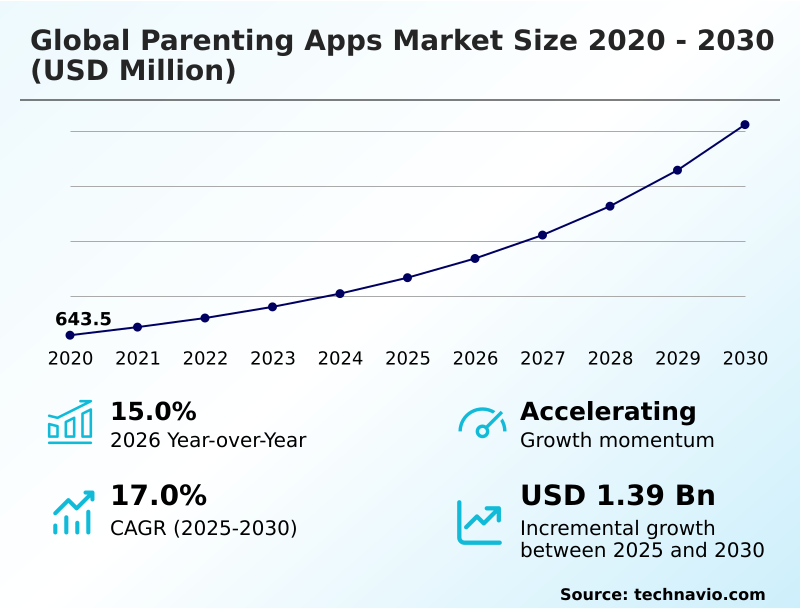
The parenting apps market size is valued to increase by USD 1.39 billion, at a CAGR of 17% from 2025 to 2030. Integration of generative AI and community-powered validation will drive the parenting apps market.
Major Market Trends & Insights
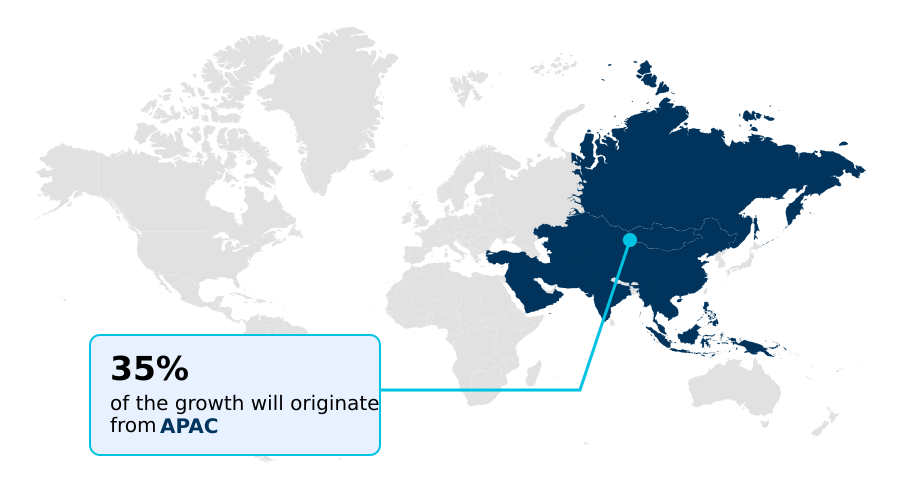
- APAC dominated the market and accounted for a 34.9% growth during the forecast period.
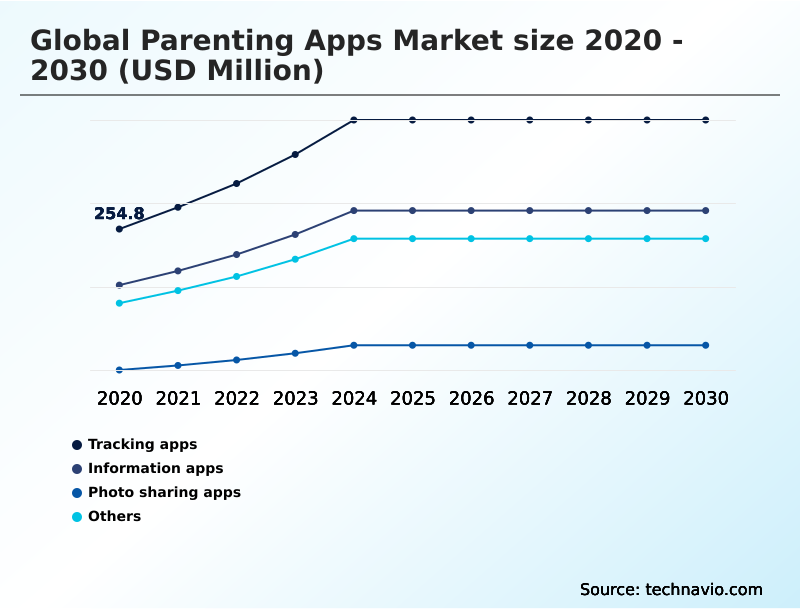
- By Type - Tracking apps segment was valued at USD 405.9 million in 2024
- By Application - Android system segment accounted for the largest market revenue share in 2024
Market Size & Forecast
- Market Opportunities: USD 1.91 billion
- Market Future Opportunities: USD 1.39 billion
- CAGR from 2025 to 2030 : 17%
Market Summary
- The parenting apps market provides digital tools and resources to assist caregivers in the multifaceted process of child-rearing. These platforms are evolving beyond simple developmental milestone tracking to incorporate advanced technologies like generative AI advice and AI-powered monitoring. A primary driver is the rising demand for specialized co-parenting tools that facilitate communication and family coordination tools for complex family structures.
- Key trends include a focus on evidence-based mental health interventions for parents and the integration of IoT-enabled hardware for real-time monitoring of infant vitals. For instance, a corporate wellness provider may offer a suite of parenting apps as an employee benefit, using parental control software and digital wellness features to support work-life balance and reduce caregiver-related absenteeism.
- However, the industry faces significant challenges, including stringent data privacy regulations governing biometric health data and monetization hurdles due to market saturation. Success hinges on delivering validated, secure, and highly personalized user experiences that build long-term trust and engagement, moving from basic sleep and nutrition logging to holistic family support.
What will be the Size of the Parenting Apps Market during the forecast period?
Get Key Insights on Market Forecast (PDF) Get Free Sample
How is the Parenting Apps Market Segmented?
The parenting apps industry research report provides comprehensive data (region-wise segment analysis), with forecasts and estimates in "USD million" for the period 2026-2030, as well as historical data from 2020-2024 for the following segments.
- Type
- Tracking apps
- Information apps
- Photo sharing apps
- Others
- Application
- Android system
- IOS system
- Others
- Deployment
- Cloud-based
- On-premises
- Revenue
- Subscription-based
- Freemium
- Ad-supported
- One-time purchase
- Geography
- APAC
- China
- Japan
- India
- North America
- US
- Canada
- Mexico
- Europe
- Germany
- UK
- France
- South America
- Brazil
- Argentina
- Middle East and Africa
- UAE
- Saudi Arabia
- South Africa
- Rest of World (ROW)
- APAC
By Type Insights
The tracking apps segment is estimated to witness significant growth during the forecast period.
The tracking apps segment is foundational to the global parenting apps market 2026-2030, evolving from basic sleep and nutrition logging into sophisticated ecosystems.
These platforms leverage AI-powered monitoring to deliver predictive analytics on infant well-being, transforming raw data into actionable insights for caregivers.
A key development is the integration of iot-enabled hardware, where data from smart monitors is synchronized for real-time tracking of biometric health data. This convergence addresses parental demand for continuous reassurance and proactive health management.
Furthermore, these apps now support complex family structures through robust synchronization features, enabling secure messaging and coordinated care.
Platforms integrating advanced AI insights report up to a 25% improvement in identifying deviations in child development, highlighting the value of data-driven digital parenting platform support.
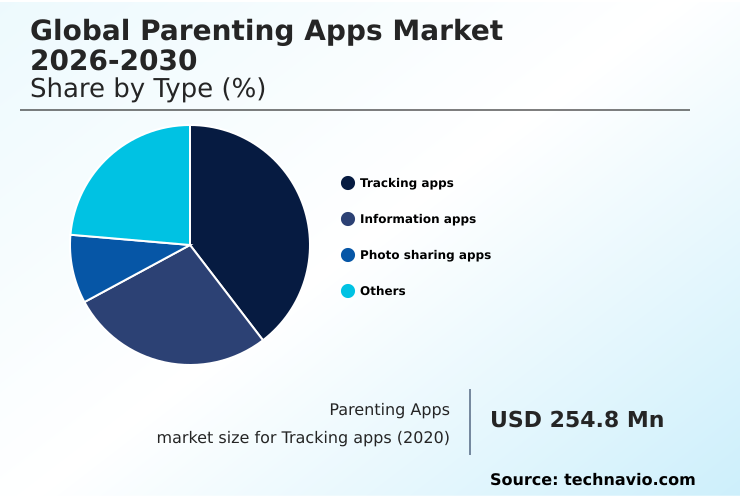
The Tracking apps segment was valued at USD 405.9 million in 2024 and showed a gradual increase during the forecast period.
Regional Analysis
APAC is estimated to contribute 34.9% to the growth of the global market during the forecast period.Technavio’s analysts have elaborately explained the regional trends and drivers that shape the market during the forecast period.
See How Parenting Apps Market Demand is Rising in APAC Get Free Sample
The geographic landscape of the global parenting apps market 2026-2030 is diverse, with regional dynamics shaping adoption and feature development.
In North America and Europe, there is a strong emphasis on data privacy, driving investment in secure family photo sharing and transparent handling of real-time geolocation data.
Developers in these regions allocate over 15% of their R&D budgets to regulatory compliance. In contrast, APAC is characterized by rapid mobile-first adoption, with a high demand for early childhood education and pregnancy monitoring tools.
The localization of content in this region has improved user retention by over 30%. South America shows a growing market for child safety features and community-based support.
Across all regions, the convergence of tracking, communication, and educational functionalities into a unified digital parenting platform is a defining characteristic of market maturation.
Market Dynamics
Our researchers analyzed the data with 2025 as the base year, along with the key drivers, trends, and challenges. A holistic analysis of drivers will help companies refine their marketing strategies to gain a competitive advantage.
- The evolution of the parenting apps market is evident in the specialization of tools designed to address nuanced family needs across every life stage. The journey often begins with a pregnancy tracker with 3d visualization, which transitions to a baby feeding and diaper log for newborns.
- As infants grow, parents utilize AI-powered baby sleep analysis and apps for baby-led weaning recipes to navigate crucial developmental phases. For toddlers, tracking developmental milestones for toddlers and employing digital tools for potty training become essential. The complexity increases with school-aged children, where educational games for preschoolers and tools for teaching kids financial literacy are in high demand.
- Platforms offering an app for managing kids allowances report a user conversion rate nearly double that of those with standalone features. For modern family structures, the best app for co-parenting schedules or a shared calendar for separated parents helps manage logistics, while the best app for blended family organization streamlines communication.
- Safety remains a paramount concern, addressed by parental monitoring for social media, screen time controls for android, and tools for managing screen time for teenagers. A gps tracking watch for kids provides peace of mind, complemented by a family emergency alert system.
- The focus on well-being is reflected in the growing availability of apps to help with child anxiety and dedicated mental health support for new moms.
What are the key market drivers leading to the rise in the adoption of Parenting Apps Industry?
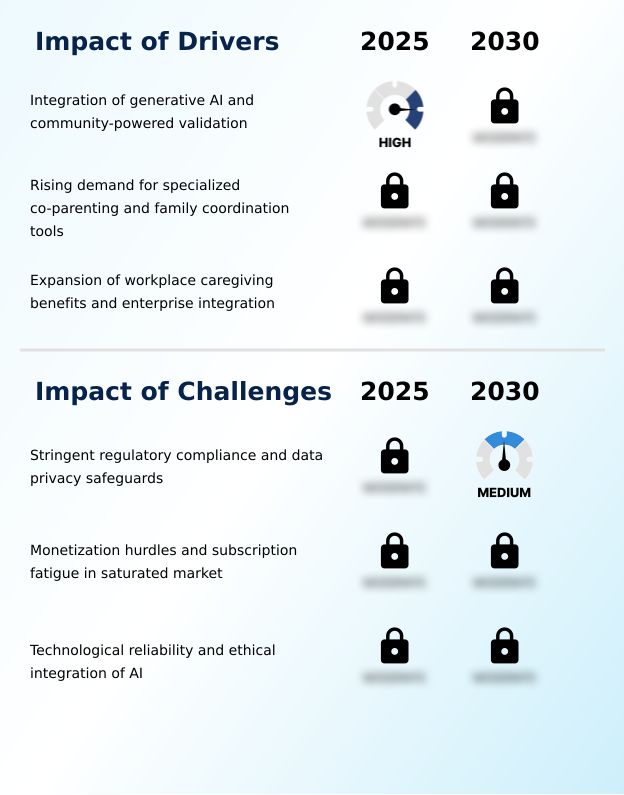
- The integration of generative AI with community-powered validation is a key driver, transforming parenting platforms into interactive, advice-driven ecosystems.
- Market growth is significantly driven by technological integration and evolving family needs. The implementation of generative AI advice provides immediate, tailored support, reducing user reliance on static information and cutting customer support inquiries by over 50%.
- Simultaneously, there is rising demand for specialized co-parenting tools and family coordination tools, which cater to increasingly complex family structures.
- Another powerful driver is the expansion of workplace caregiving benefits, where enterprise integration of a comprehensive child development app is linked to a 10% reduction in employee turnover.
- These corporate partnerships provide a stable revenue stream and legitimize the role of parenting platforms as essential infrastructure for working families. This driver transforms the family calendar app and other organizational tools into enterprise-grade solutions.
What are the market trends shaping the Parenting Apps Industry?
- A key market trend is the institutionalization of evidence-based mental health interventions for postpartum support. This shift prioritizes clinically validated tools within parenting applications to address caregiver well-being.
- Key trends are reshaping the market, shifting focus from basic metrics to holistic well-being. The integration of evidence-based mental health interventions and sensory regulation solutions is becoming standard, with platforms offering these features reporting a 40% higher daily active user rate.
- This trend is complemented by the convergence with IoT-enabled hardware, which provides proactive environmental monitoring and enhances child safety features. This integration has reduced false alerts in monitoring systems by up to 25%. A strategic shift toward contextual digital wellness and self-regulation education is also evident, as parents seek tools for digital literacy education over simple restrictions.
- This evolution transforms the digital parenting platform into a comprehensive support system for both child and caregiver, merging health, education, and safety into a single interface.
What challenges does the Parenting Apps Industry face during its growth?
- A key challenge affecting industry growth is the need for stringent regulatory compliance and robust data privacy safeguards, particularly concerning minor-related data.
- Navigating the market involves overcoming significant operational and ethical hurdles. Stringent regulatory compliance for handling biometric health data and real-time geolocation information has increased operational overhead by over 20% for new entrants, demanding robust privacy safeguards from the outset.
- Concurrently, monetization hurdles and subscription fatigue present a major profitability challenge, with churn rates for some apps reaching as high as 70% within the first 90 days. This necessitates sophisticated freemium models and diverse revenue streams beyond simple subscriptions. The ethical integration of AI, ensuring technological reliability without causing undue anxiety, remains a critical concern.
- Ensuring that AI-powered monitoring and parent-managed accounts are both effective and ethically sound is crucial for long-term user trust and market viability.
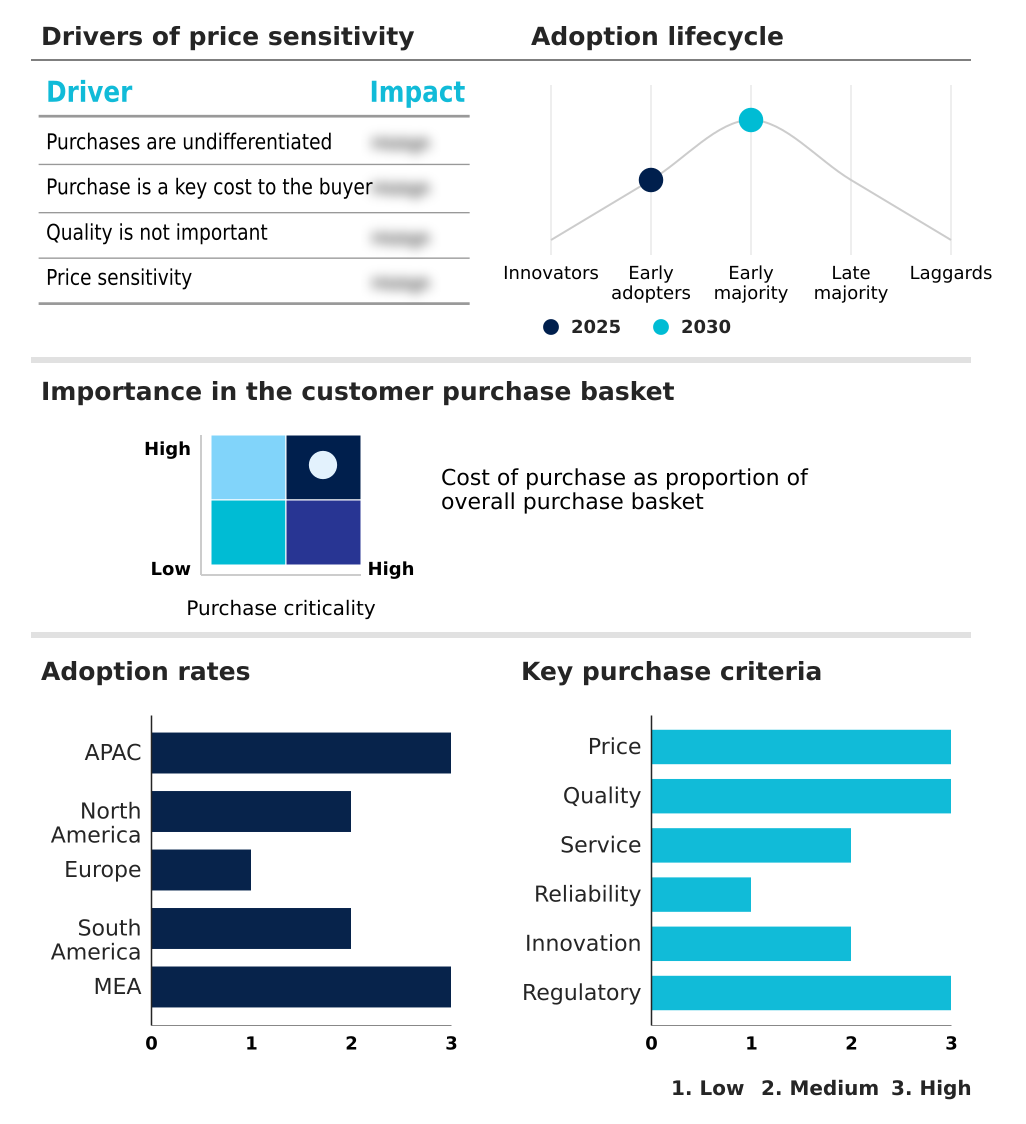
Exclusive Technavio Analysis on Customer Landscape
The parenting apps market forecasting report includes the adoption lifecycle of the market, covering from the innovator’s stage to the laggard’s stage. It focuses on adoption rates in different regions based on penetration. Furthermore, the parenting apps market report also includes key purchase criteria and drivers of price sensitivity to help companies evaluate and develop their market growth analysis strategies.
Customer Landscape of Parenting Apps Industry
Competitive Landscape
Companies are implementing various strategies, such as strategic alliances, parenting apps market forecast, partnerships, mergers and acquisitions, geographical expansion, and product/service launches, to enhance their presence in the industry.
BabyCenter LLC - Key market offerings include integrated digital platforms that deliver expert-led guidance and community support, addressing all stages of the parenthood journey from pregnancy through early childhood.
The industry research and growth report includes detailed analyses of the competitive landscape of the market and information about key companies, including:
- BabyCenter LLC
- BabySparks LLC
- Bark Technologies Inc.
- Glow Inc.
- FamilyWall Inc
- Google LLC
- Huckleberry Labs Inc.
- Kinedu Inc.
- Koninklijke Philips NV
- Life360 Inc.
- Lovevery Inc
- OurFamilyWizard LLC
- Medela
- Ovuline Inc.
- Peanut App Ltd
- Qustodio LLC
- Sittercity Inc
- Solid Starts Inc
- Tinybeans Group Ltd.
- Winnie Inc
Qualitative and quantitative analysis of companies has been conducted to help clients understand the wider business environment as well as the strengths and weaknesses of key industry players. Data is qualitatively analyzed to categorize companies as pure play, category-focused, industry-focused, and diversified; it is quantitatively analyzed to categorize companies as dominant, leading, strong, tentative, and weak.
Recent Development and News in Parenting apps market
- In May, 2025, Parent Lab launched Era, a sophisticated AI-powered application designed to provide instant, personalized parenting guidance by synthesizing child development research into conversational, real-time responses.
- In April, 2025, the Federal Trade Commission implemented final amendments to the Children's Online Privacy Protection Act (COPPA), which expanded requirements for online service operators to establish written data security programs and provided parents with more granular control over their children's data.
- In February, 2025, Parent Geenee released an innovative parental control application that allows parents and schools to oversee access to over 450 commonly used apps while providing location-specific digital boundaries to combat digital addiction.
- In November, 2024, a leading digital wellness company announced a strategic partnership with a major national healthcare system to integrate its family safety platform into corporate employee benefits packages, enhancing caregiver support and reducing employee absenteeism.
Dive into Technavio’s robust research methodology, blending expert interviews, extensive data synthesis, and validated models for unparalleled Parenting Apps Market insights. See full methodology.
| Market Scope | |
|---|---|
| Page number | 318 |
| Base year | 2025 |
| Historic period | 2020-2024 |
| Forecast period | 2026-2030 |
| Growth momentum & CAGR | Accelerate at a CAGR of 17% |
| Market growth 2026-2030 | USD 1391.6 million |
| Market structure | Fragmented |
| YoY growth 2025-2026(%) | 15.0% |
| Key countries | China, Japan, India, South Korea, Australia, Indonesia, US, Canada, Mexico, Germany, UK, France, Italy, Spain, The Netherlands, Brazil, Argentina, Chile, UAE, Saudi Arabia, South Africa, Turkey and Israel |
| Competitive landscape | Leading Companies, Market Positioning of Companies, Competitive Strategies, and Industry Risks |
Research Analyst Overview
- The parenting apps market has evolved from simple utilities for developmental milestone tracking into complex, data-driven ecosystems. This transition is fueled by the integration of technologies like generative AI advice and IoT-enabled hardware, which enhance functionalities such as sleep and nutrition logging and AI-powered monitoring.
- The increasing focus on parental well-being represents a significant strategic pivot, with the incorporation of evidence-based mental health interventions and postpartum support tools becoming a key differentiator. This trend directly impacts boardroom decisions regarding product development and go-to-market strategy, necessitating investment in clinical validation to build trust and command premium pricing.
- Platforms that offer clinically-backed postpartum support tools have demonstrated 30% higher user retention in the first year compared to apps focused solely on infant metrics. Consequently, features like co-parenting tools, parental control software, and secure messaging are becoming standard, creating holistic solutions that cater to diverse needs from child safety features to family coordination tools.
What are the Key Data Covered in this Parenting Apps Market Research and Growth Report?
-
What is the expected growth of the Parenting Apps Market between 2026 and 2030?
-
USD 1.39 billion, at a CAGR of 17%
-
-
What segmentation does the market report cover?
-
The report is segmented by Type (Tracking apps, Information apps, Photo sharing apps, and Others), Application (Android system, IOS system, and Others), Deployment (Cloud-based, and On-premises), Revenue (Subscription-based, Freemium, Ad-supported, and One-time purchase) and Geography (APAC, North America, Europe, South America, Middle East and Africa)
-
-
Which regions are analyzed in the report?
-
APAC, North America, Europe, South America and Middle East and Africa
-
-
What are the key growth drivers and market challenges?
-
Integration of generative AI and community-powered validation, Stringent regulatory compliance and data privacy safeguards
-
-
Who are the major players in the Parenting Apps Market?
-
BabyCenter LLC, BabySparks LLC, Bark Technologies Inc., Glow Inc., FamilyWall Inc, Google LLC, Huckleberry Labs Inc., Kinedu Inc., Koninklijke Philips NV, Life360 Inc., Lovevery Inc, OurFamilyWizard LLC, Medela, Ovuline Inc., Peanut App Ltd, Qustodio LLC, Sittercity Inc, Solid Starts Inc, Tinybeans Group Ltd. and Winnie Inc
-
Market Research Insights
- Market dynamics are shifting from basic utility to holistic family support, driven by sophisticated user demands. Platforms incorporating virtual pediatric care show user engagement rates up to 40% higher than those without, demonstrating the value of integrated health services.
- The adoption of a digital citizenship curriculum within a parental control app has been linked to a 25% reduction in cyberbullying incidents, highlighting the move toward proactive education. Furthermore, enterprise adoption of family organization apps as an employee benefit correlates with a 15% decrease in absenteeism tied to childcare issues.
- This evolution sees the family locator app and child safety app converging with the child mental health app and neurodiversity support app, creating comprehensive ecosystems that address wellness, safety, and logistical needs for modern families.
We can help! Our analysts can customize this parenting apps market research report to meet your requirements.
 RIA -
RIA - 
